As a seasoned crypto investor with extensive experience in the market, I’ve grown accustomed to the volatile nature of digital assets like Ripple’s XRP. The current price action against the US Dollar (USD) on Bitstamp, where XRP is trading around $0.539 and has experienced a daily increase of 2.10%, piques my interest.
On May 27, 2024, I observed the XRP market on Bitstamp where it was trading against the US Dollar at around $0.539. This represented a daily growth of approximately 2.10%, or $0.01108. In this comprehensive analysis, I delve into the intricacies of XRP’s price fluctuations, pinpoint essential support and resistance levels, and speculate on potential future developments.
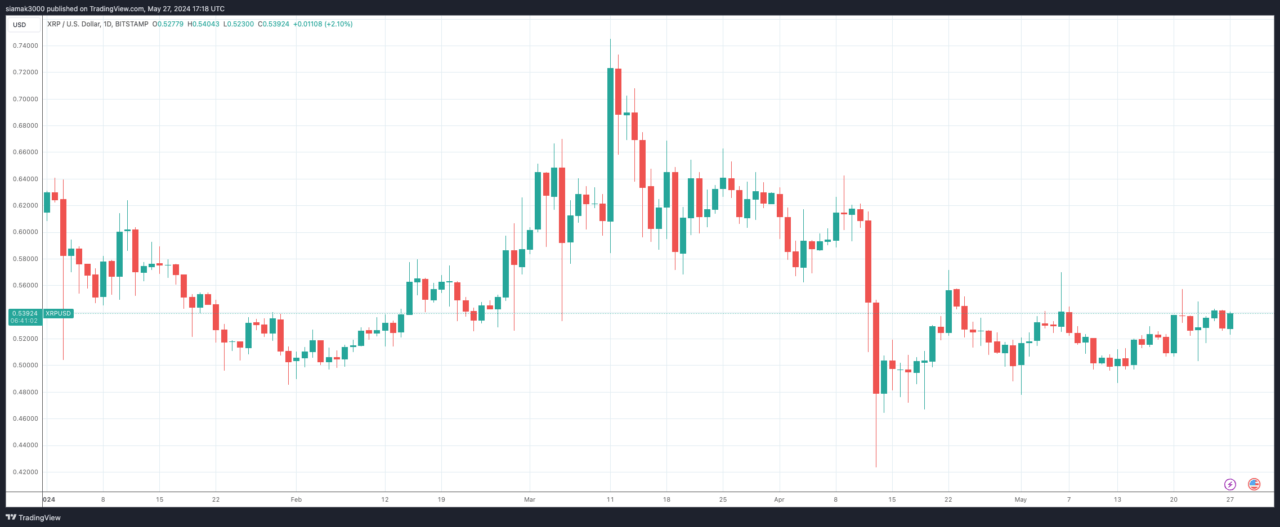
Overview of Current Market Conditions
The TradingView chart showcases an analysis of XRP‘s price trend over the daily (1D) timeframe, spanning from early 2024 up to the current date. This chart depicts a particularly volatile phase in XRP’s price history, marked by substantial price fluctuations that mirror both optimistic and pessimistic investor attitudes.
Key Observations
Trend Analysis:
- Volatile Movement: Since the start of 2024, XRP has exhibited considerable volatility. The price fluctuated between $0.42 and $0.74, indicating mixed market sentiment.Correction Phases: Several correction phases are visible on the chart, with the price experiencing sharp declines followed by partial recoveries.
Support and Resistance Levels:
- Support Levels: Key support levels are identified around $0.52 and $0.48. These levels have served as crucial buy zones where the price found support during downturns.
- Resistance Levels: The primary resistance level is at $0.54. A break above this level could signal the beginning of a more sustained upward movement.
Candlestick Patterns:
- Bullish Candles: The chart shows several bullish candles, particularly during recovery phases after significant drops, suggesting strong buying interest at lower levels.
- Bearish Candles: The presence of multiple bearish candles indicates periods of intense selling pressure, particularly during the correction phases.
Moving Averages:
- Short-Term Moving Averages: While not explicitly shown, short-term moving averages are likely to be close to the current price, reflecting the recent volatile trading environment.
- Long-Term Moving Averages: Long-term moving averages may be positioned below the current price, suggesting that the overall trend may still have a bullish undertone despite recent volatility.
Volume Analysis:
- Volume Spikes: Although volume data is not visible on the chart, volume spikes typically align with significant price movements, confirming the strength of these movements.
Potential Scenarios
Bullish Scenario:
- Breakout Above $0.54: If XRP breaks and sustains above the $0.54 resistance level, it could signal further upward movement. The next target might be around $0.60 or higher, based on previous patterns of price behavior after breaking significant resistance levels. This scenario would indicate renewed buying interest and could lead to a more stable uptrend.
Bearish Scenario:
- Failure to Break $0.54: If XRP fails to break above $0.54, it could result in a pullback to the nearest support levels around $0.52 or $0.48.Extended Correction: A more significant correction could drive the price back to around $0.42, the next major support level.
Conclusion
Based on the chart’s analysis, the mood is somewhat hopeful but with a degree of caution, as XRP hovers near the $0.54 resistance point. The pattern shows both positive and negative fluctuations, while various support levels help mitigate possible declines. Keep a close eye on XRP’s movements around the $0.54 threshold to gauge future price tendencies.
Should XRP surpass and maintain this significant resistance point, it may open the door for additional gains, possibly reaching toward $0.60 or even beyond. On the other hand, if XRP is unable to breach $0.54, there’s a risk of a reversal, with $0.52 and $0.48 emerging as essential support thresholds to keep an eye on.
Read More
- Apothecary Diaries Ch.81: Maomao vs Shenmei!
- 30 Best Couple/Wife Swap Movies You Need to See
- USD ILS PREDICTION
- DC: Dark Legion The Bleed & Hypertime Tracker Schedule
- Ncuti Gatwa Exits Doctor Who Amidst Controversy and Ratings Crisis!
- 9 Kings Early Access review: Blood for the Blood King
- Every Minecraft update ranked from worst to best
- Clair Obscur: Expedition 33 – All Act 3 optional bosses and where to find them
- Summoners War Tier List – The Best Monsters to Recruit in 2025
- 10 Shows Like ‘MobLand’ You Have to Binge
2024-05-27 20:34