In the last 24 hours, the token of the XDC Network has bucked the overall market trend, registering a 7% increase and leading as the top performer among significant digital currencies.
Showing robust positive momentum, it appears that XDC could continue its upward trend in the near future, as we delve into recent market patterns and propose possible price objectives for this digital currency.
XDC Sees Surge in Demand on the Daily Chart
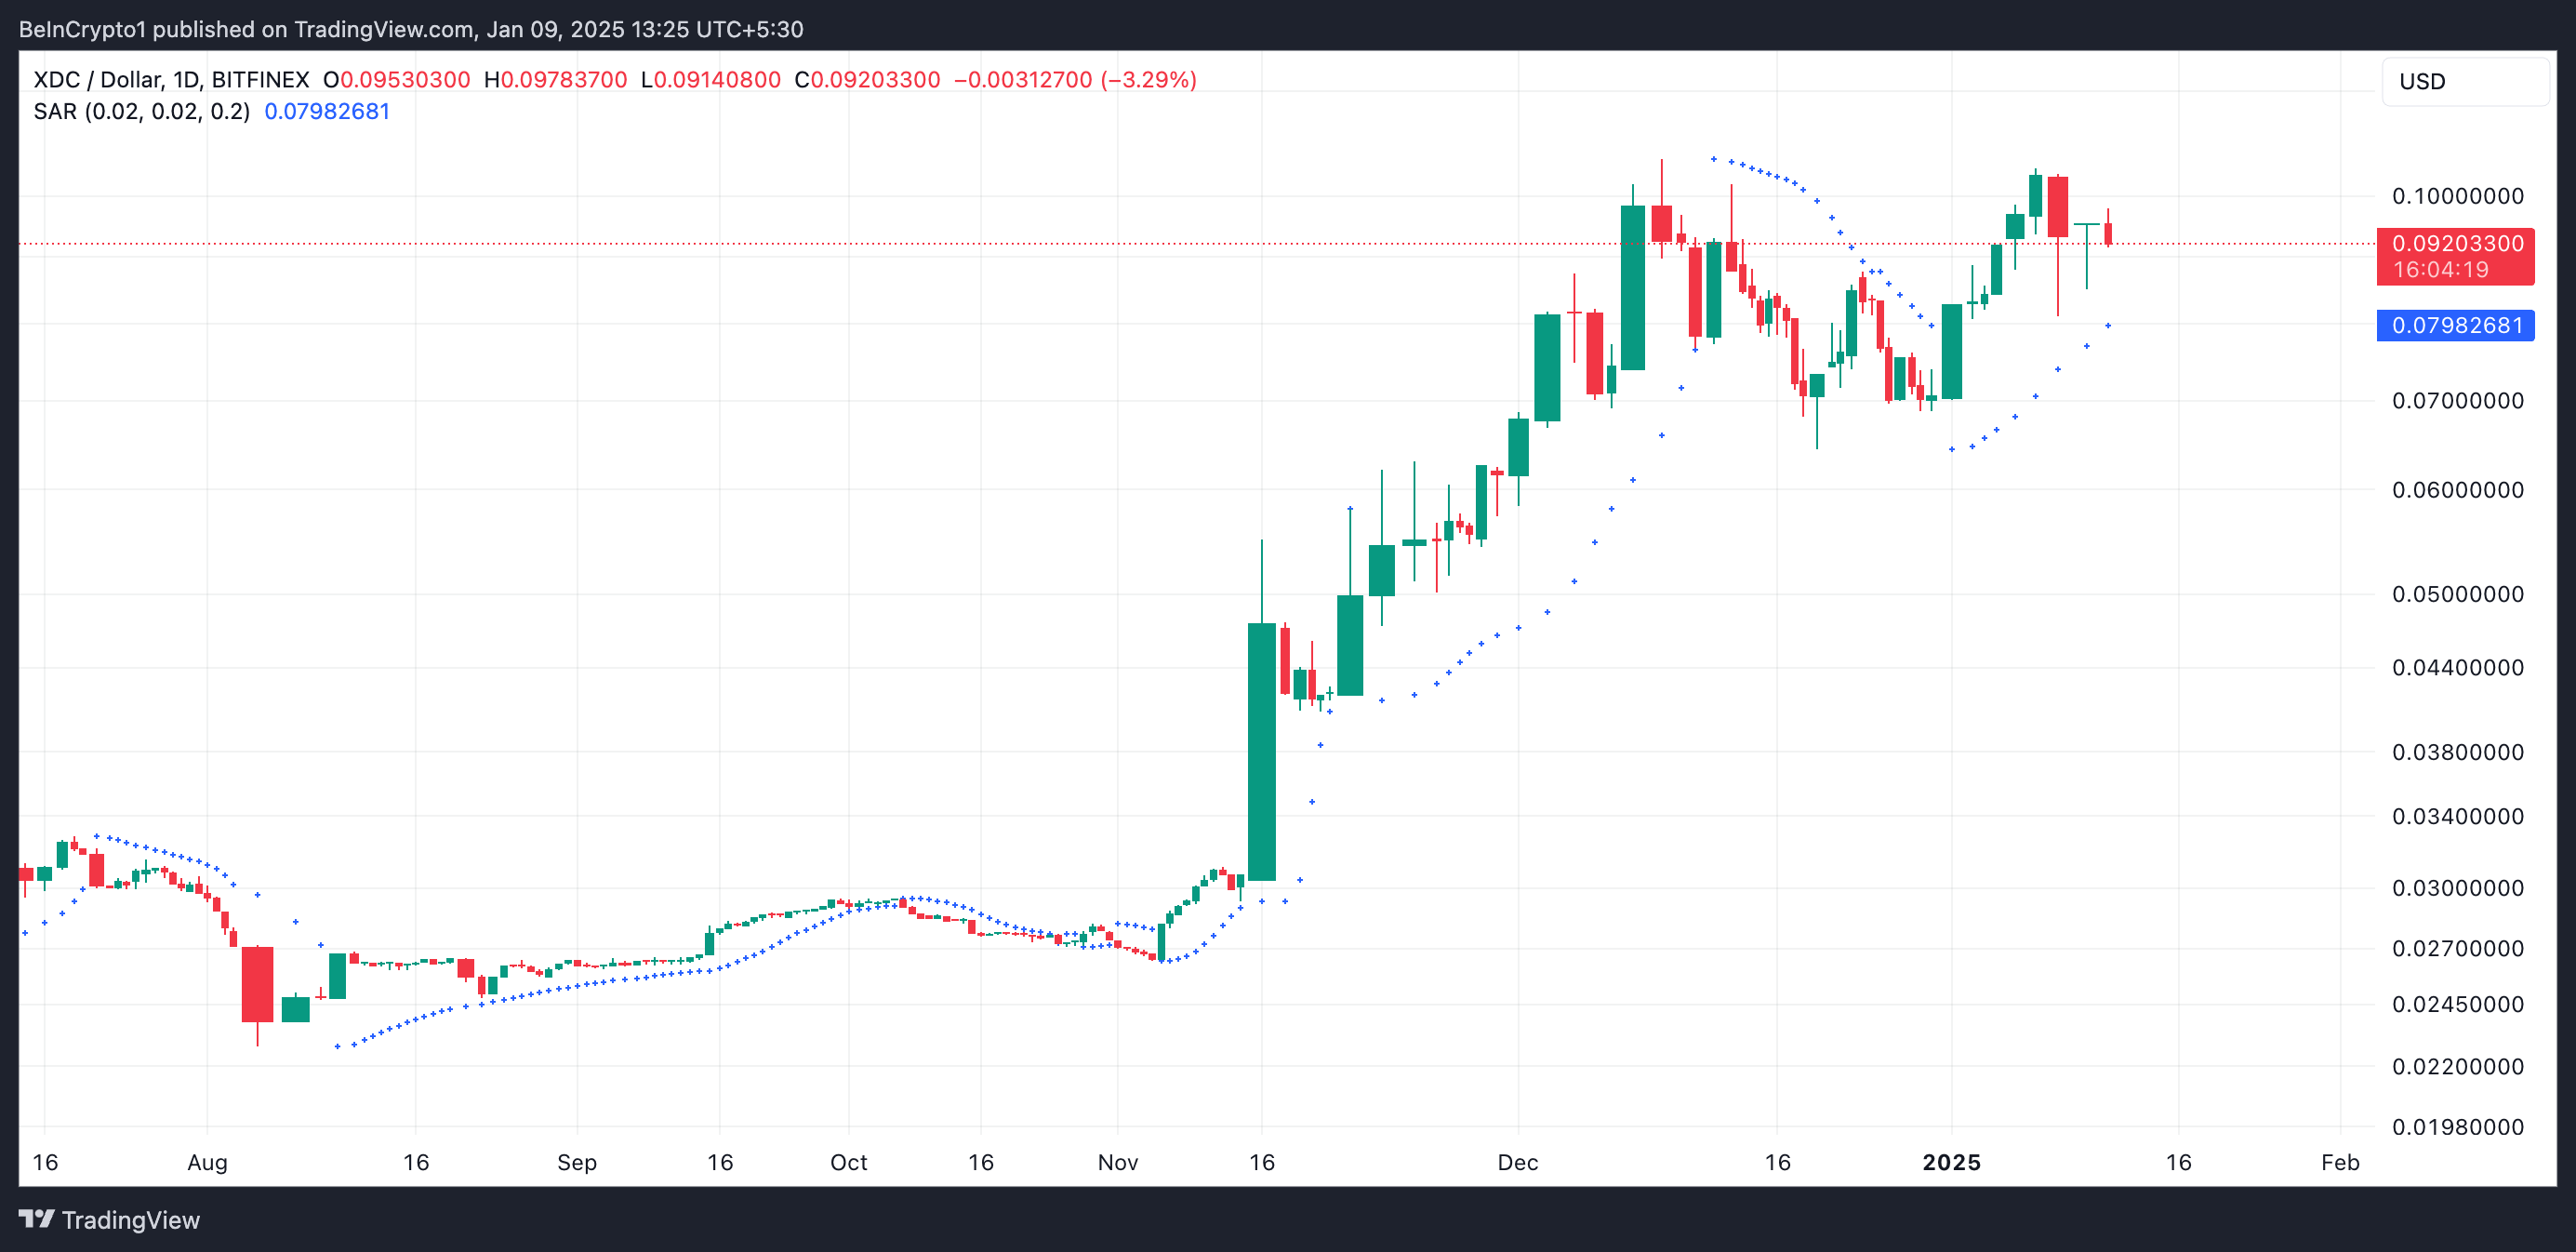
At present, the trading price of XDC is higher than the dots on its Parabolic Stop and Reverse (SAR) chart. This tool monitors the trend of an asset’s price and predicts potential reversals by placing dots either above or below the asset’s price line.
When the value of the asset exceeds the locations where the SAR (Stop and Reverse) line is drawn, this often implies an uptrend, suggesting strong bullish sentiment. On the flip side, if the price falls below the SAR line positions, it could be a signal that a downtrend or potential bearish turn of events might be happening.
As a crypto investor, I find the configuration of the Parabolic SAR indicator for XDC particularly bullish. This suggests that there’s a positive outlook among market participants towards XDC, potentially pointing towards further profits in the near future.

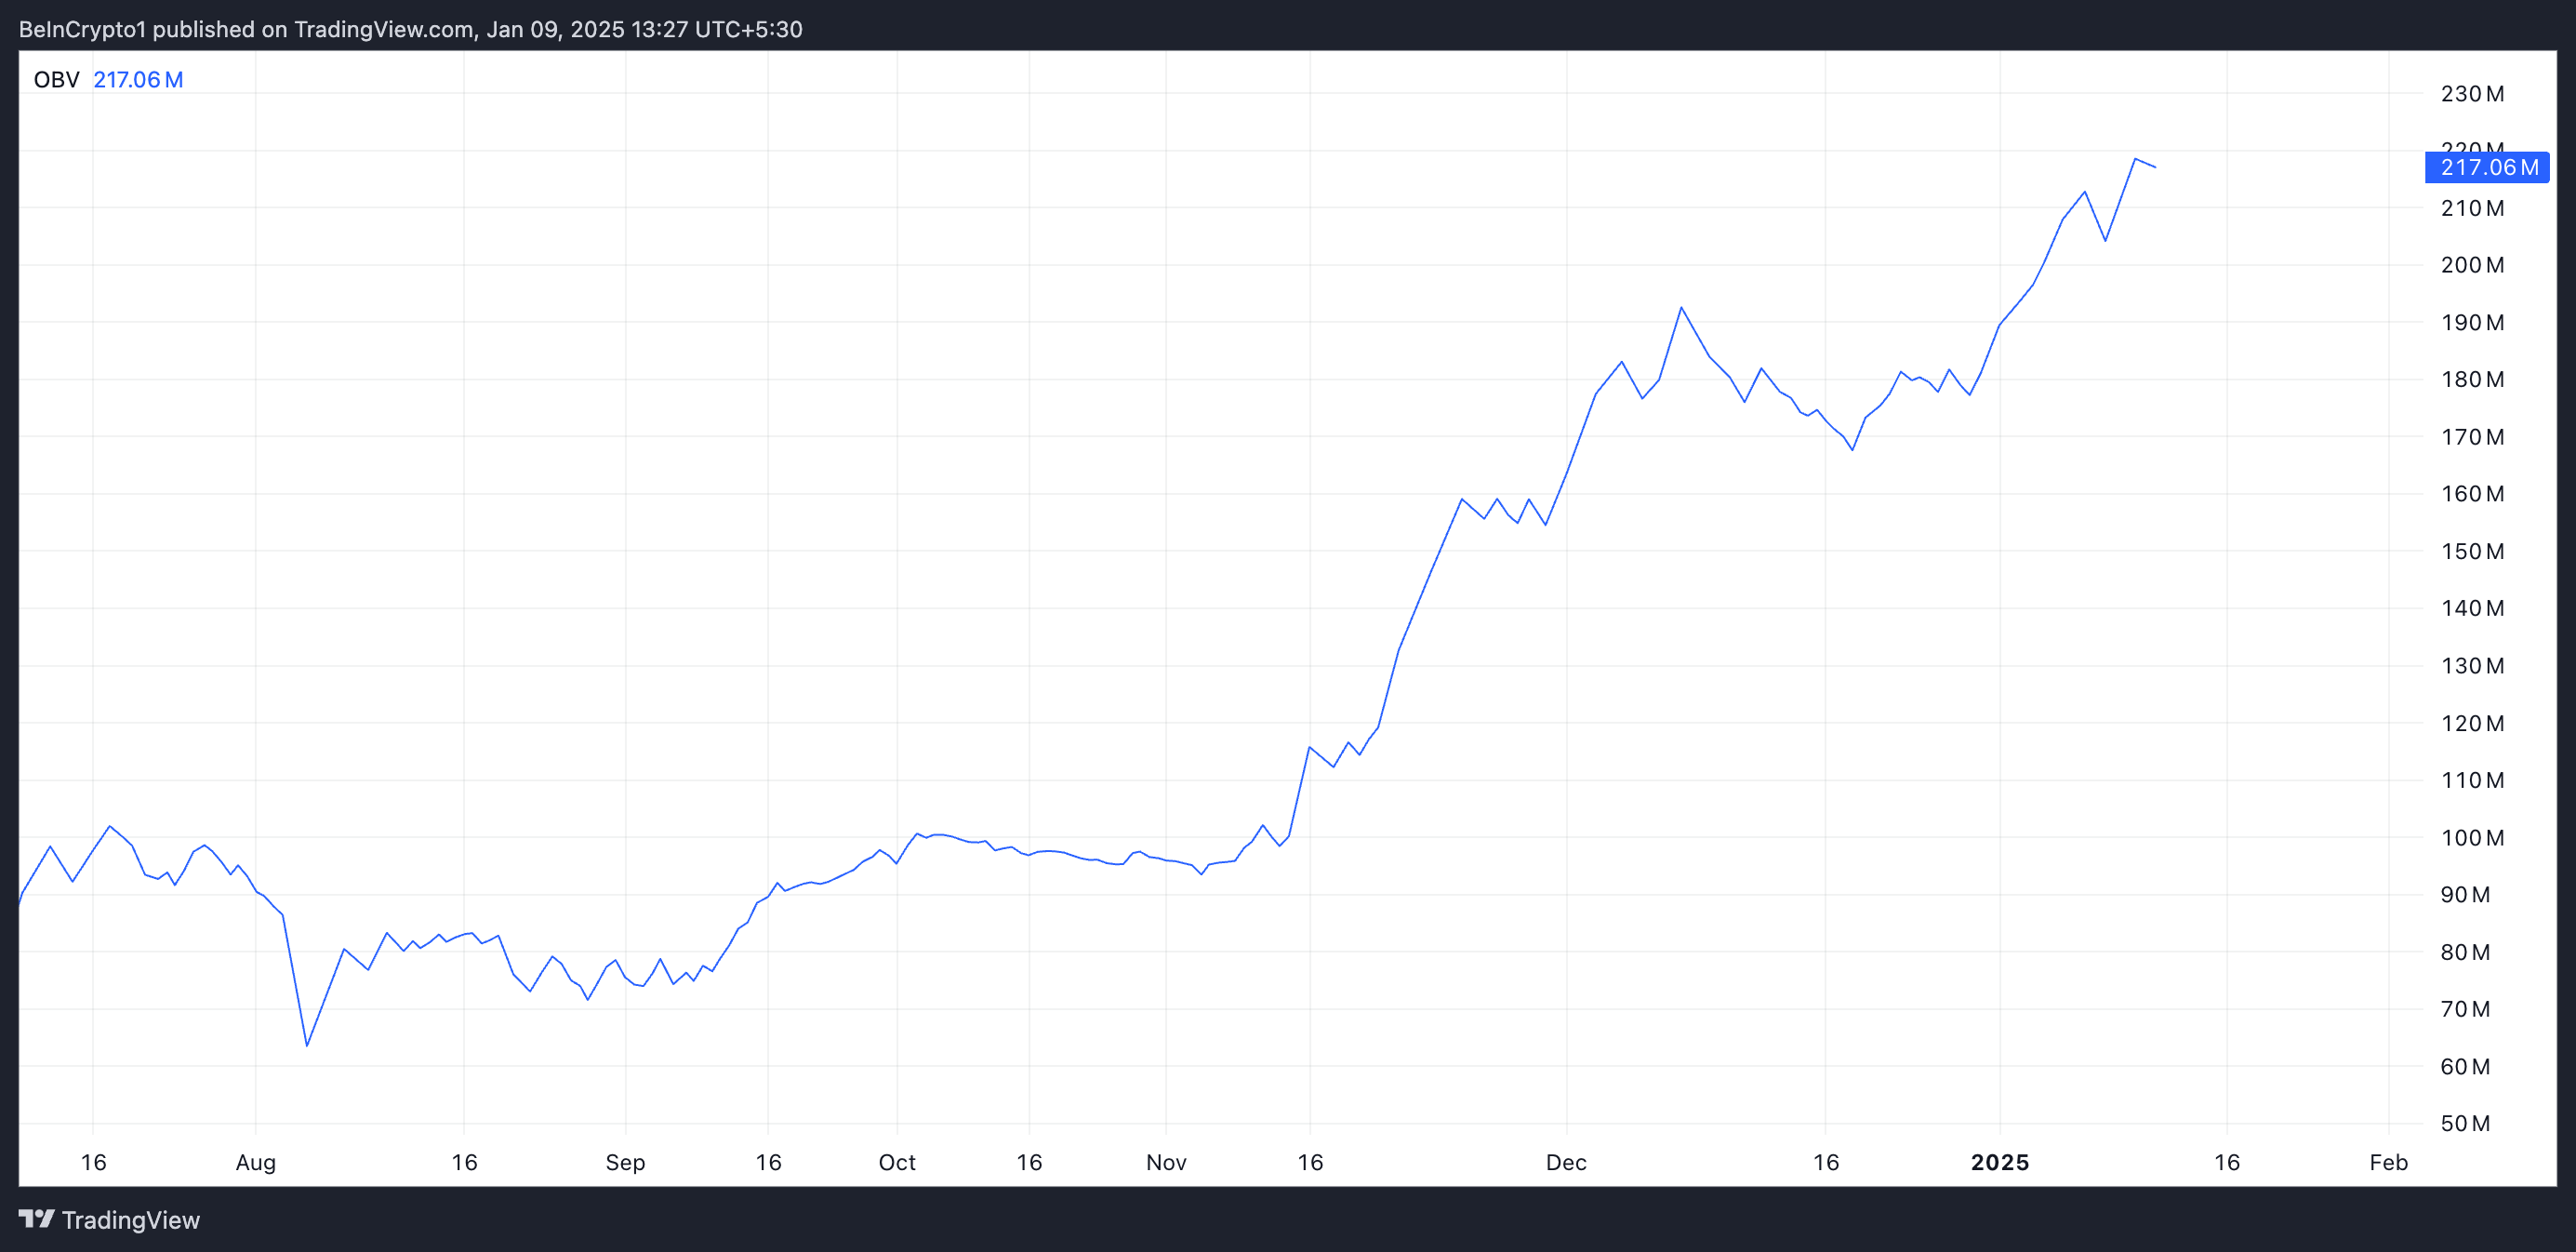
Furthermore, the increasing On-Balance-Volume (OBV) of XDC suggests a surge in interest for the altcoin, indicating rising demand. Currently, this momentum indicator, which gauges an asset’s buying and selling pressure, is trending upward with a value of 217.06 million.
When a security’s On-Balance Volume (OBV) increases significantly, it usually indicates robust buying activity, which might indicate the persistence or further progression of an upward trend.

On the other hand, several XDC futures traders are questioning the upward trend since the token’s negative funding rate suggests a high demand for short positions. At the moment, it stands at -0.06.
In simpler terms, the funding rate is a continuous payment made among traders in markets for ongoing futures contracts. This fee adjusts the balance between those who hold long positions (believing the asset’s price will rise) and those with short positions (expecting it to fall). A negative funding rate implies that short positions are paying the long ones, which shows a bearish sentiment as traders anticipate the asset’s value to decrease.

XDC Price Prediction: Short Squeeze Looms as Bullish Momentum Builds
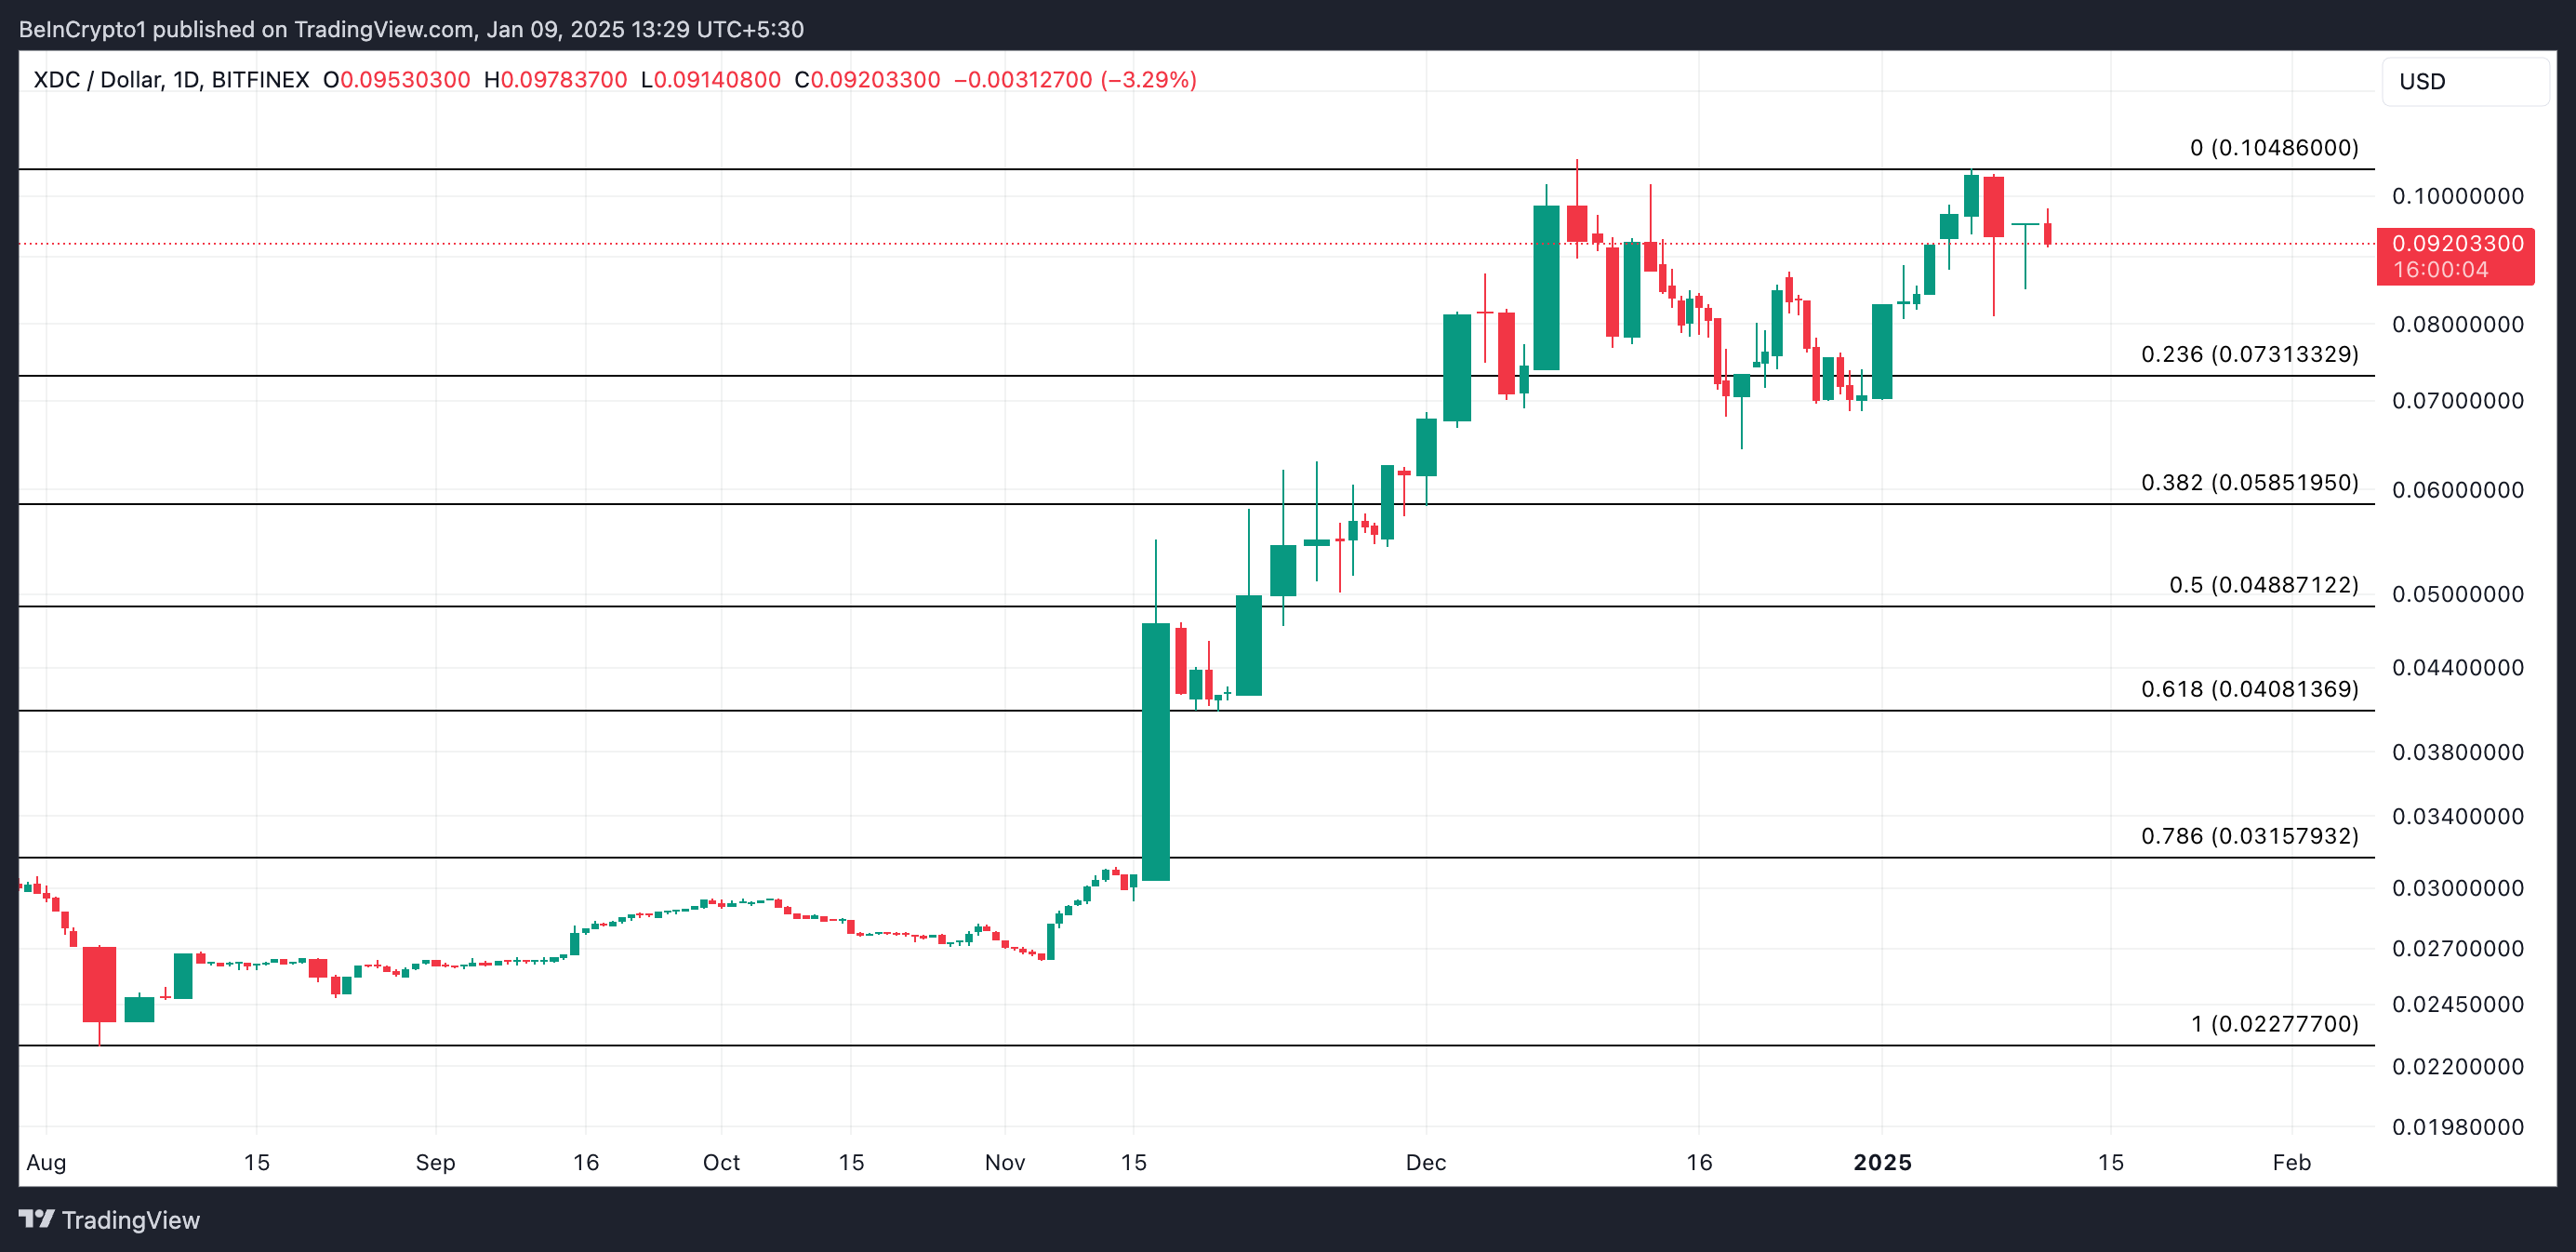
If the positive trend persists for XDC, it might force those who have sold it short to buy back their shares due to a “short squeeze.” In this situation, the price of XDC might reach as high as $0.10, causing the termination of certain short positions.

If the demand for purchasing XDC decreases, its value might fall back to $0.07, potentially providing an opportunity for traders who sell short.
Read More
2025-01-09 15:21