Well, folks, Tron is prancing around at a cheeky $0.3322 – just a smidge below where it was yesterday (fancy that), slipping 0.42%, with a not-so-dramatic 1.08% dip over the past week. So much excitement, right? Slight movement, but all the other signs are basically throwing a party headlined by “Things Might Get Wild Soon!” 🎢
Market cap? A modest $31.47 billion-nothing to sneeze at if you’re into the crypto rodeo. Daily trading volume has shot up 26.28% to $931 million, making Tron the apple of retail and institutional investors’ eyes. But wait, there’s drama! The failed breakout at $0.334 and Tron Inc.’s $1B shelf filing-sounds fancy, but also a bit ominous-have cast shadows heavier than your grandma’s curtains. Still, on-chain metrics are painting a bullish picture, so grab your popcorn – this price analysis is about to get spicy.
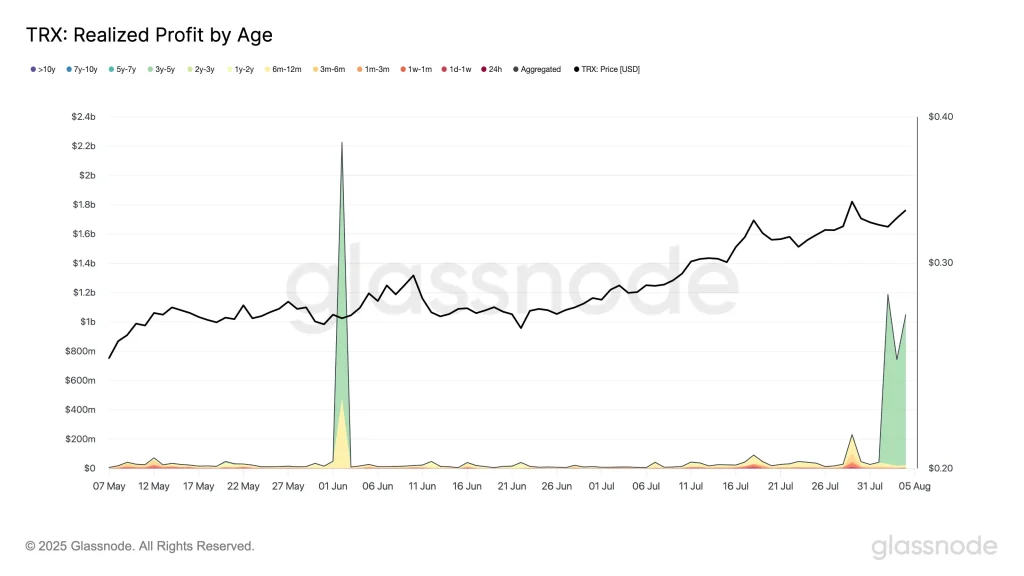
Burns, Big Whales & Profit-Grabbers
TRX’s burn mechanism? Totally the star of the show. Over 40 billion TRX has gone up in flames-literally-burned. August alone saw a fiery 1.1 billion TRX obliterated. And we’re just in the first week of the month. If this pace keeps up, bull trends could be breathing easier, thanks to that long-term supply squeeze. Lovely stuff, really.
And then there are the whales. IntoTheBlock reports a dizzying 1269% jump in 30-day large-holder inflows-that’s not your everyday fart, folks. Usually, such spikes spell volatility, but hey, they also mean some serious accumulation. The catch? Long-term holders made a cool $1.4 billion in profits, mostly in the 2-3 year cohort. So, are they celebrating or running for cover? Only time will tell. The tug-of-war between profit-takers and fresh buyers makes the next few days pretty much the crypto version of a reality show.
Keep your eyes peeled-this cosmic dance of profits and new coins will decide TRX’s fate. Will it soar or stumble? Only the next episode will reveal the drama.
TRX Price Analysis: The Calm Before the Storm?
Plot twist: TRX’s daily RSI is sitting at 65.29-just below overbought territory, which is basically like standing at the edge of a cliff, hesitating to jump. The recent rejection of Fibonacci resistance at around $0.334 confirms this level as a stubborn ceiling, like that one friend who can’t admit they’re wrong.
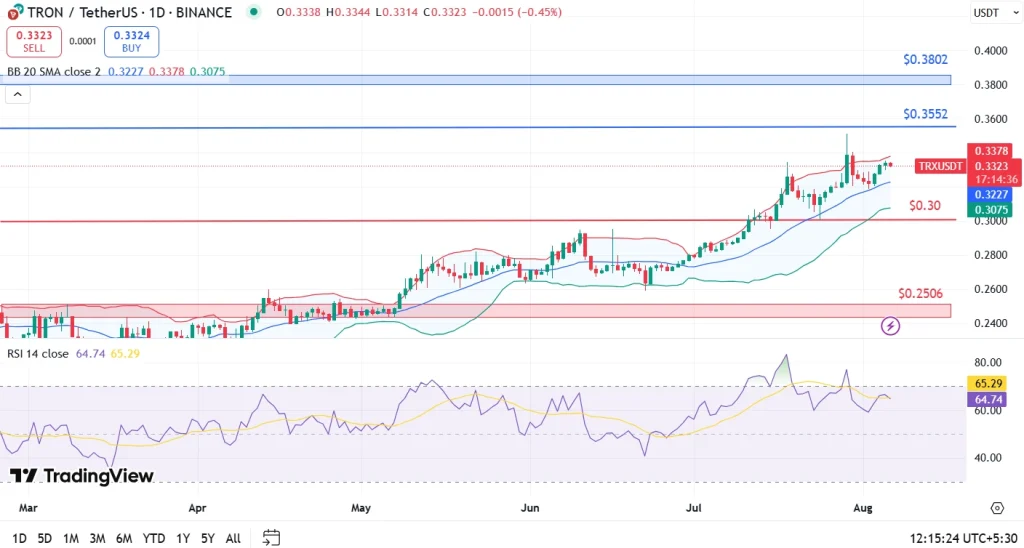
The immediate support? Around $0.30, where the 20-day SMA lounges comfortably, like a cozy sofa. Below that, $0.2506 provides a deeper cushion-like finally falling into bed after a long day. If bulls get creative and push past $0.334, be ready for the next resistance at $0.3552, with a tantalizing goal of $0.3802. Fail? Well, then the bears might just throw a tantrum, especially if the broader macro-market decides to be moodier than a teenager.
Quick FAQ: Crypto-Drama Edition
Why did TRX dip even when whales were splashing around inflows? Because profit-taking and the resistance rejection cooked up a cocktail that the whales couldn’t resist. Even big players have to cash out sometimes, darling.
Is TRX deflationary? Absolutely. Over 40 billion TRX has been burned, and August alone saw 1.1 billion doing a disappearing act. It’s like a magic show-now you see it, now you don’t.
What’s the next big level TRX needs to conquer? That sweet spot is above $0.334. If it breaks and holds, the next goals are $0.3552 and then a bold leap toward $0.38. But beware of the bears-hiding behind every corner.
Read More
- Gold Rate Forecast
- Silver Rate Forecast
- 15 Films That Were Shot Entirely on Phones
- 22 Films Where the White Protagonist Is Canonically the Sidekick to a Black Lead
- How to Do Sculptor Without a Future in KCD2 – Get 3 Sculptor’s Things
- Here are the Best Series to Binge on Paramount+ in January 2026
- 14 Movies Where the Black Character Refuses to Save the White Protagonist
- Why Won’t It Just *Do* What You Ask? Unpacking the Quirks of AI Language
- 20 Movies Where the Black Villain Was Secretly the Most Popular Character
- Superman Flops Financially: $350M Budget, Still No Profit (Scoop Confirmed)
2025-08-06 11:50