In the last fortnight, Ethereum has witnessed a robust surge, climbing from around $1,500 to over $2,600. Yet, indications of fatigue are emerging. Although long-term trends continue to lean bullish, there’s a need for short-term vigilance.
Technical Analysis
By ShayanMarkets
The Daily Chart
Currently, Ethereum (ETH) has reached a technical barrier close to the $2,900 mark, which coincides with its 200-day moving average. Previously, this area was significant because it marked a substantial drop in February, and now it’s acting as an area where sellers are offering their supply. Additionally, the Relative Strength Index (RSI) has moved into overbought territory, hinting that the pace of increase may be slowing as ETH approaches this resistance level.
A rejection from here could lead to a pullback toward the $2,200 support zone and the 100-day MA located near the $2,100 mark. A confirmed breakout above $2,900 would shift the bias back to bullish, with a potential continuation toward the critical $4,000 zone.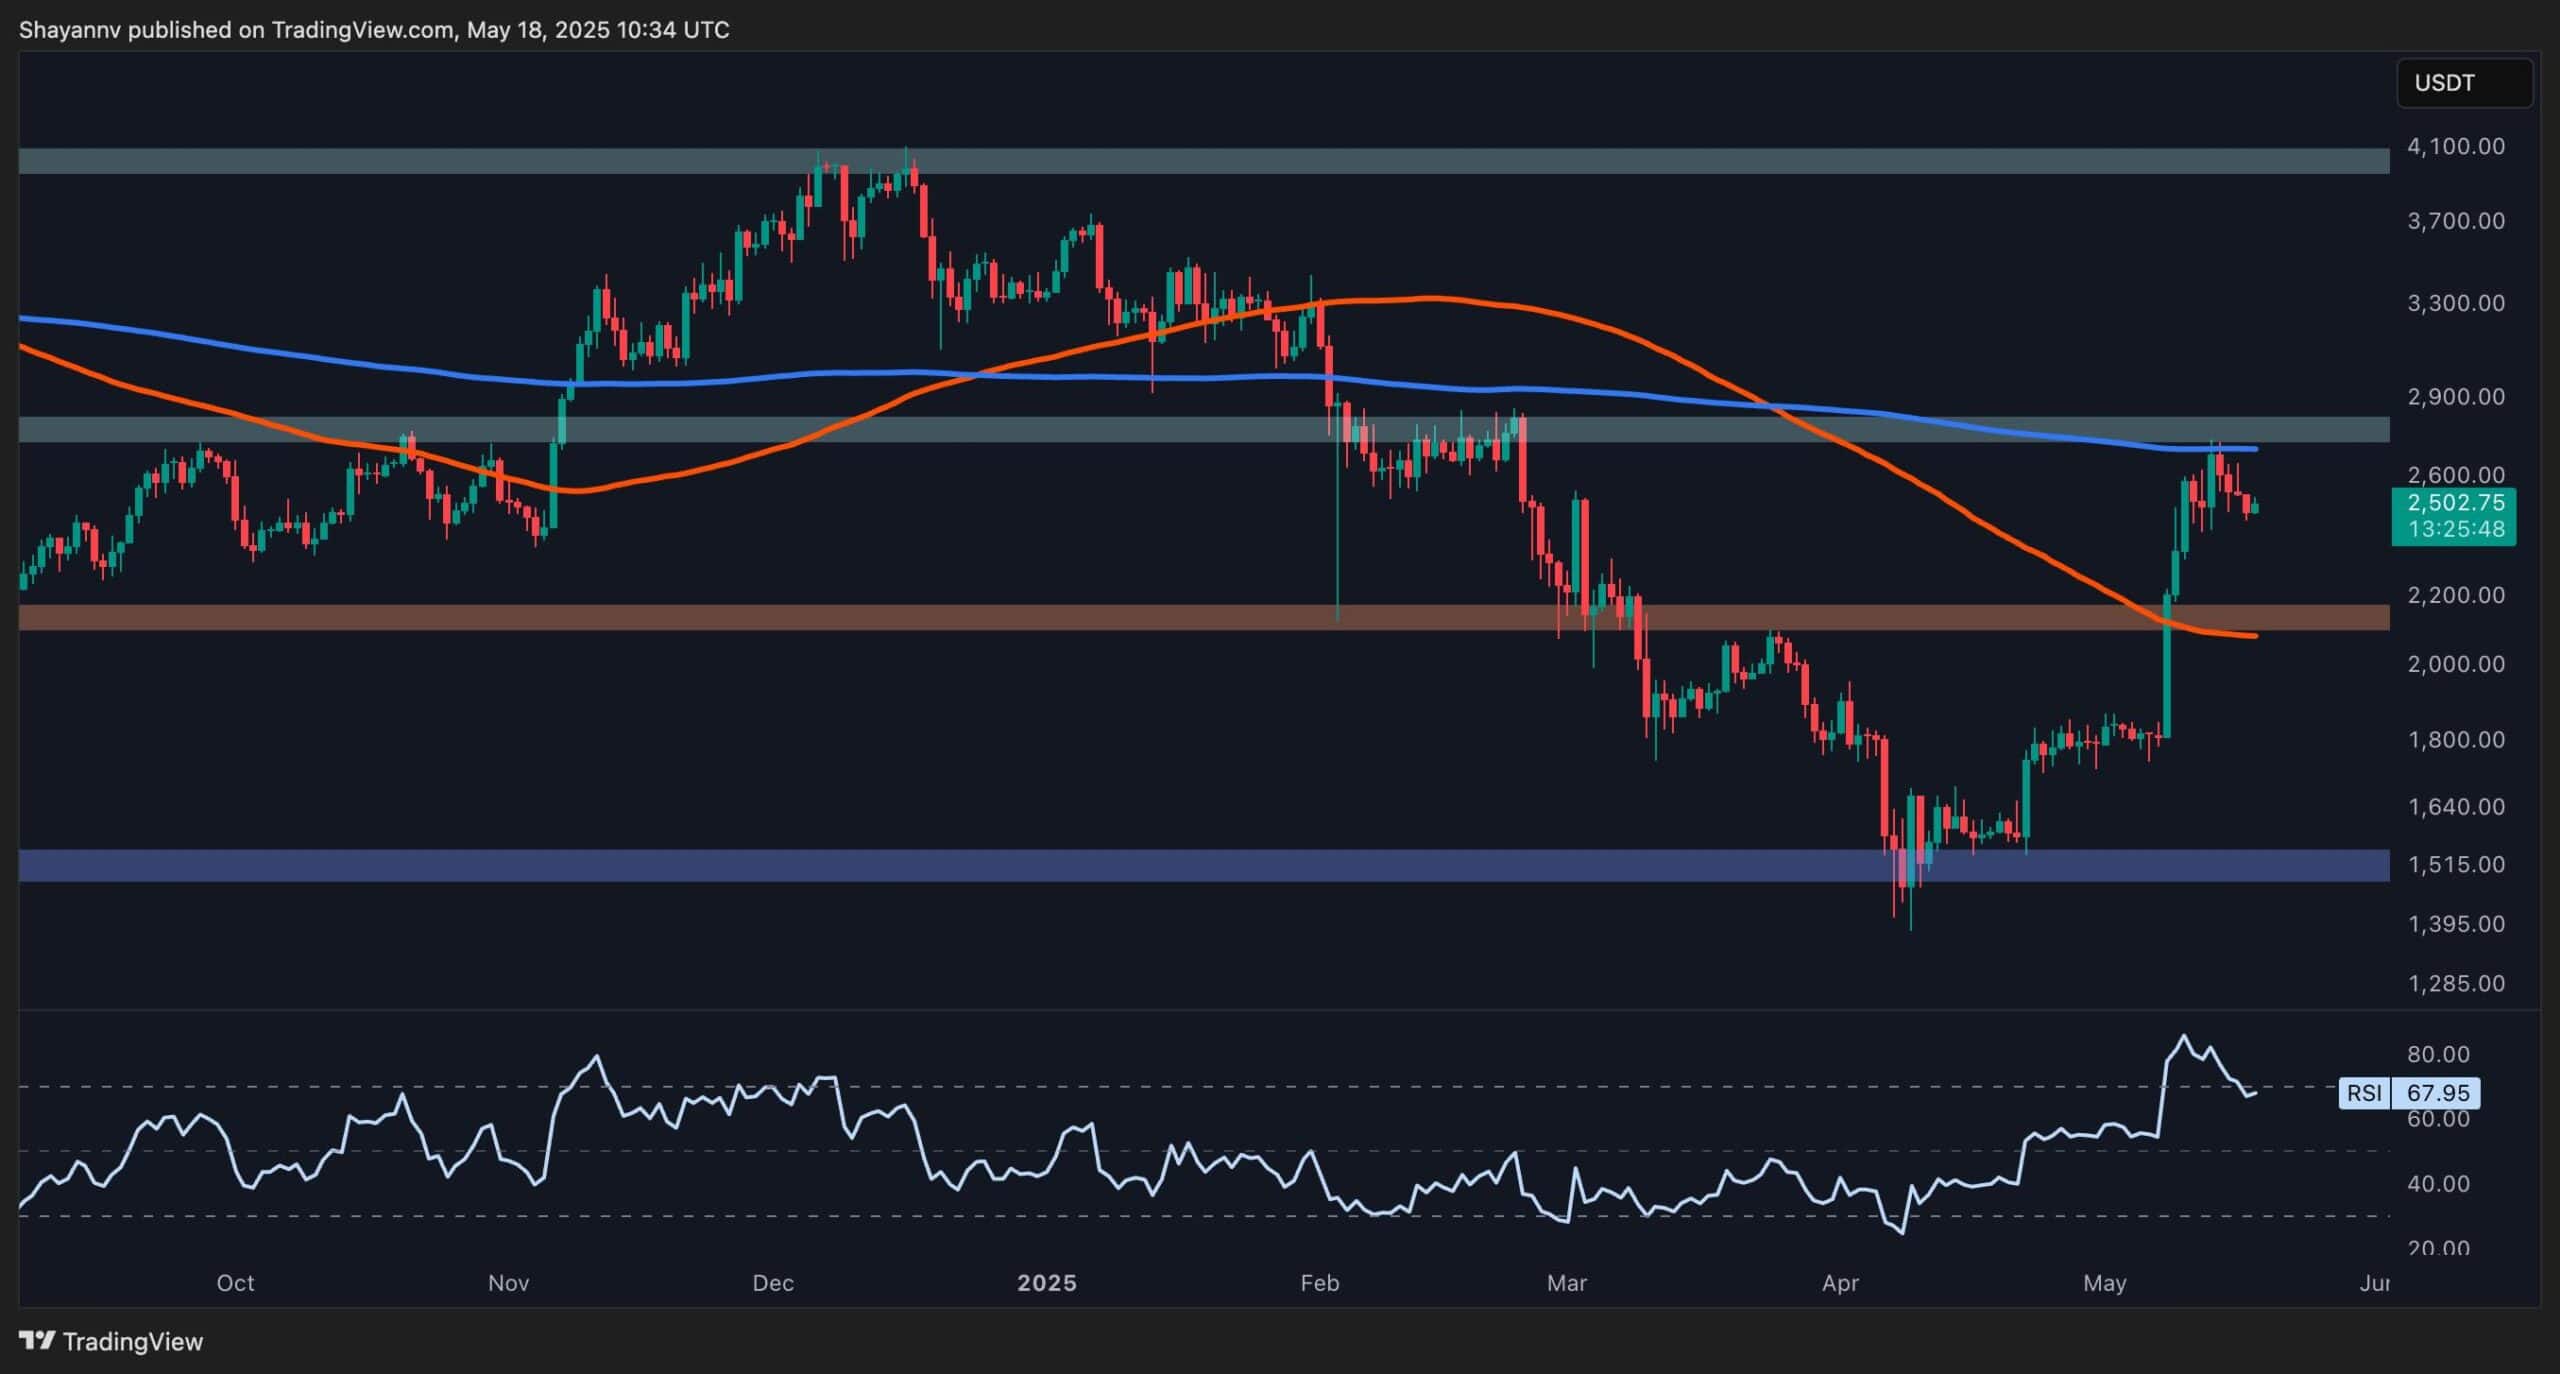
The 4-Hour Chart
On a 4-hour scale, Ethereum appears to be losing some strength in its momentum. Following a powerful surge past $2,100, the price has been holding steady within a limited band around $2,500-$2,600.
A clear bearish divergence is now confirmed on the RSI, with price making higher highs while RSI makes lower highs. This typically indicates a potential correction ahead. If ETH loses the $2,450 support, a retracement toward $2,200 and even $2,050 becomes likely. On the flip side, reclaiming $2,600 with strong volume could invalidate the bearish signals and open the path for a run at the $3,000 area.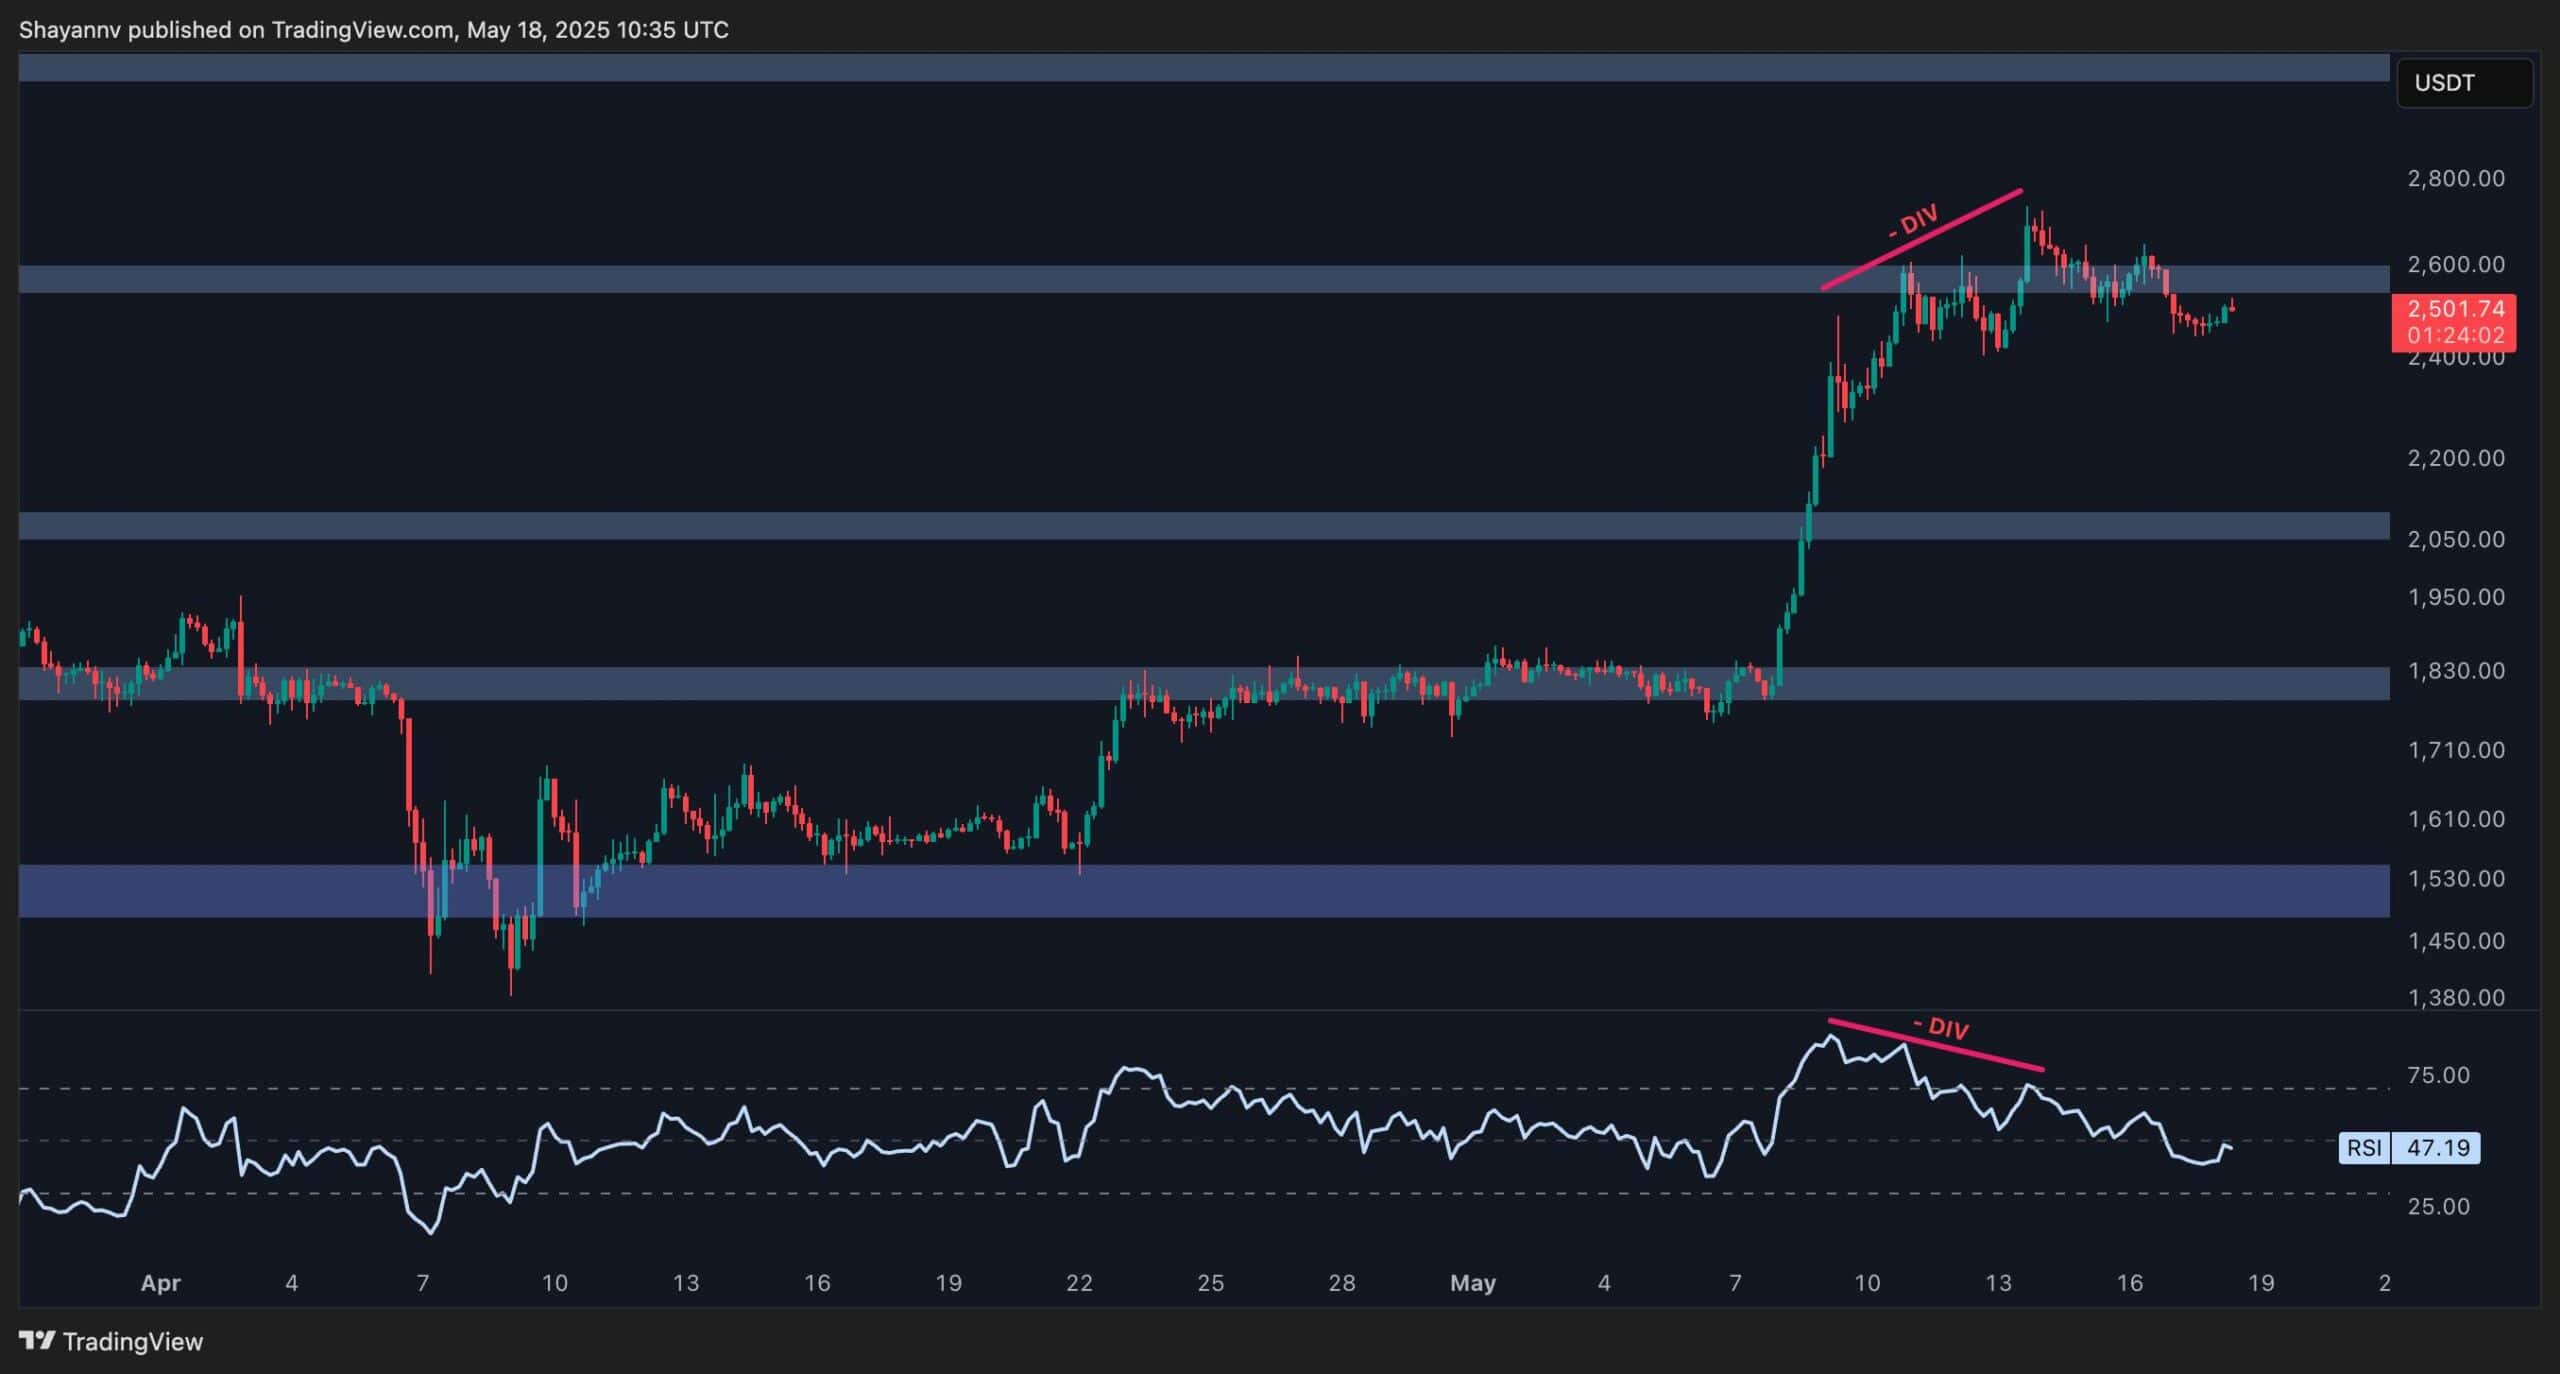
Sentiment Analysis
The latest surge in prices led to a significant number of traders having to buy back their previously sold shares (short liquidations), which accelerated the price increase. On the short liquidation graph, it’s evident that the most liquidations happened around $2,400-$2,600, suggesting many sellers were compelled to exit the market under pressure. This trend often causes a temporary slowdown as the momentum behind the rally starts to diminish.
The liquidation chart shows a clear uptick in forced closures over the past week, aligning with Ethereum’s breakout. These spikes often mark local tops, as the removal of excessive short exposure removes the momentum driver. With liquidations now tapering off, the price may struggle to push higher without fresh demand entering the market. This context reinforces the idea that ETH could consolidate or correct before any meaningful continuation.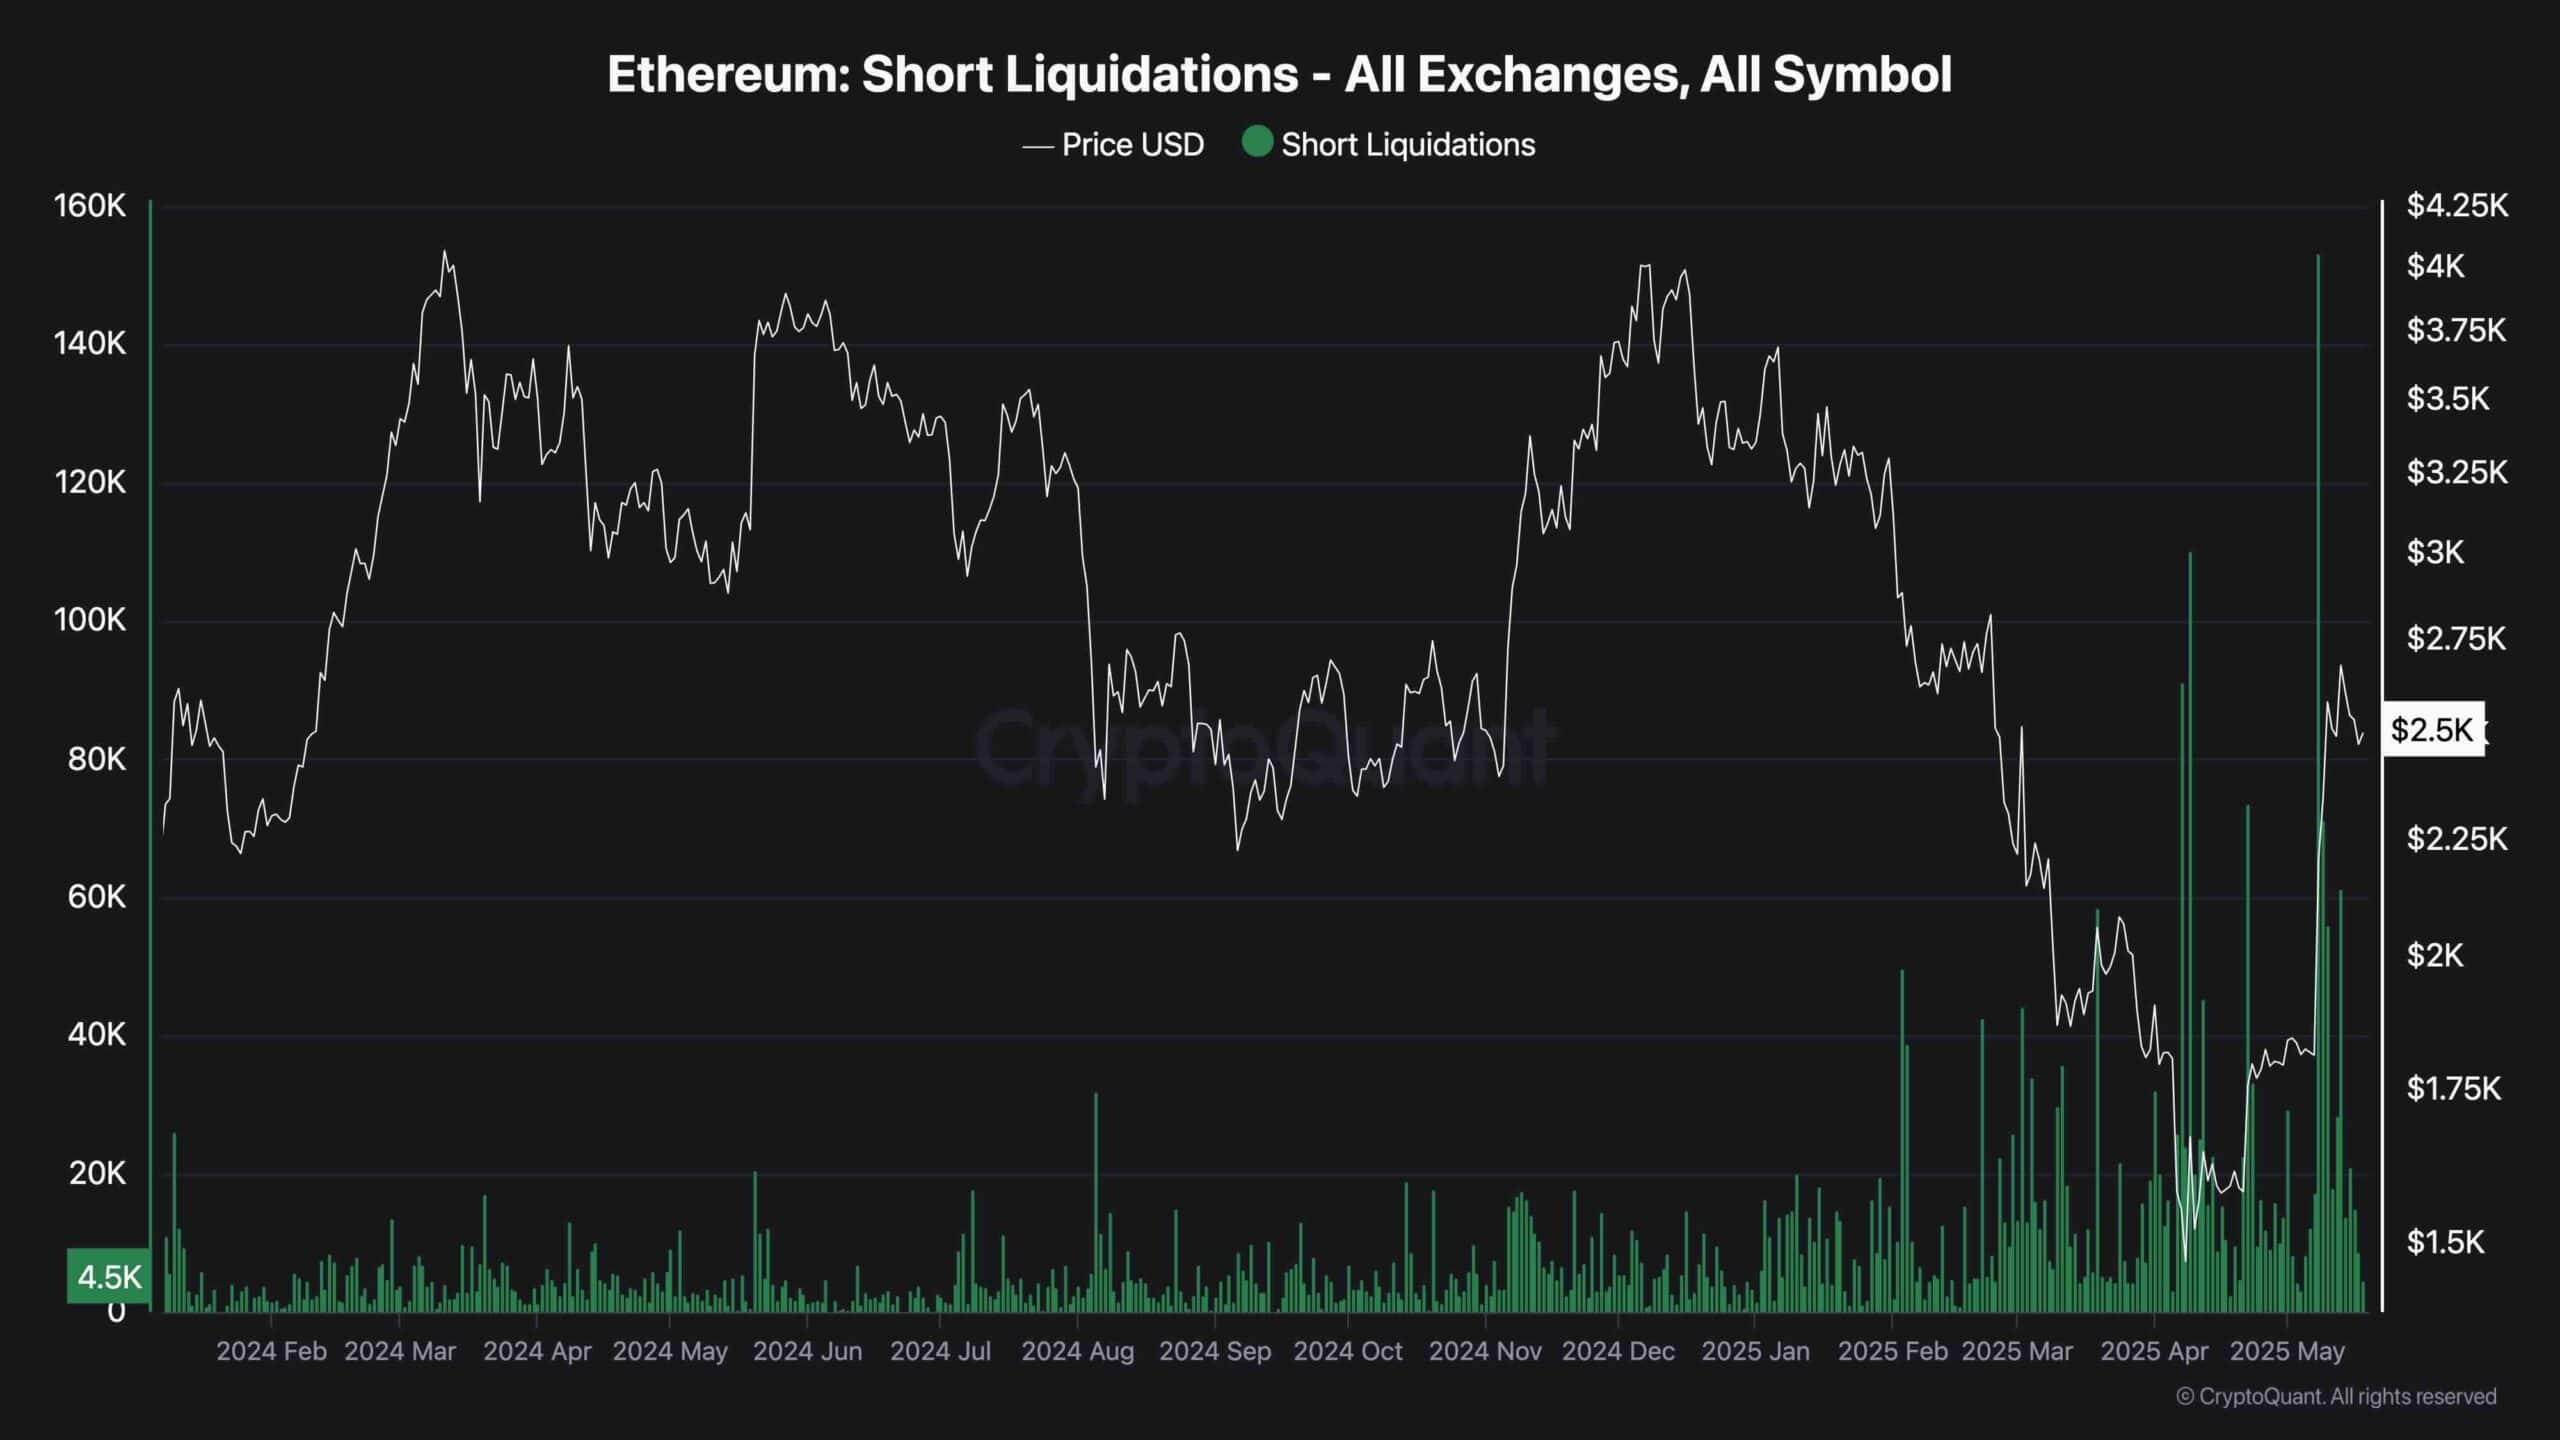
Read More
2025-05-18 18:27