In the chaotic carnival of bitcoin trading, where fortunes are made and lost faster than a magician’s rabbit can disappear, the ability to pinpoint key price levels is akin to finding the Holy Grail. Among the myriad of tools at the disposal of the technical analyst, Fibonacci retracement emerges like a shimmering beacon of mathematical grace and practical wisdom.
Fibonacci Retracement: The Enigmatic Oracle
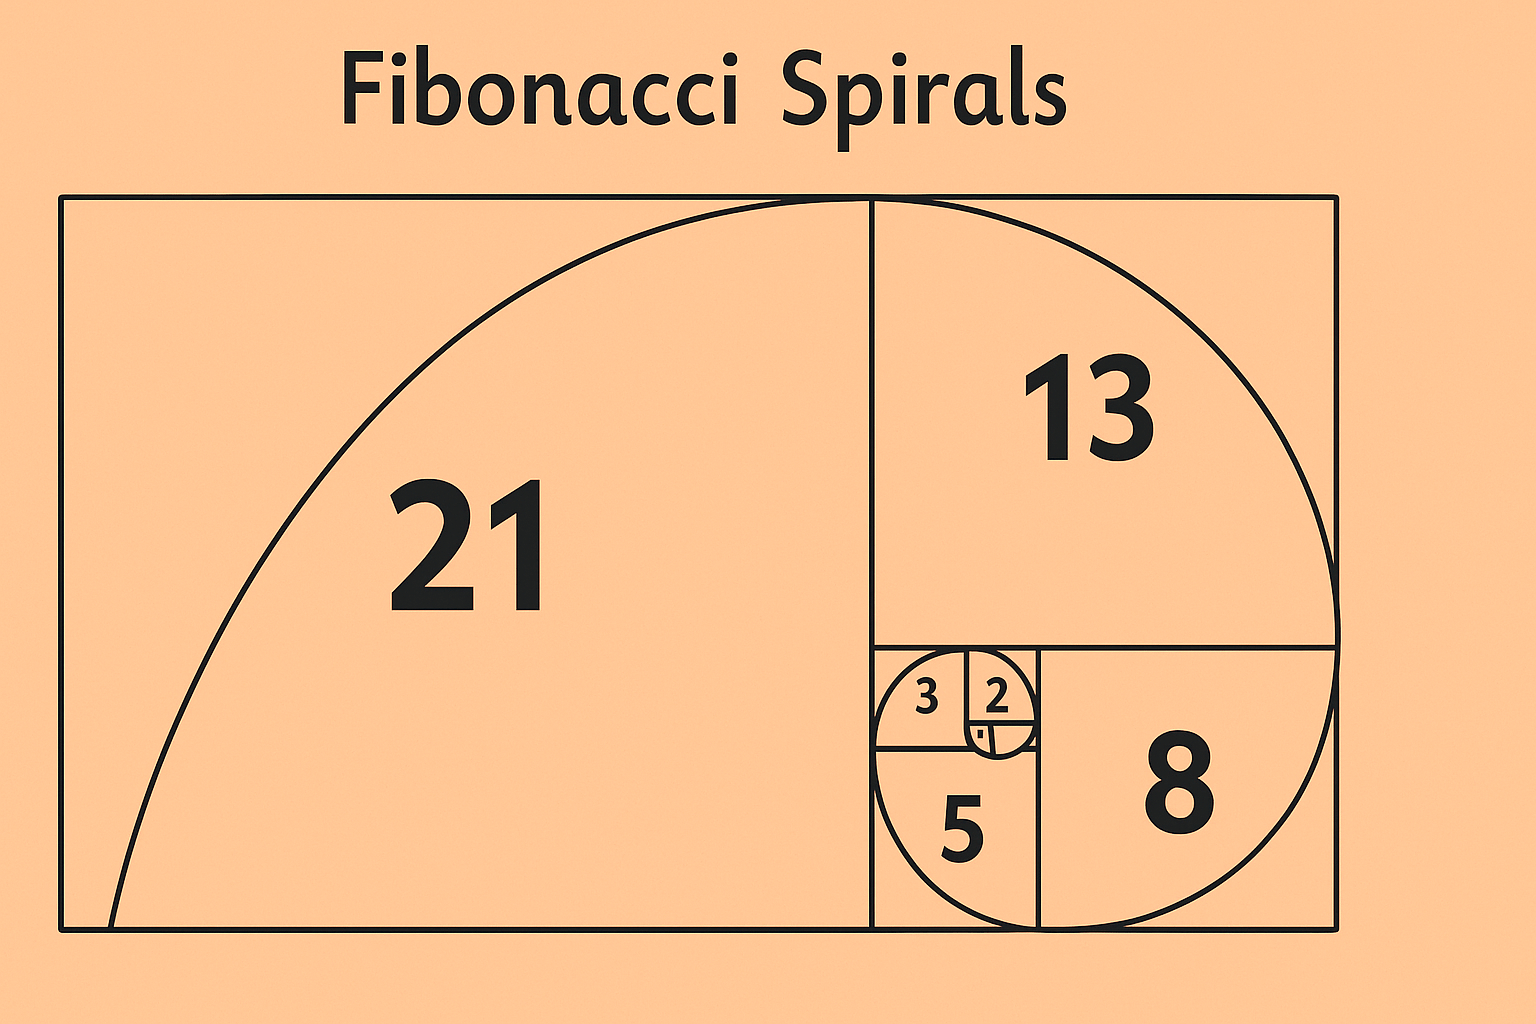
Ah, Fibonacci retracement! This mystical tool, a veritable crystal ball for traders, reveals potential support and resistance levels by examining the vertical distance between two extreme points—typically a high and a low. Born from the brilliant mind of the 13th-century Italian mathematician Leonardo Fibonacci, this sequence, where each number is the sum of the two preceding ones, gives rise to ratios that are as prevalent in nature as they are in the unpredictable realm of financial markets. Who knew math could be so… fashionable?
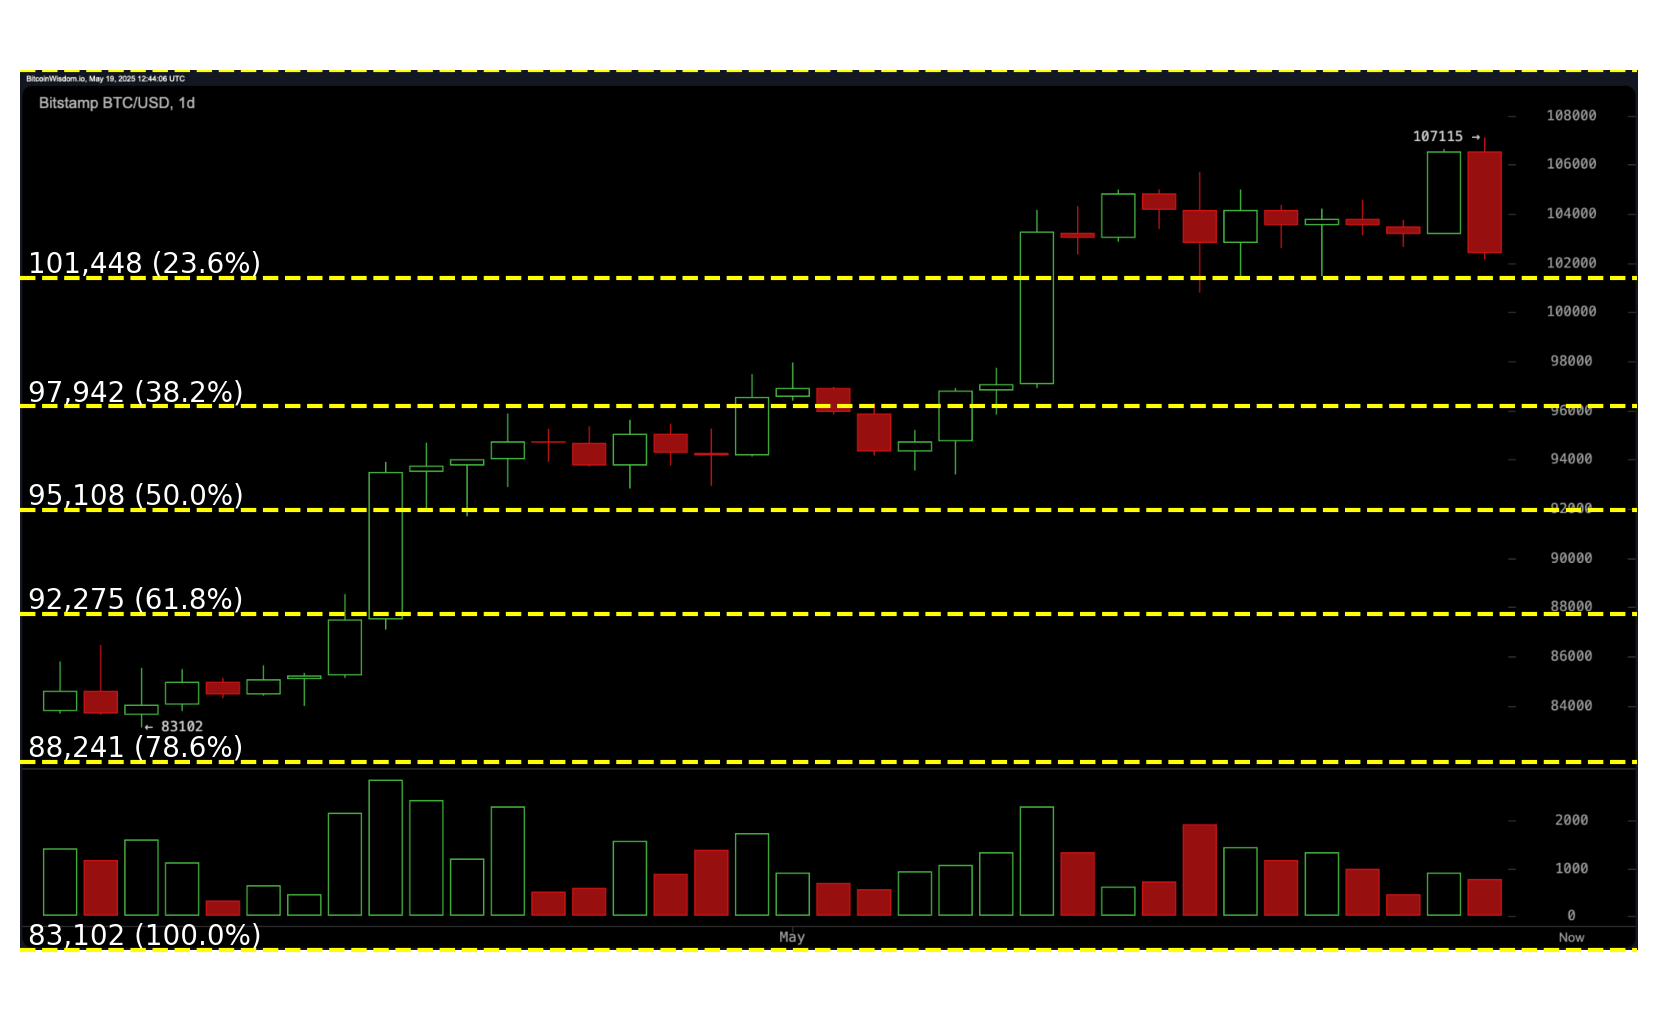
In the wild world of bitcoin trading, Fibonacci retracement levels are drawn between a high and low point on a chart, predicting possible reversal zones with the precision of a well-timed punchline. The most popular Fibonacci levels—23.6%, 38.2%, 50%, 61.8%, and 78.6%—represent how much of a prior move the price might retrace before continuing its merry dance in the original direction. 🎭
Applying Fibonacci Retracement to Bitcoin Charts: A Dance of Numbers
To wield the power of Fibonacci retracement in bitcoin trading, a trader must first identify a significant peak and trough on a chart. Drawing the Fibonacci levels from high to low (or vice versa in an uptrend) overlays horizontal lines across the chart, like a tightrope walker balancing precariously above the abyss. These lines are where the price may find temporary support or resistance, offering possible entry or exit opportunities—if one dares to take the leap!
For instance, if bitcoin ascends from $80,000 to $100,000 and then begins to pull back, traders may gaze upon the 61.8% retracement level, a support zone around $87,640, with the reverence of a pilgrim at a holy site. If the price bounces off that level, it can confirm a continuation of the bullish trend. Conversely, should it break through that level, deeper retracements like the 78.6% or a full retracement may beckon like sirens luring sailors to their doom.
The Golden Ratio: 61.8%—The Holy Grail of Trading
Among the Fibonacci levels, the 61.8% level—affectionately dubbed the “golden ratio“—holds a special place in the hearts of traders. This ratio, appearing in everything from nature to architecture to the human form, is often credited with the self-fulfilling prophecies of traders who expect price action to react near this level. It’s like a cosmic joke that only the savvy can appreciate!
In the bitcoin bazaar, prices often pay homage to the 61.8% level, thanks to the multitude of market participants keeping a watchful eye. When this level aligns with other indicators like trendlines or moving averages, it gains even more weight as a confluence zone. Traders frequently place stop-losses or set profit targets near this level, managing risk with the precision of a tightrope walker juggling flaming torches.
Fibonacci and Friends: A Technical Indicator Party
Fibonacci retracement rarely attends the party alone. Traders often invite other tools like volume, candlestick patterns, relative strength index (RSI), or moving average convergence divergence (MACD) to strengthen the probability of a successful trade. For example, if bitcoin retraces to the 38.2% level and shows a bullish engulfing candlestick while RSI enters oversold territory, the trader may view this as a high-probability buying opportunity. 🎉
Similarly, if the 50% retracement level aligns with the 200-period moving average, this convergence might reinforce the area as strong support. The more indicators that validate a Fibonacci level, the greater the trader’s confidence in its significance—like a well-rehearsed comedy routine that never fails to get a laugh.
Retracement vs. Reversal: The Fine Line
It’s crucial to distinguish between a retracement and a reversal. A retracement is a temporary pullback within a larger trend, while a reversal indicates a change in the overall direction. Misreading the two can lead to premature exits or mistimed entries, much like a comedian flubbing their punchline.
Fibonacci levels help traders assess whether a pullback is merely corrective or the beginning of a broader trend change. If bitcoin pulls back to the 38.2% or 50% level and resumes its prior direction with increasing volume, it’s likely a retracement. However, failure to hold key levels accompanied by weakening momentum may signal a trend reversal, leaving traders scratching their heads in confusion.
Fibonacci Extension: Gazing into the Future
Beyond retracement, Fibonacci extensions are used to project potential price targets in trending markets. Extensions are plotted using the same high and low points but extend beyond the original move to forecast resistance or support in the direction of the trend. It’s like peering into a crystal ball, but with a bit more math and a lot less mysticism.
For example, if bitcoin rises from $90,000 to $100,000, retraces to $95,000, and resumes its uptrend, the 161.8% extension may be projected around $106,180 as a potential target. These extensions help traders define exit points and manage trades as trends evolve, like a seasoned performer knowing when to take their final bow.
Limitations and Subjectivity: The Human Element
Like all technical tools, Fibonacci retracement is not infallible. Its effectiveness relies on the trader’s ability to correctly identify the key swing high and low points. Because charting is subjective, two traders may select different points, leading to slightly varied retracement levels—like two artists interpreting the same masterpiece in wildly different ways.
Additionally, Fibonacci retracement works best in trending markets. In sideways or choppy markets, retracement levels may be less predictive and more prone to noise. Therefore, context and confirmation from other tools remain essential for informed decision-making, much like a good script needs a solid director.
Practical Use in Bitcoin’s Volatile Market: The Tightrope Walk
Bitcoin’s price movements are often dramatic, making precise entry and exit points essential for capital preservation and profit maximization. Fibonacci retracement allows traders to approach volatile conditions with a disciplined, structured framework, like a tightrope walker preparing for their act.
Whether swing trading on a four-hour chart or analyzing broader trends on a daily or weekly chart, Fibonacci levels can provide structure to chaotic movements. This makes the tool especially appealing in crypto markets, where large retracements and sharp rallies are as common as a cat video on the internet.
Mastering the Fibonacci Mindset: The Art of Probability
Ultimately, Fibonacci retracement isn’t about predicting the future with absolute certainty. It’s about mapping probabilities and aligning one’s strategy with key psychological levels observed across the market. Used thoughtfully, it becomes a guide that helps traders navigate uncertainty with logic rather than emotion, much like a wise old sage guiding a lost traveler.
In bitcoin trading, where volatility is high and emotions often run hotter than a summer day in Moscow, Fibonacci retracement offers a balanced, mathematically grounded perspective. Its continued popularity among traders across asset classes speaks to its enduring relevance in the world of technical analysis, proving that even in the wildest of markets, a little math can go a long way. 🧮✨
Read More
- Mobile MOBA Games Ranked 2025 – Options After the MLBB Ban
- Apothecary Diaries Ch.81: Maomao vs Shenmei!
- Gold Rate Forecast
- Summer Game Fest 2025 schedule and streams: all event start times
- ‘This One’s About You’: Sabrina Carpenter Seemingly Disses Ex-Boyfriend Barry Keoghan in New Song Manchild
- Tom Cruise Bags Gold: Mission Impossible Star Lands Guinness World Record for Highest Burning Parachute Jumps
- Who was Peter Kwong? Learn as Big Trouble in Little China and The Golden Child Actor Dies at 73
- Every Fish And Where To Find Them In Tainted Grail: The Fall Of Avalon
- Resident Evil 9: Requiem Announced: Release Date, Trailer, and New Heroine Revealed
- Batman and Deadpool Unite: Epic DC/Marvel Crossover One-Shots Coming Soon!
2025-05-20 08:01