Author: Denis Avetisyan
New research reveals that analyzing real-time emotional signals from social media can forecast short-term price movements in high-frequency trading.
Machine learning models leveraging Twitter sentiment analysis effectively identify and exploit intraday overreaction patterns in AAPL stock.
Despite the established principles of efficient markets, intraday price movements often exhibit predictable patterns linked to investor sentiment. This research, detailed in ‘Overreaction as an indicator for momentum in algorithmic trading: A Case of AAPL stocks’, investigates whether machine learning can exploit short-term overreactions in Apple Inc. stock by integrating high-frequency emotional data extracted from Twitter with volatility-normalized returns. The findings demonstrate that models leveraging these sentiment signals significantly outperform benchmark trading rules at ultra-short horizons, revealing a quantifiable link between collective emotion and price dynamics. Could these insights unlock a more nuanced understanding of behavioral finance and the potential for sentiment-driven algorithmic trading strategies?
Decoding Market Sentiment: A Window into Collective Perception
Conventional financial modeling historically prioritizes quantitative metrics – earnings reports, trading volume, and economic indicators – often neglecting the subtle, yet powerful, impact of collective investor feeling. This oversight stems from the difficulty in reliably measuring and integrating such subjective data; however, short-term market volatility is increasingly driven not by fundamental value, but by rapidly shifting perceptions and anxieties. Research demonstrates that public sentiment, as expressed through online discourse, can act as a leading indicator of intraday price swings, particularly for assets with high media coverage or speculative interest. Ignoring this emotional component risks incomplete analysis and potentially inaccurate predictions, as market psychology frequently overrides rational economic principles in the immediate term.
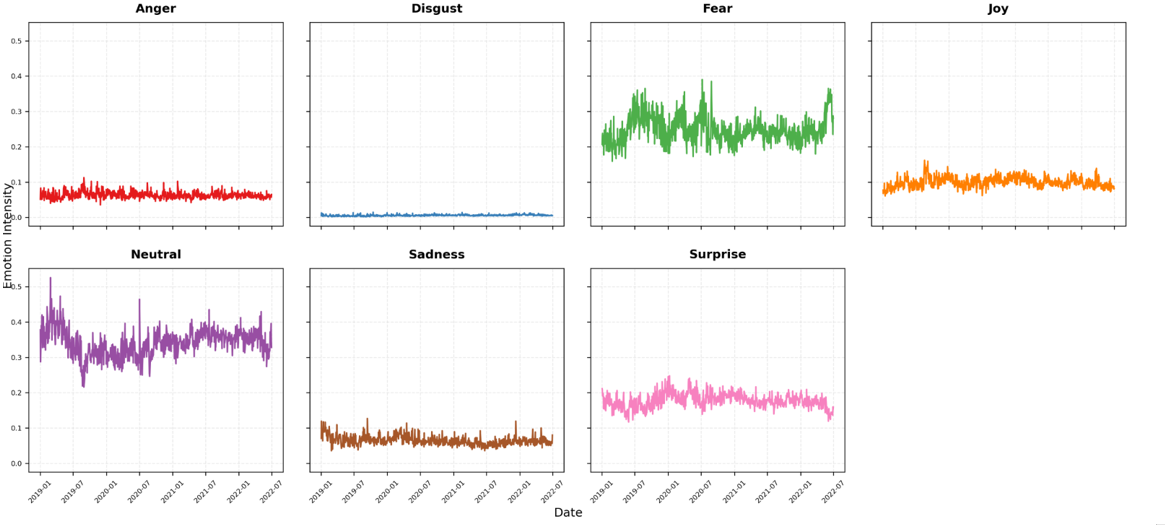
The increasing volume of publicly available text data, particularly from social media platforms like Twitter, presents an unprecedented opportunity to gauge market sentiment and potentially forecast short-term price movements. Researchers are discovering that the collective emotional tone expressed in online conversations – whether optimistic, pessimistic, or neutral – correlates with intraday fluctuations in financial markets. This approach diverges from traditional financial analysis, which primarily relies on quantitative data and often overlooks the impact of rapidly shifting public perception. By employing natural language processing and machine learning techniques, analysts can now extract emotional signals from millions of tweets, effectively transforming social media chatter into a predictive indicator of market behavior. This novel data source offers the potential to refine trading strategies and gain a competitive edge in fast-moving financial landscapes, though challenges remain in filtering noise and accurately interpreting nuanced language.
The challenge of gleaning predictive insights from social media lies not simply in data volume, but in its fundamentally unstructured nature. Traditional financial data is typically numerical and neatly organized; social media consists of free-form text, rife with slang, sarcasm, and nuanced emotional expression. Consequently, robust analytical methods are essential – techniques like Natural Language Processing (NLP) and machine learning algorithms are employed to transform raw text into quantifiable sentiment scores. These algorithms must account for linguistic complexity, including negation, irony, and context, to accurately assess whether a given post expresses positive, negative, or neutral feelings towards a particular asset. Furthermore, the sheer scale of social media data demands computationally efficient methods capable of processing millions of posts in near real-time, enabling timely identification of shifts in market sentiment and potentially informing more agile trading strategies.
Predictive Modeling: Extracting Signal from Sentiment
Machine learning models leverage statistical techniques to discern relationships between quantifiable sentiment data and directional price changes in financial markets. These models are trained on historical datasets comprised of features derived from text-based sources – such as news articles, social media posts, and financial reports – and corresponding price data. The training process involves identifying correlations where specific sentiment indicators – positive, negative, or neutral – consistently precede predictable price movements. Successfully trained models can then be used to forecast future price changes based on current sentiment, although predictive accuracy is contingent on data quality, feature engineering, and the model’s ability to generalize beyond the training dataset. The identified patterns are not necessarily causal, but rather statistical associations that can be exploited for predictive purposes.
Effective predictive modeling necessitates the inclusion of features beyond simple sentiment polarity. While sentiment intensity-the magnitude of positive or negative expression-provides a baseline, model accuracy is significantly improved by incorporating volatility metrics, such as historical price fluctuations and implied volatility from options markets. Furthermore, high-frequency trading data, including order book dynamics, trade volume, and bid-ask spreads, offers granular insights into immediate market pressure and liquidity. These data points capture short-term market reactions and provide leading indicators not present in lagged sentiment analysis, thereby enhancing the model’s capacity to forecast price movements.
Bidirectional Long Short-Term Memory (BiLSTM) and XGBoost models were evaluated for predictive accuracy against established overreaction benchmarks, specifically focusing on identifying price movements following sentiment analysis of financial news. Results indicated that both BiLSTM and XGBoost consistently outperformed these benchmarks across multiple datasets and timeframes. The BiLSTM model, a recurrent neural network, demonstrated an ability to capture sequential dependencies within the time series data, while XGBoost, a gradient boosting algorithm, excelled in feature importance and generalization. Performance was measured using metrics including precision, recall, and F1-score, with both models exhibiting statistically significant improvements over the baseline benchmarks.
Algorithm selection for predictive modeling necessitates consideration of data characteristics and performance trade-offs. Datasets with high dimensionality or non-linear relationships may benefit from more complex models like BiLSTM networks, despite increased computational cost and potential for overfitting. Conversely, simpler models such as XGBoost can provide comparable or superior performance on datasets with fewer features or more linear patterns, offering advantages in training speed and interpretability. The optimal choice involves evaluating algorithm performance using appropriate metrics on a validation dataset, balancing the need for predictive accuracy with computational efficiency and model complexity.
Interpreting Model Insights: Validation and Performance Metrics
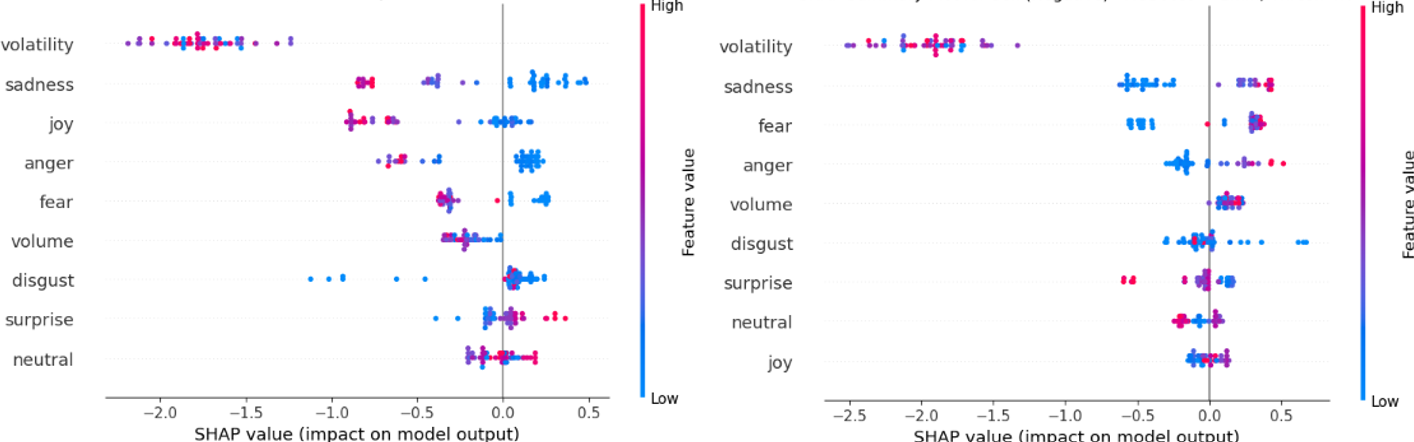
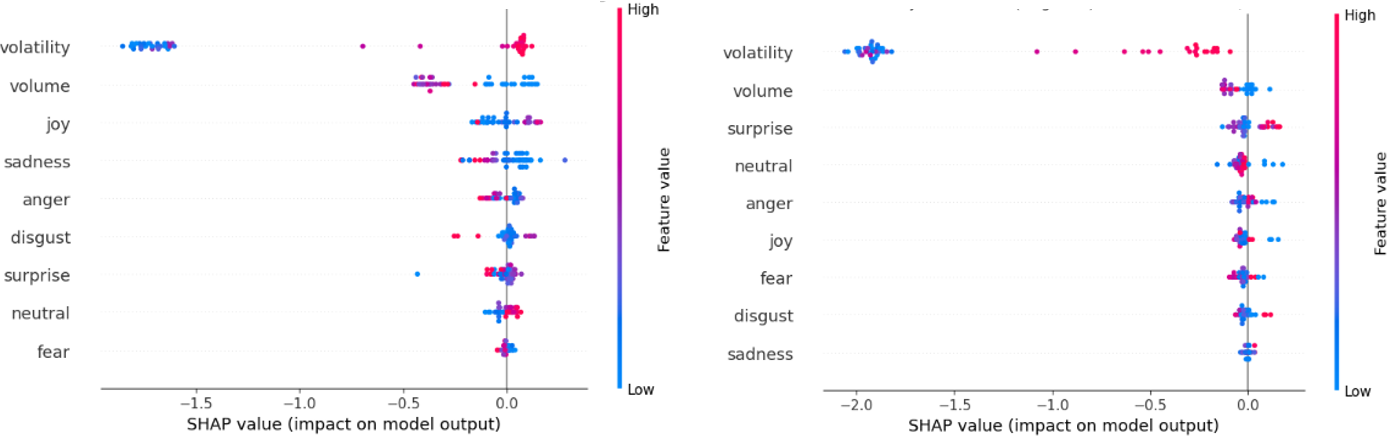
SHAP (SHapley Additive exPlanations) values are utilized to determine the impact of each input feature on a model’s prediction, based on concepts from cooperative game theory. Specifically, SHAP values quantify the contribution of each feature by calculating its average marginal contribution across all possible feature combinations. This allows for the decomposition of a prediction into the contributions of each feature, providing a localized explanation for individual predictions and a global understanding of feature importance. By assigning each feature a value representing its impact on the model’s output, SHAP values facilitate model interpretability and enable users to understand why a particular prediction was made, aiding in model debugging, trust building, and the identification of potential biases.
Statistical validation of the machine learning strategies employed the Jobson-Korkie test to assess predictive performance against established overreaction benchmarks. Results demonstrated statistically significant predictive power, with p-values consistently below the 0.05 threshold. This indicates that the observed performance is unlikely due to random chance, supporting the robustness of the models’ ability to identify exploitable market inefficiencies. The Jobson-Korkie test specifically addresses the challenges of evaluating trading strategy performance by accounting for multiple comparisons and autocorrelation in returns data, providing a more reliable assessment than traditional significance tests.
Accurate assessment of trading strategy profitability necessitates a comprehensive accounting of all transaction costs. These costs include brokerage fees, commissions, and potential market impact resulting from order execution – the difference between the expected price and the actual realized price due to the size of the trade. Failing to incorporate these costs can significantly overestimate net profits and lead to unrealistic performance expectations. Specifically, even strategies demonstrating positive returns based on raw price movements may become unprofitable when these costs are factored in, particularly for high-frequency strategies involving numerous trades. Therefore, backtesting and performance evaluation must explicitly model these costs to provide a realistic and reliable assessment of a strategy’s viability.
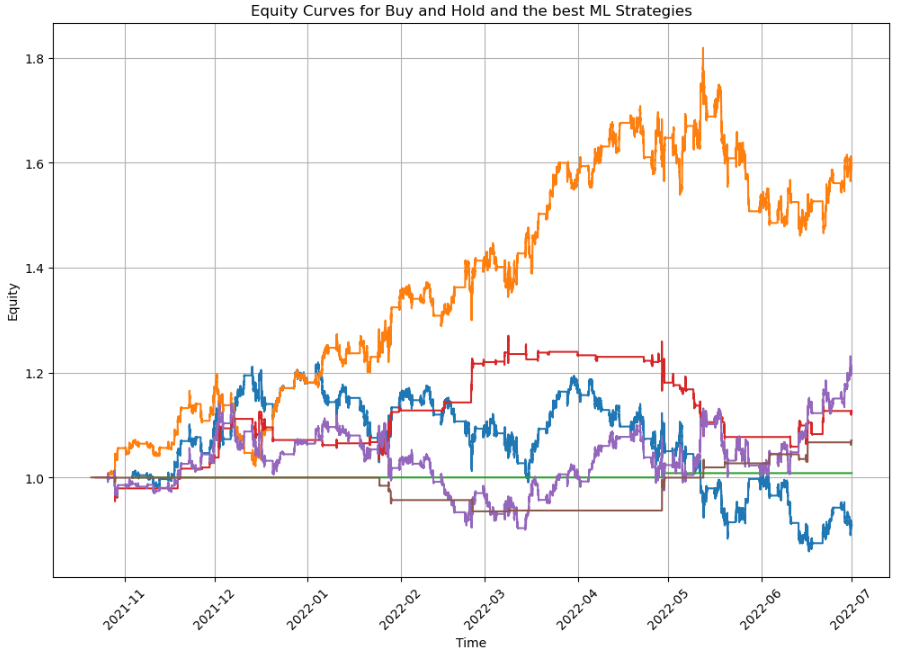
The developed models demonstrate predictive capability regarding short-term return momentum, with a peak Sharpe ratio of 1.43 observed at the 10-minute frequency. Performance at other frequencies ranged from 0.65 to 0.87, specifically at the 5- and 15-minute intervals. While predictive power for intraday overreaction was also observed, its magnitude was less pronounced than that of return momentum. These Sharpe ratio values represent the risk-adjusted return of the trading strategies implemented based on model predictions and provide a quantifiable measure of performance.
The study’s focus on exploiting intraday overreaction patterns reveals a compelling parallel to ancient wisdom. As Confucius stated, “Study the past if you would define the future.” This research doesn’t simply predict market movements; it dissects the emotional responses within those movements, treating them as data points revealing recurring patterns. Model errors, rather than being seen as failures, become crucial indicators of these patterns, informing adjustments and refining the predictive capacity of the machine learning algorithms. The ability to learn from these ‘errors’ and iterate is central to both successful trading strategies and the timeless pursuit of knowledge.
Where Do We Go From Here?
The apparent correlation between fleeting emotional expressions – as gleaned from the digital echo chamber – and immediate price fluctuations presents a fascinating, if slightly unsettling, picture. Each identified overreaction is not merely a profitable signal, but a symptom. The core question isn’t simply if these signals can be exploited, but why such fragile indicators hold predictive power. The observed patterns suggest market participants are susceptible to surprisingly primal cues, and the models merely reveal existing structural dependencies, not create them.
Future work must move beyond signal identification. A deeper investigation into the mechanisms driving these reactions is crucial. Are these responses truly ‘irrational’, or do they represent efficient, if rapid, processing of information, masked by the short timescales? Furthermore, the limitations of current sentiment analysis techniques are considerable. Nuance, sarcasm, and context remain stubbornly resistant to algorithmic interpretation. Improved natural language processing, combined with more sophisticated behavioral models, is essential.
Ultimately, the true challenge lies in acknowledging that the market isn’t a system to be predicted, but a complex adaptive system to be understood. Each successful trade is a temporary accommodation within a constantly shifting landscape. The pursuit of ever-more-accurate models should not overshadow the more fundamental task of mapping the underlying dependencies that govern collective behavior.
Original article: https://arxiv.org/pdf/2602.18912.pdf
Contact the author: https://www.linkedin.com/in/avetisyan/
See also:
- Invincible Season 4 Gender Swaps Tech Jacket As Fans Question Major Comic Change
- Gold Rate Forecast
- Silver Rate Forecast
- 20 Movies Where the Black Villain Was Secretly the Most Popular Character
- 22 Films Where the White Protagonist Is Canonically the Sidekick to a Black Lead
- Building Agents That Learn and Improve Themselves
- 15 Films That Were Shot Entirely on Phones
- Games That Faced Bans in Countries Over Political Themes
- Celebs Who Narrowly Escaped The 9/11 Attacks
- Trading Crypto with AI: A New Approach to Portfolio Management
2026-02-24 09:59