Right then. Let’s talk about numbers. Not just any numbers, mind you, but those slippery, shifting things that claim to represent the worth of… well, everything. Analysts, you see, spend a great deal of time peering at these numbers, muttering about ‘value’ and ‘overvaluation’ as if a market had a personal preference for being overpriced. It’s like trying to determine the moral character of a particularly stubborn goat. They’ll look at Price-to-Sales (P/S) or Price-to-Earnings (P/E), ratios that are perfectly sensible until you realise they only account for one year. One year! That’s barely enough time for a particularly slow-moving bureaucracy to misplace a vital document, let alone assess the long-term health of an entire economy.
There’s a tool, often overlooked, called the Cyclically Adjusted Price-to-Earnings ratio, or CAPE. It’s a bit like consulting an ancient oracle instead of relying on a hastily scribbled note. It looks back a decade, smoothing out the bumps and the blips. It’s not perfect, of course. No oracle ever is. They tend to speak in riddles and demand sacrifices, but at least they offer a broader perspective than simply asking a stockbroker what he had for breakfast.
What is the CAPE ratio, and why should you care?
The CAPE, as previously mentioned, isn’t bothered by the fleeting whims of a single year. It’s not easily swayed by a sudden surge in demand for, say, self-folding laundry or glow-in-the-dark garden gnomes. It’s a normalized view, a long, thoughtful sigh from the market itself. Currently, that sigh is rather… strained. The CAPE is at 39, which is more than double its long-term average. It’s getting uncomfortably close to the top of the scale, like a pressure gauge on a particularly ambitious steam engine.
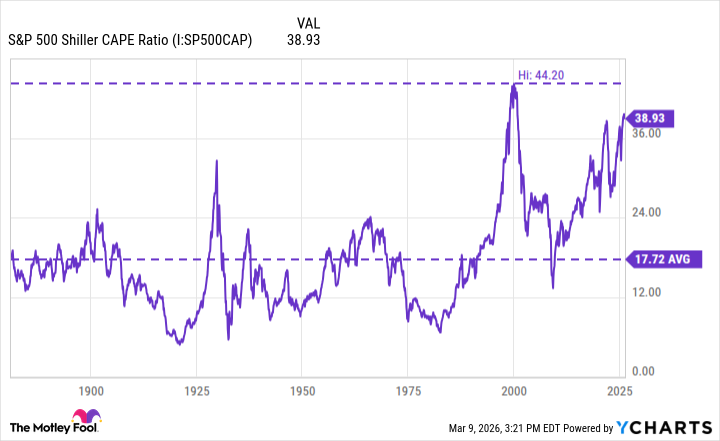
History offers a few cautionary tales. There was the late 1920s, a period of excessive optimism and questionable financial instruments. And then there was 2000, the dot-com bubble, when people genuinely believed that a website selling pet rocks could justify a multi-billion dollar valuation.1 In both cases, the market eventually… adjusted. It’s a polite way of saying it crashed. The CAPE ratio, it turns out, can be a surprisingly effective early warning system, though it’s not foolproof. It’s more of a very grumpy weather forecaster.
A Rising CAPE: What Does It All Mean?
Right now, the market is being propped up by the relentless march of Artificial Intelligence. The hyperscalers – Microsoft, Amazon, Alphabet, Meta – are throwing vast sums of money at chips from Nvidia, Broadcom, and Advanced Micro Devices. It’s a digital gold rush, and everyone is scrambling for a piece of the silicon. This investment fuels valuations, pushing the CAPE ratio ever higher. It’s a bit like inflating a balloon. It looks impressive for a while, but eventually, something has to give.
The peak in 2000 saw the CAPE reach 44, before the S&P 500 took a rather undignified tumble. A 40% drop, if you please. A rising CAPE suggests that stock prices are becoming detached from reality, like a particularly fanciful dream. It’s a sign of overvaluation, a warning that the market may be about to encounter a rather large and unpleasant pothole.
Is a Crash Imminent?
The S&P 500 is only 4% away from its all-time high. On the surface, that sounds… precarious. But things are not always what they seem. Many of the largest tech companies are trading at reasonable P/E levels, especially when compared to the early days of the AI revolution.2
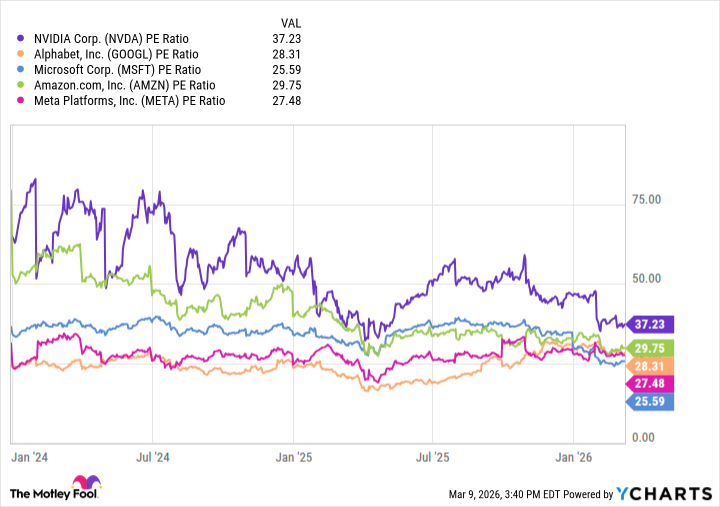
There’s a significant difference between the current AI boom and the dot-com bubble. Unlike those early internet companies, the hyperscalers are actually making money. They’ve monetized their AI investments, generating profits and cash flow. Some argue that this justifies a market premium. It’s a perfectly reasonable argument, provided you ignore the fact that markets are often driven by irrational exuberance and the fear of missing out.
Regardless, a smart investor should always have a plan. A rising CAPE doesn’t guarantee a crash, but it’s historically been a good indicator of sell-offs. Now might be a good time to trim your exposure to volatile growth stocks and unpredictable speculative positions. Instead, consider investing in blue-chip stocks with durable, diversified business models. And, of course, holding a bit of cash never hurts. It provides flexibility and allows you to buy the dip when (not if) the market eventually corrects.
The S&P 500 has proven to be a resilient, money-making machine over the long run. It’s weathered countless economic cycles, wars, and pandemics. Investing wisely, even during a downturn, should prove profitable over time. After all, even a grumpy weather forecaster is right eventually.
1
The Guild of Alchemists and Venture Capitalists at the time assured everyone that digital rocks were the future of pet ownership. They were, predictably, wrong.
2
Though defining ‘reasonable’ in the context of technology is a philosophical debate best left to the Unseen University of Coders.
Read More
- Invincible Season 4 Gender Swaps Tech Jacket As Fans Question Major Comic Change
- Building Agents That Learn and Improve Themselves
- Gold Rate Forecast
- Games That Faced Bans in Countries Over Political Themes
- Trading Crypto with AI: A New Approach to Portfolio Management
- Silver Rate Forecast
- 15 Films That Were Shot Entirely on Phones
- Unveiling the Schwab U.S. Dividend Equity ETF: A Portent of Financial Growth
- Why Won’t It Just *Do* What You Ask? Unpacking the Quirks of AI Language
- Thinking Before Acting: A Self-Reflective AI for Safer Autonomous Driving
2026-03-17 01:26