
Behold the JPMorgan Equity Premium Income ETF (JEPI) and its slightly younger sibling, the JPMorgan Nasdaq Equity Premium Income ETF (JEPQ). These two financial juggernauts have managed to captivate even the most jaded of investors with their trailing 12-month dividend yields of 8.2% and 11.2%, respectively. And what could be more alluring than monthly payouts? For those passive income connoisseurs who dream of reclining in their velvet armchairs while the dividends roll in like clockwork, these funds are akin to a well-oiled machine.
But let us pause for a moment and examine this grand contraption more closely. Could it be that these ETFs offer a low-volatility strategy-a sort of financial perpetual motion device-that practically guarantees an uninterrupted flow of cash? (Of course, we must remember that dividends, like promises, can always be broken.) Let us delve deeper into the labyrinthine workings of this scheme.
A Tale of Two Funds
To begin our journey, one must first grasp the peculiar nature of these exchange-traded funds. They do not dabble in the art of dividend stocks-at least, not directly. Instead, they follow a cunning plan: up to 80% of their assets are invested in equities, with JEPI focusing on the venerable S&P 500 and JEPQ setting its sights on the Nasdaq-100.
And here lies the rub-or rather, the brilliance of the design. The stocks within these portfolios are not selected for their high yields, as one might expect from such ostentatious funds. No, dear reader, they are chosen with a subtler purpose in mind. High-yield equity-focused ETFs often find themselves mired in sectors heavy with dividends, but our protagonists dance to a different tune.
The remaining 20% of their assets are devoted to equity-linked notes (ELNs), which employ a strategy so audacious it borders on the theatrical: selling call options on the very indices they track. A call option is the right to purchase shares at a predetermined price-the strike price-and is typically bought by those optimistic souls who believe the market will rise. Meanwhile, the seller-our intrepid ETF-collects a premium, much like a highwayman collecting tolls.
Should the index soar dramatically, the option is exercised, and the ELN may suffer a loss. However, if the index merely tiptoes upward, remains stagnant, or takes a tumble, the option expires unexercised. The result? A delicate ballet where premiums collected from ELNs and modest dividends combine to pay out distributions to shareholders under almost any condition-even when the index surges.
Thus, the upside is capped (less than the market), but so too is the downside-a fiscal yoke that both restrains and protects.
To better understand how these ETFs perform across various scenarios, consider the following table:
| Monthly Index Performance | Strong Gain | Moderate Gain | Moderate Loss | Strong Loss |
|---|---|---|---|---|
| Equities (At least 80% of the ETF assets) | Strong Gain | Gain | Loss | Strong Loss |
| ELNs (Up to 20% of the ETF’s assets) | Loss | Profit | Profit | Profit |
| Overall | Gain, but less than the market | Gain, but less than the market | Slight profit/slight loss | Loss, but less than the market |
Proof of the Pudding
Before inundating you with charts, let us establish what constitutes success for such schemes. The proof of the pudding, as they say, is in the eating:
- The ETF must exhibit lower volatility than the index, measured by the standard deviation of monthly returns.
- Maximum monthly drawdowns should remain modest, for passive investors abhor sudden losses.
- The strategy must demonstrate a high coefficient of determination (R²), proving that the benchmark index largely dictates outcomes.
- Performance must align with the scenarios outlined in the table above.
With that preamble out of the way, feast your eyes upon the charts comparing the monthly index performance to the ETF’s results, complete with reinvested dividends.
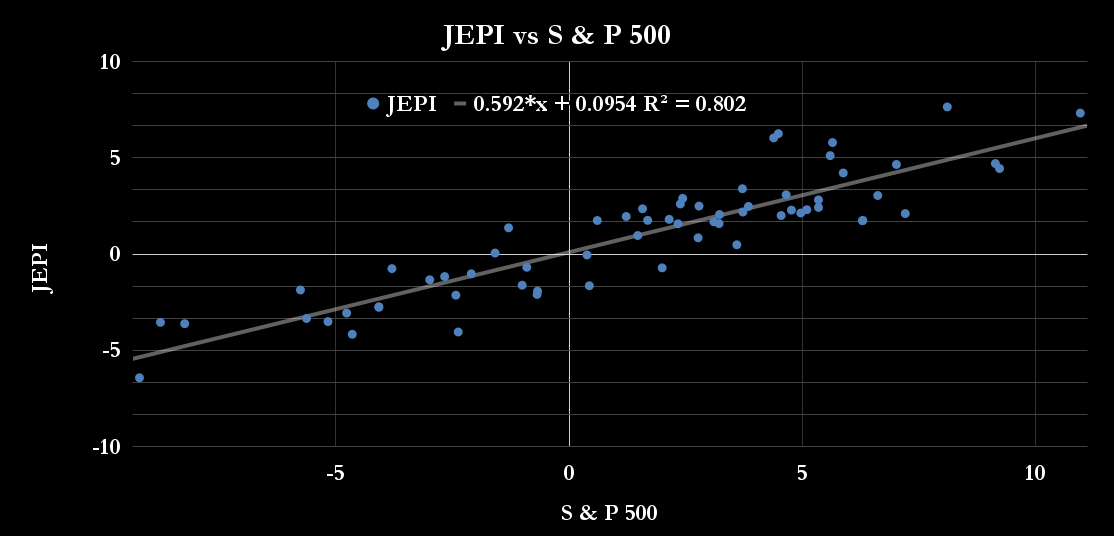
First, the JPMorgan Equity Premium Income ETF:
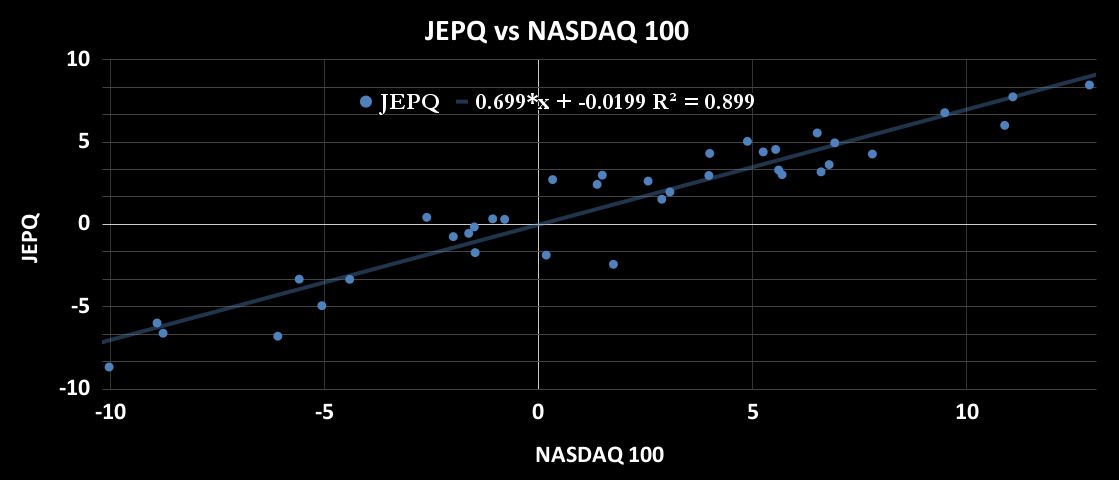
And now, the JPMorgan Nasdaq Equity Premium Income ETF:
From these visual delights, several conclusions emerge:
- The S&P 500 boasts a monthly standard deviation of 4.7%, whereas JEPI clocks in at a mere 3.1%, indicating subdued volatility.
- The Nasdaq-100, with a monthly standard deviation of 5.7%, sees JEPQ reduced to a still-modest 4.2%.
- Both ETFs display high R² values, suggesting the strategy adheres to its intended script.
- For JEPI, the three largest monthly drawdowns are -6.4%, -4.2%, and -4.1%. JEPQ fares similarly, with drawdowns of -8.7%, -6.8%, and -6.6%.
In essence, the strategy succeeds in crafting a tapestry of positive returns during moderate gains and losses. When markets plummet, the downside is cushioned; when they surge, the upside is clipped.
A Boon for Passive Investors
Both indices have performed admirably over the periods studied, with average monthly gains of 1.5% for the S&P 500 and 1.8% for the Nasdaq. It comes as no surprise, then, that the ETFs lag behind in such favorable conditions. But life is unpredictable, and these funds have proven their mettle by offering lower volatility while maintaining substantial dividends.
For those seeking passive income across the capricious tides of the market, these ETFs stand as stalwart companions. They whisper promises of stability in an otherwise chaotic world-a world where fortunes rise and fall faster than the curtain on opening night.
And so, dear investor, whether you view these funds as saviors or charlatans, one truth remains: they are here to stay, weaving their intricate web of dividends and options, forever dancing between risk and reward. 🎭
Read More
- Gold Rate Forecast
- How to Do Sculptor Without a Future in KCD2 – Get 3 Sculptor’s Things
- 15 Films That Were Shot Entirely on Phones
- Silver Rate Forecast
- 22 Films Where the White Protagonist Is Canonically the Sidekick to a Black Lead
- Black Actors Fans Say Hollywood Only Casts as Criminals
- 20 Movies Where the Black Villain Was Secretly the Most Popular Character
- Why Won’t It Just *Do* What You Ask? Unpacking the Quirks of AI Language
- Here are the Best Series to Binge on Paramount+ in January 2026
- 14 Movies Where the Black Character Refuses to Save the White Protagonist
2025-08-16 03:19