Author: Denis Avetisyan
A new approach isolates stable frequency components in time series data to improve forecasting accuracy and resilience to changing conditions.
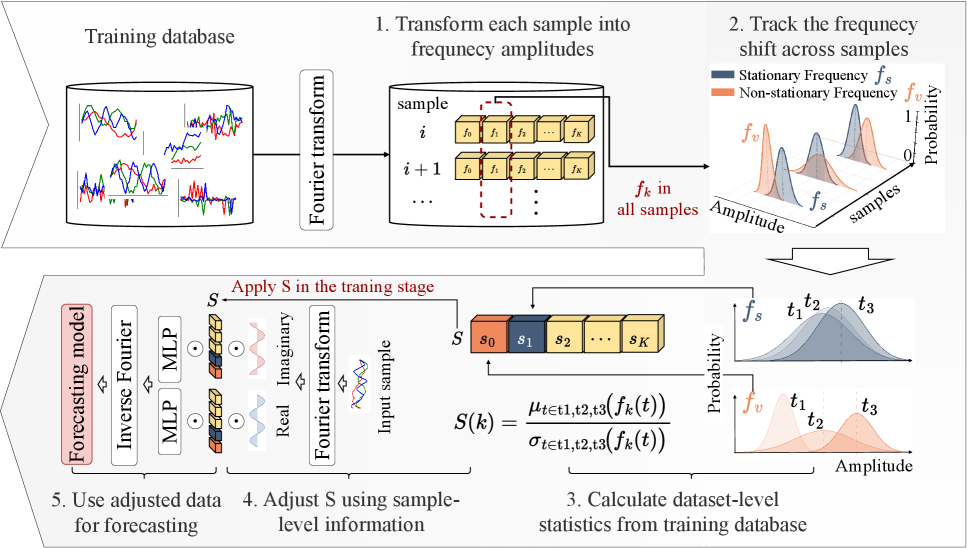
This paper introduces TIFO, a time-invariant frequency operator, to enhance representation learning in non-stationary time series by focusing on spectral features.
Nonstationary time series forecasting is challenged by distribution shift arising from differing data characteristics between training and testing phases. This paper introduces ‘TIFO: Time-Invariant Frequency Operator for Stationarity-Aware Representation Learning in Time Series’-a novel approach that addresses this issue by learning stationarity-aware weights in the frequency domain. Specifically, TIFO highlights persistent frequency components while suppressing those exhibiting non-stationarity, thereby mitigating distribution shift and improving forecast accuracy. Can this frequency-domain weighting strategy unlock more robust and efficient time series models across diverse forecasting tasks?
The Inherent Instability of Temporal Data
The ability to accurately predict future values in a time series is foundational to decision-making across a remarkably broad spectrum of disciplines. In financial markets, forecasting informs investment strategies, risk management, and algorithmic trading, where even slight improvements in predictive power can translate to substantial economic gains. Beyond economics, precise time series analysis underpins critical weather and climate modeling, enabling more accurate forecasts of extreme events and long-term trends. Furthermore, these techniques are vital in fields like energy demand forecasting, optimizing resource allocation and grid stability, and even in healthcare, where predicting patient flows and disease outbreaks allows for proactive resource management and improved public health outcomes. The pervasiveness of time series data and the increasing demand for accurate predictions underscore the importance of robust forecasting methodologies.
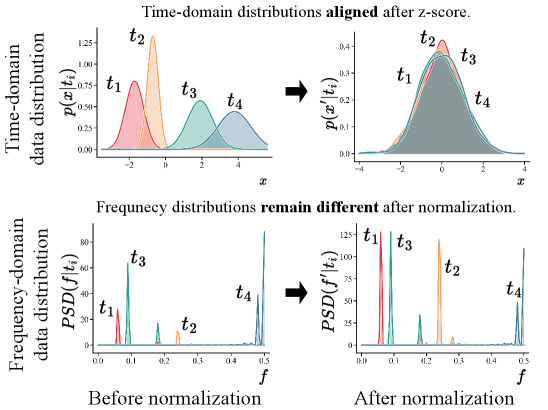
Time series data, unlike static datasets, are inherently dynamic, and this dynamism manifests as non-stationarity – a critical challenge in forecasting. This characteristic describes how the statistical properties of a time series, such as its mean, variance, and autocorrelation, aren’t constant over time. Imagine tracking daily temperatures; the average temperature will predictably shift with the seasons, altering the series’ fundamental characteristics. Similarly, financial data exhibits trends and volatility that change, rendering models trained on past data potentially ineffective for future predictions. Consequently, accurately characterizing and accounting for this evolving behavior is paramount; ignoring non-stationarity introduces significant errors, as models assume a consistency that simply doesn’t exist, limiting their ability to generalize and predict accurately over extended periods.
The inherent dynamism of real-world data often manifests as non-stationarity in time series, fundamentally altering the underlying data distribution over time. This distributional shift poses a significant challenge to predictive models, as algorithms trained on past data may struggle to generalize to future observations drawn from a different distribution, leading to substantial performance degradation. Consequently, mitigating this shift is paramount for accurate forecasting; recent studies demonstrate the critical impact of addressing non-stationarity, with an 88% reduction in distributional shift achieved on the Electricity dataset through innovative methodological approaches. This improvement highlights the potential for substantially enhanced predictive accuracy when models are explicitly designed to adapt to evolving data characteristics.
Deconstructing the Signal: The Power of Frequency Analysis
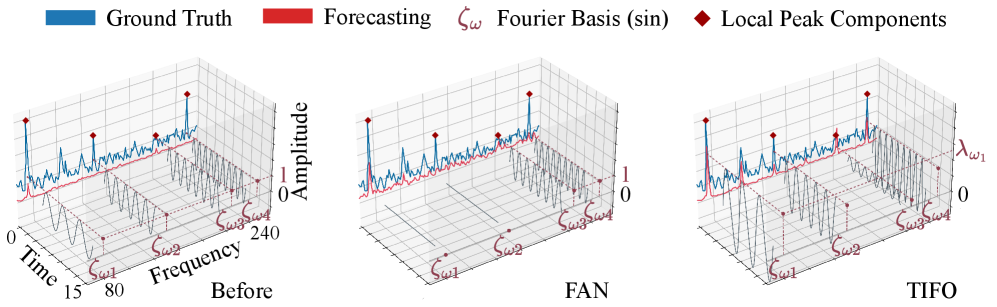
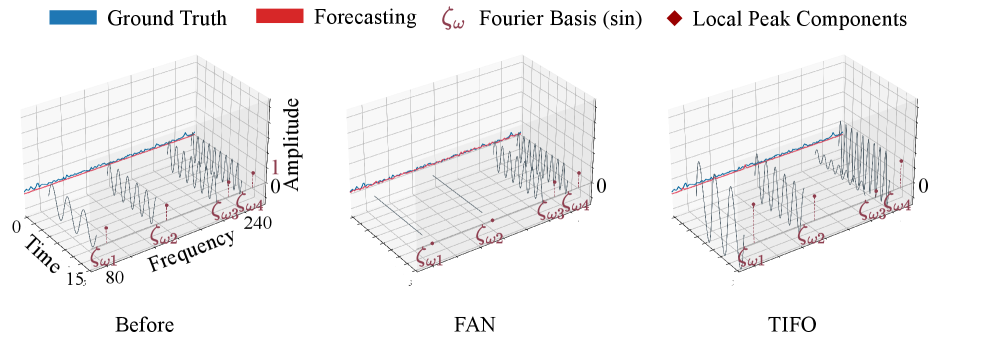
Frequency domain analysis transforms a time series from representation as a function of time to a function of frequency, enabling the identification of dominant periodic components. This is achieved through techniques like the Fourier Transform, which decomposes the signal into a sum of sine and cosine waves of varying frequencies and amplitudes. By examining the magnitude of these frequency components – often visualized in a power spectrum – analysts can pinpoint recurring patterns that may not be readily apparent in the time domain. The identified frequencies and their corresponding amplitudes quantify the strength and prevalence of these periodicities within the data, offering insights into the underlying processes generating the time series. This approach is particularly valuable for characterizing signals with complex or obscured periodic behavior, and for distinguishing periodic signals from noise.
Representing a time series using Fourier Basis Functions, specifically through the Discrete Fourier Transform (DFT), decomposes the signal into a sum of complex exponentials, each corresponding to a specific frequency component. The DFT transforms the time-domain signal x[n] into the frequency domain X[k], where k represents the frequency index. The magnitude of X[k] indicates the amplitude of the corresponding frequency in the original signal, and the phase indicates its phase shift. This process effectively separates the signal into its constituent frequencies, allowing for independent analysis and manipulation of each component. The resulting frequency spectrum provides a clear visualization of the signal’s power distribution across different frequencies, facilitating identification of dominant frequencies and harmonic content.
Non-stationarity in time series data, where statistical properties change over time, can be effectively addressed through frequency domain decomposition. Representing a signal as a sum of sinusoidal components – via techniques like the Fourier Transform – allows for the assessment of individual frequency components for stability. Lower frequency components often capture long-term trends and may exhibit more pronounced non-stationarity, while higher frequencies can represent short-term fluctuations that remain relatively stable. By analyzing the time-varying behavior of each frequency band, specific instances of non-stationarity can be isolated and mitigated through targeted filtering, smoothing, or adaptive algorithms applied to the affected frequency components. This granular approach allows for preservation of stable signal components while addressing the portions exhibiting temporal shifts in characteristics.
Adaptive Normalization: A Paradigm Shift in Sequential Modeling
Normalization techniques are critical components of model training, facilitating faster convergence and improved generalization performance. However, standard normalization methods, such as Batch Normalization and Layer Normalization, assume data stationarity – a consistent statistical distribution over time. This assumption is frequently violated in real-world time series data exhibiting trends, seasonality, or other non-stationary behaviors. Consequently, these traditional methods can introduce artifacts or fail to adequately normalize data in sequential models, leading to suboptimal results. The performance degradation is particularly pronounced when dealing with long-range dependencies, as the statistical properties of the time series can shift significantly over extended sequences, rendering fixed normalization parameters ineffective.
Adaptive normalization techniques, including RevIN, SAN, and FAN, address limitations of traditional normalization methods when applied to sequential data. These methods move beyond global or layer-wise normalization by introducing parameters that are dynamically adjusted during training based on the characteristics of the input sequence. RevIN utilizes invertible normalization, allowing for information to be preserved during the normalization process. SAN (Spectral Adaptive Normalization) adapts normalization based on the spectral characteristics of the input, while FAN (Frequency-domain Adaptive Normalization) operates directly on the frequency components, enabling targeted normalization of specific frequencies within the time series. This adaptability allows these methods to better handle non-stationary data and improve model performance compared to static normalization approaches.
Frequency-domain normalization, as implemented in FAN, offers granular control over data normalization by operating directly on the frequency components of a time series. This contrasts with traditional methods that normalize across the entire time series. Our Time-Frequency Instance Optimization (TIFO) method leverages this capability, resulting in a 33.3% reduction in Mean Squared Error (MSE) when paired with the PatchTST model on the ETTm2 dataset. Furthermore, TIFO demonstrates a 55.3% improvement in performance, as measured by MSE, when integrated with the iTransformer model, also using the ETTm2 dataset. These results indicate the efficacy of frequency-specific normalization for improving the accuracy of time series forecasting models.
The pursuit of robustness in time series forecasting, as demonstrated by this work on TIFO, echoes a fundamental principle of mathematical elegance. The paper’s focus on isolating stationary frequency components-suppressing the noise of non-stationarity-aligns with the desire for provable consistency. As David Hilbert famously stated, “In every well-defined mathematical domain, there is a method to solve any problem.” TIFO embodies this sentiment; by methodically dissecting time series data into frequency components and prioritizing those exhibiting stationarity, the approach aims for a solution grounded in mathematical certainty, rather than empirical observation alone. This rigorous treatment of non-stationarity contributes to a forecasting model with enhanced predictability and demonstrable accuracy.
What Lies Ahead?
The pursuit of stationarity in time series, as addressed by this work, feels less a triumph of engineering and more a necessary concession to the inherent chaos of observed phenomena. While TIFO demonstrably improves forecasting through selective amplification of invariant frequencies, the fundamental question of why certain spectral components remain stable under distributional shift deserves further scrutiny. Is this stability merely a statistical artifact, or does it reflect underlying physical or systemic constraints? The current formulation treats frequency components as atomic entities; exploring interactions and dependencies between frequencies – a spectral topology, if one will – could unlock more robust representations.
A critical limitation, inherent to most frequency-domain approaches, lies in the assumption of periodicity. Many real-world time series exhibit transient or aperiodic behavior. Future work should investigate methods for adaptively identifying and modeling these non-periodic elements, perhaps through wavelet transforms or other time-frequency representations that offer greater localized resolution. Moreover, the computational complexity of spectral analysis, even with efficient algorithms, remains a practical concern, particularly for extremely long time series. Asymptotic scalability, not mere empirical performance, must be the guiding principle.
Ultimately, the true test of TIFO, and indeed of any time series model, lies not in achieving incremental improvements on benchmark datasets, but in its ability to generalize to genuinely novel and unpredictable scenarios. The elegance of a solution is not measured by its complexity, but by its parsimony – its ability to distill essential information from noise. The path forward demands a relentless focus on mathematical rigor and a willingness to challenge the underlying assumptions that govern our understanding of time.
Original article: https://arxiv.org/pdf/2602.17122.pdf
Contact the author: https://www.linkedin.com/in/avetisyan/
See also:
- Invincible Season 4 Gender Swaps Tech Jacket As Fans Question Major Comic Change
- Building Agents That Learn and Improve Themselves
- Gold Rate Forecast
- Superman Flops Financially: $350M Budget, Still No Profit (Scoop Confirmed)
- Silver Rate Forecast
- Games That Faced Bans in Countries Over Political Themes
- Trading Crypto with AI: A New Approach to Portfolio Management
- Unveiling the Schwab U.S. Dividend Equity ETF: A Portent of Financial Growth
- 22 Films Where the White Protagonist Is Canonically the Sidekick to a Black Lead
- 15 Films That Were Shot Entirely on Phones
2026-02-23 01:54