Author: Denis Avetisyan
A robust subsampling method offers improved accuracy when estimating volatility from noisy, rapidly sampled financial data.
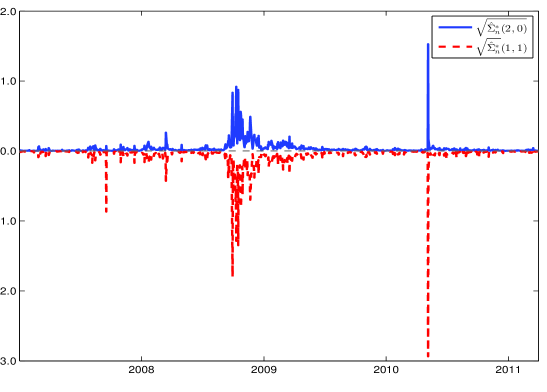
This review details a consistent estimator for the asymptotic covariance matrix of bipower variation, addressing challenges posed by microstructure noise and jumps in high-frequency time series.
Accurate inference in high-frequency financial data is challenged by the inherent complexities of estimating asymptotic covariances, particularly in the presence of microstructure noise. This paper, ‘Inference from high-frequency data: A subsampling approach’, introduces a novel estimator based on subsampling-a method that rescales local stretches of data to assess sampling variation-to consistently estimate the asymptotic covariance matrix of bipower variation. Demonstrating both theoretical consistency and robust performance in simulations, the proposed estimator requires minimal tuning and avoids restrictive assumptions about the noise process. Will this adaptive approach provide a more reliable framework for assessing the validity of volatility estimates and enabling more informed decision-making in financial markets?
Unveiling Market Dynamics: The Foundation of Volatility Modeling
The precise modeling of volatility is paramount within financial systems, serving as the cornerstone of both predictive modeling and effective risk mitigation strategies. Volatility, representing the degree of price fluctuation for a financial asset, directly impacts option pricing, portfolio optimization, and the assessment of potential losses. Inaccurate volatility estimations can lead to significant underpricing of risk, potentially resulting in substantial financial consequences for institutions and investors. Consequently, substantial research focuses on developing more robust and nuanced models that move beyond simplistic assumptions, striving to capture the complex, dynamic nature of market behavior and improve the reliability of financial forecasts. \sigma(t) , the standard deviation of asset returns, is thus a central parameter in quantitative finance, demanding continuous refinement of estimation techniques.
Financial models frequently utilize the log-price process, formalized within the Itô semimartingale framework, to describe asset price evolution. This approach, while mathematically elegant and providing a foundation for options pricing and portfolio optimization, operates under certain assumptions that can be problematic in real-world markets. Specifically, the Itô framework assumes continuous sample paths – that price changes occur gradually and smoothly. However, financial markets are often punctuated by sudden, discontinuous jumps caused by unexpected news, geopolitical events, or shifts in investor sentiment. These jumps violate the assumptions of the Itô model, potentially leading to inaccurate volatility estimations and flawed risk assessments. Consequently, researchers are actively exploring extensions and alternatives to the traditional Itô framework, including jump-diffusion models and stochastic volatility models, to better capture the complexities and nuances of actual market dynamics and improve the reliability of financial forecasting.
Financial models heavily rely on the accurate depiction of asset price movements, yet a persistent difficulty arises from differentiating between continuous, gradual price changes and sudden, discontinuous ‘jumps’. These jumps, often triggered by unexpected news or events, violate the assumptions of many standard models that presume price processes evolve smoothly. Failing to properly account for these abrupt shifts introduces estimation errors and can significantly underestimate true market risk. Consequently, researchers are actively developing techniques – including jump-diffusion models and stochastic volatility frameworks – to better capture these discontinuous dynamics and improve the reliability of financial forecasting and risk assessment. The presence of jumps impacts statistical inference, requiring specialized methods to avoid biased estimations of volatility and other key parameters, ultimately influencing the effectiveness of derivative pricing and portfolio optimization strategies.
From Theory to Practice: Estimating Variation in Financial Systems
The \text{Quadratic Variation} (QV) represents the limit of the sum of squared price changes over increasingly small time intervals, theoretically providing an estimate of the total variation in a process – and thus, a basis for volatility estimation. However, directly calculating QV from discrete financial data is impractical due to the infinite resolution required. In practice, approximating QV involves summing squared returns over finite, but high-frequency, intervals. This approximation is susceptible to biases arising from the discretization error, which depends on the interval size and the process’s characteristics. Furthermore, the theoretical convergence properties underpinning QV rely on assumptions of continuous sample paths, which are often violated in financial markets due to jumps and, critically, the pervasive presence of \text{Microstructure Noise}. Therefore, while QV provides the theoretical foundation, its practical application demands careful consideration of discretization effects and noise reduction techniques to obtain reliable volatility estimates.
Both Realized Variance (RV) and Power Variation (PV) are estimators used to approximate the true integrated variance. RV is calculated as the sum of squared returns observed at high frequencies, and performs optimally under the assumption of continuous sample paths. However, in the presence of jumps, RV produces a biased estimate. PV addresses this limitation by employing a weighted sum of high-frequency returns, utilizing a power weighting scheme. This weighting effectively downscales the contribution of large jumps, providing a more accurate estimate of the true integrated variance when jumps are present in the data. The optimal power used in PV depends on the assumed jump diffusion process, but generally improves estimation accuracy over RV in jump-diffusion models.
High-frequency financial data, while offering increased precision for volatility estimation, is inherently affected by Microstructure\ Noise. This noise arises from the discrete nature of order books, bid-ask spreads, rounding errors, and the time it takes to execute trades. Consequently, simple summation of squared returns over short time intervals will overestimate the true volatility. Microstructure\ Noise is not random, and its impact is greatest at the highest frequencies, leading to biased estimators if left unaddressed. Techniques such as the use of asynchronous sampling, the correction of the Bid-Ask Spread, and the implementation of kernel-based noise reduction methods are therefore critical for obtaining accurate volatility estimates from high-frequency data.
Refining Estimates: Noise Reduction and Advanced Techniques
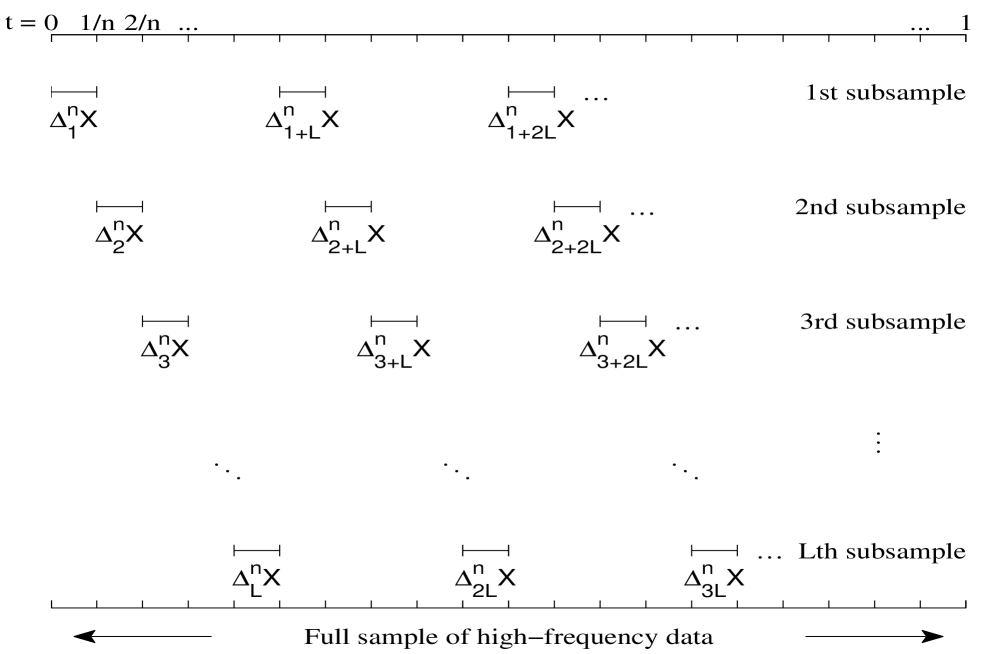
Pre-averaging is a technique used to mitigate the impact of Microstructure Noise on volatility estimation. This involves calculating the average price over short, non-overlapping intervals – typically of length L – before computing realized variance. By smoothing the high-frequency data, pre-averaging effectively reduces the contribution of noise to the overall variance estimate. This is achieved by reducing the number of observations used in the calculation, thereby diminishing the influence of random, short-term price fluctuations. The resulting smoothed series provides a more accurate representation of the underlying continuous path of the asset price, leading to improved robustness in volatility estimation, particularly when dealing with noisy data.
Bipower variation is a volatility estimation technique that utilizes pre-averaging to mitigate the impact of noise and, crucially, to improve accuracy when jumps are present in the data. Standard volatility estimators are known to be biased in the presence of jumps, leading to inaccurate results; bipower variation addresses this by calculating variation using a modified process that effectively discounts the influence of these discontinuous movements. This is achieved through a specific weighting scheme applied during the variation calculation, resulting in a consistent estimator even when jumps occur. The method relies on the pre-averaged data to provide a more stable signal for volatility estimation, offering a substantial improvement over traditional estimators, particularly in financial time series analysis where jumps are common.
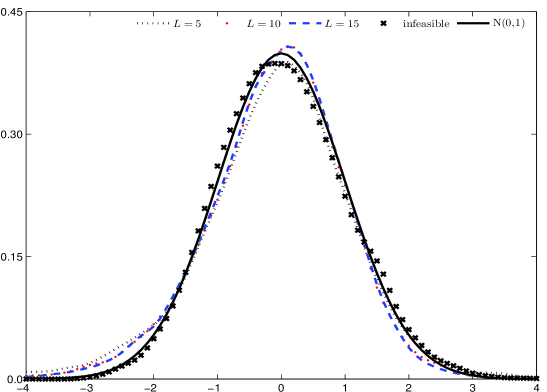
The newly developed subsampling estimator demonstrates a convergence rate of n^{-1/5}. This indicates that the estimator’s error decreases proportionally to the fifth root of the sample size n. Associated with this convergence rate are the parameters L = O(n^{1/5}) and p = O(n^{1/10}), which define the block length and the number of blocks used in the subsampling procedure, respectively. These parameters scale with the sample size in a manner consistent with achieving the stated convergence rate and ensuring the estimator’s efficiency.
Validating Precision: Assessing the Reliability of Estimates
Volatility estimation, crucial in financial modeling, relies on assessing the precision of these estimators – and the \text{Asymptotic Variance} serves as the foundational theoretical benchmark for this evaluation. This variance represents the smallest possible variance any consistent estimator can achieve under ideal conditions, essentially defining a limit to how accurately volatility can be measured. By comparing the performance of actual estimators to this theoretical ideal, researchers can gauge their efficiency and reliability. A lower asymptotic variance indicates a more precise estimator, capable of producing tighter confidence intervals and more accurate predictions. Therefore, understanding and calculating this theoretical limit is paramount for developing and validating robust volatility models, providing a crucial standard against which practical estimation techniques are measured.
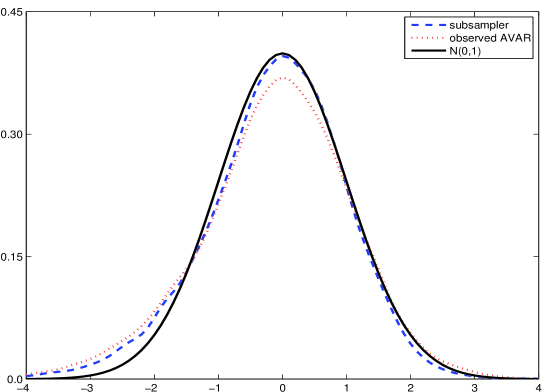
Determining the accuracy of volatility estimators requires more than just a point estimate; a quantifiable measure of uncertainty is essential. Researchers utilize methods like Observed Asymptotic Variance (AVAR) and, increasingly, subsampling techniques to achieve this. These approaches effectively estimate the asymptotic variance, which serves as a theoretical benchmark for precision. Subsampling, in particular, involves repeatedly estimating the volatility on different data subsets to build a distribution of estimates and, consequently, an empirical estimate of the estimator’s variance-covariance matrix. This allows for the construction of confidence intervals and hypothesis tests, providing a robust assessment of how reliable the estimated volatility truly is and offering a practical means of gauging the estimator’s performance in real-world applications.
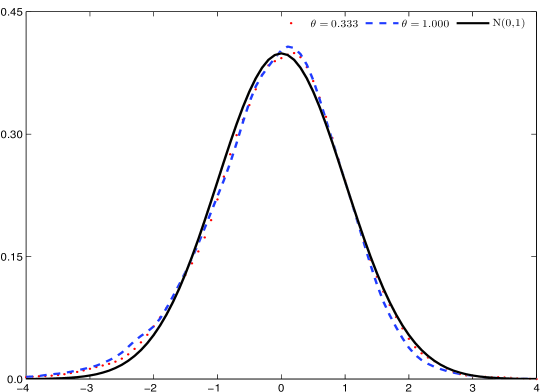
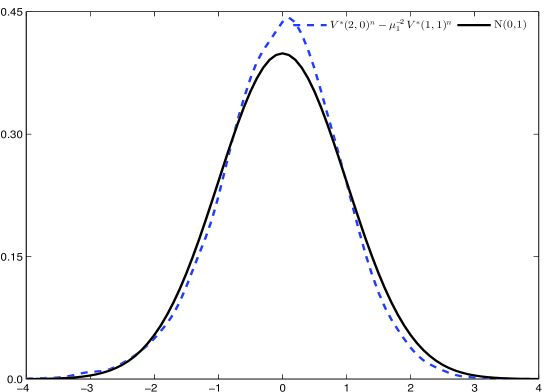
A novel subsampling estimator for assessing the reliability of volatility calculations has been rigorously established as statistically consistent, meaning it accurately converges on the true asymptotic covariance matrix as data increases. This characteristic addresses known deficiencies in existing estimation methods, which can sometimes produce unreliable or even mathematically invalid results. Crucially, the estimator is also guaranteed to be positive semi-definite, ensuring stable and meaningful calculations. Validation through extensive Monte Carlo simulations confirms its exceptional performance, with estimated distributions closely mirroring the expected standard normal curve – a strong indicator of accuracy and trustworthiness in practical applications. This consistent and stable performance offers researchers and practitioners a robust tool for evaluating the precision of volatility estimates.
Beyond Static Models: Adapting to Dynamic Market Realities
Financial markets rarely follow smooth, predictable paths; instead, they are punctuated by abrupt shifts triggered by unexpected news or events. These sudden price movements, known as jumps, deviate significantly from the assumptions of traditional financial models which presume continuous price changes. To more accurately represent this reality, researchers employ Jump Diffusion Process models. These models combine the continuous diffusion characteristic of Brownian motion with the possibility of discrete jumps, allowing for a more nuanced depiction of price dynamics. By acknowledging these jumps, these models provide a more realistic framework for understanding asset pricing, risk management, and derivative valuation, ultimately improving the accuracy of financial forecasting and decision-making.
Accurate volatility estimation in financial markets is complicated by the frequent occurrence of abrupt price changes, often termed ‘jumps’. Traditional methods can be significantly biased when these jumps are present, leading to mispricing of derivatives and flawed risk assessments. However, by combining techniques such as ‘Power Variation’ with a rigorous understanding of asymptotic properties – how estimators behave with large datasets – researchers are developing more robust approaches. Power Variation strategically weights data to minimize the impact of jumps on volatility calculations, while careful asymptotic analysis ensures the estimator’s reliability and consistency. This combined approach allows for a more precise quantification of volatility even amidst discontinuous price movements, ultimately improving the accuracy of financial models and risk management strategies.
Ongoing investigation centers on the creation of volatility estimation techniques capable of responding to the ever-shifting landscape of financial markets. Current models often assume a degree of stationarity that doesn’t reflect reality; therefore, researchers are exploring adaptive algorithms that can dynamically recalibrate their parameters based on incoming data. These advancements involve incorporating machine learning approaches and high-frequency data analysis to detect regime shifts and adjust estimation processes accordingly. Such techniques promise not only more accurate volatility forecasting, but also a deeper comprehension of the underlying mechanisms driving market fluctuations, potentially leading to improved risk management and more sophisticated trading strategies. The ultimate goal is to move beyond static models and embrace a dynamic framework that accurately captures the complex and evolving nature of financial volatility.
The study meticulously addresses the challenges inherent in extracting meaningful signals from high-frequency data, acknowledging that observed patterns are rarely direct representations of underlying phenomena. Instead, the research positions model errors not as setbacks, but as opportunities to refine understanding of the asymptotic covariance matrix. This approach echoes John Locke’s sentiment: “The mind is not a passive receiver of impressions, but rather actively works to organize and interpret sensory information.” Just as Locke described the active role of the mind, this paper actively constructs a robust estimator-the subsampling approach-to interpret the ‘sensory information’ of financial data, even amidst the noise and jumps that obscure a clear signal. The consistent performance demonstrated validates this active, interpretive process.
What Lies Ahead?
The presented work clarifies a pathway for inference when dealing with the ceaseless stream of high-frequency data. The subsampling estimator functions as a refined microscope, bringing into focus the true signal obscured by the ever-present distortions of microstructure noise. Yet, even with improved vision, the landscape remains complex. Consistency of the estimator, while demonstrated, doesn’t absolve the analyst of the need for careful consideration of model limitations. The bipower variation, a useful proxy for volatility, still relies on assumptions about the underlying price process – assumptions that, in real markets, are invariably bent and broken.
Future research will likely center on extending this approach to more complex volatility models, and to multivariate settings. The challenge isn’t merely to estimate parameters, but to understand how estimation error propagates through downstream calculations. A particularly intriguing direction lies in incorporating machine learning techniques-not as replacements for statistical rigor, but as adaptive filters to pre-process the data, reducing the burden on the estimator. The specimen, after all, is rarely presented in a pristine state.
Ultimately, the pursuit of accurate inference from high-frequency data isn’t about achieving a perfect representation of reality-an impossibility, given the inherent randomness of markets. Instead, it’s about building models that consistently reveal patterns, even when those patterns are faint, fleeting, and forever subject to revision. The true value lies not in the answer, but in the continued refinement of the question.
Original article: https://arxiv.org/pdf/2601.16668.pdf
Contact the author: https://www.linkedin.com/in/avetisyan/
See also:
- Top 20 Dinosaur Movies, Ranked
- 20 Movies Where the Black Villain Was Secretly the Most Popular Character
- Celebs Who Narrowly Escaped The 9/11 Attacks
- 25 “Woke” Films That Used Black Trauma to Humanize White Leads
- Spotting the Loops in Autonomous Systems
- The 10 Most Underrated Jim Carrey Movies, Ranked (From Least to Most Underrated)
- Gold Rate Forecast
- The Best Directors of 2025
- Transformers Under the Microscope: What Graph Neural Networks Reveal
- Every Notable ‘Star Trek: The Original Series’ Actor Who Died
2026-01-26 12:37