Author: Denis Avetisyan
Researchers have developed a new framework that uses artificial intelligence to go beyond simply describing charts and instead extract meaningful insights from data visualizations.
![The ChartSummInsight dataset establishes a distribution of chart types and domains, and a comparative analysis against existing chart summarization datasets-specifically [7, 2]-demonstrates its unique composition and scope for advancing research in automated chart understanding.](https://arxiv.org/html/2602.18731v1/x2.png)
This work introduces Chart Insight Agent Flow (CIAF), a multi-agent system leveraging multimodal large language models and a new dataset, ChartSummInsights, to enhance chart summarization and insight extraction.
While existing chart summarization techniques excel at describing data, they often fall short of extracting the deeper insights central to effective data visualization. This limitation motivates the work presented in ‘Beyond Description: A Multimodal Agent Framework for Insightful Chart Summarization’, which introduces Chart Insight Agent Flow (CIAF), a multi-agent framework designed to leverage the perceptual and reasoning capabilities of Multimodal Large Language Models for insightful summarization. Furthermore, to facilitate robust evaluation, the authors present ChartSummInsights, a new dataset comprising real-world charts paired with expert-authored, insightful summaries. Can this approach unlock a new level of automated data understanding and truly transform how we interact with visual information?
The Inevitable Limits of Visual Understanding
Although artificial intelligence has made remarkable strides, the automated interpretation of charts presents a persistent difficulty. This arises not simply from deciphering the visual elements themselves, but from the necessity of contextual understanding – recognizing the narrative the chart intends to convey. Charts are rarely self-explanatory; they rely on implicit knowledge about the data’s origin, the relationships between variables, and the intended audience. Consequently, algorithms must move beyond pattern recognition to incorporate reasoning about the purpose of the visualization and the real-world implications of the depicted trends. This requires a level of cognitive flexibility that remains a considerable hurdle for current AI systems, demanding breakthroughs in areas like common sense reasoning and natural language processing to bridge the gap between visual data and actionable intelligence.
Current automated chart analysis techniques frequently struggle to deliver insights that are both detailed and complete, ultimately limiting their value in real-world applications. While these systems can often identify basic trends or data points, they frequently miss subtle relationships, contextual anomalies, or the broader implications of the visualized information. This limitation stems from a difficulty in replicating human-level reasoning – the ability to synthesize information, consider external knowledge, and infer meaning beyond the immediately presented data. Consequently, decision-makers may receive summaries that are incomplete or misleading, forcing them to invest significant time in manual verification and interpretation, thereby negating the potential efficiency gains promised by automated analysis. The pursuit of genuinely intelligent chart understanding, therefore, requires advancements that move beyond simple data extraction towards a more holistic and contextualized reasoning capability.
Orchestrating Insight: The Chart Insight Agent Flow
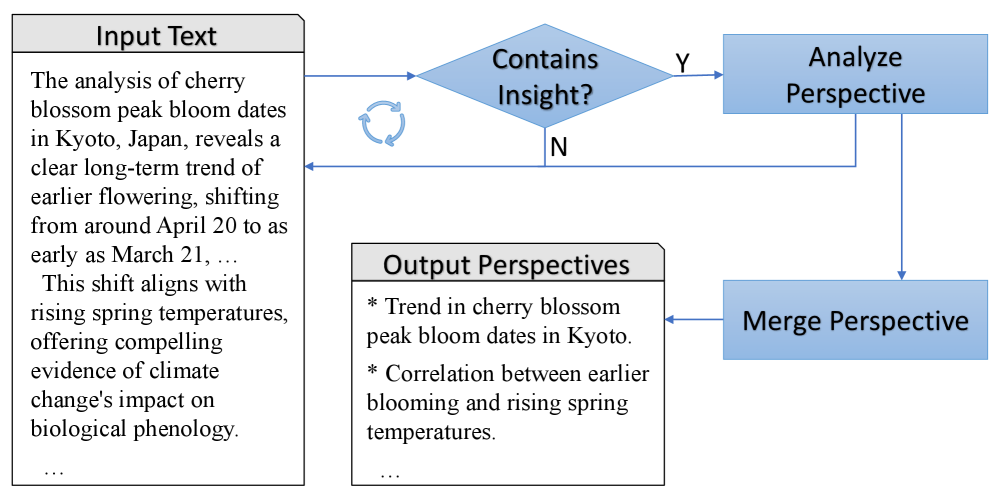
The Chart Insight Agent Flow (CIAF) is a computational framework designed to automatically generate summaries of information presented in charts. It employs a plan-and-execute methodology, first formulating a strategy for insight extraction before processing the chart data. This framework distinguishes itself by leveraging the capabilities of Multimodal Large Language Models (MLLMs), which are capable of processing both visual chart elements and associated textual data. By combining planning with MLLM-driven execution, CIAF aims to move beyond simple chart description towards the identification and articulation of meaningful insights contained within the visualized data.
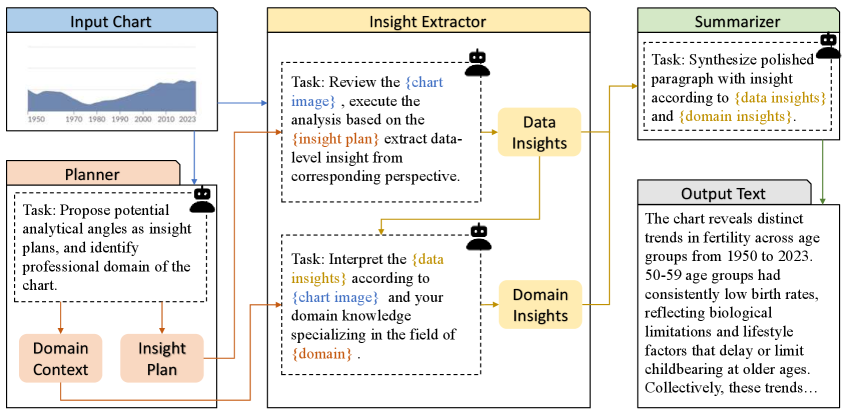
The Chart Insight Agent Flow (CIAF) utilizes a modular, multi-agent architecture comprised of three core components. The Planner Agent initiates the process by generating an ‘Insight Plan’ detailing the steps for chart analysis. Following the plan, the Insight Extraction Agent focuses on identifying and extracting relevant data points and patterns directly from the chart’s visual elements. Finally, the Summarizer Agent synthesizes the extracted information into a coherent and concise textual summary, providing a high-level understanding of the chart’s key insights. Each agent operates sequentially, passing its output to the next in the pipeline to achieve comprehensive chart understanding.
The Planner Agent employs In-Context Learning (ICL) to dynamically generate an ‘Insight Plan’ specific to each input chart. This plan functions as a structured guide for subsequent agents, detailing the key information to extract and the reasoning steps to follow. ICL is implemented by providing the agent with a limited number of example chart-insight pairs during the prompting process, enabling it to generalize this knowledge to new, unseen charts. The resulting Insight Plan outlines the desired insight type, relevant chart elements (e.g., axes, data series), and the specific analytical operations required to derive meaningful conclusions from the chart data. This approach avoids the need for task-specific training or fine-tuning, allowing the CIAF framework to adapt to diverse chart types and analytical objectives.
Deconstructing the Signal: A Dual-Agent Extraction Process
The Insight Extraction Agent utilizes a dual-agent system comprised of a Data Analyst and a Domain Analyst to maximize the value derived from chart data. The Data Analyst component is responsible for the technical processing of chart elements – including identifying the ‘Chart Type’ and extracting quantifiable data points. Simultaneously, the Domain Analyst applies specialized ‘Professional Domain’ knowledge to contextualize these findings, ensuring extracted insights are not only numerically accurate but also relevant and interpretable within a specific field of expertise. This collaborative architecture allows for a more comprehensive and nuanced understanding of the data presented in the chart.
The Insight Extraction Agent utilizes a dual-analyst system to process chart data. The Data Analyst component concentrates on identifying quantitative insights directly derived from the ‘Chart Type’ – for example, recognizing trends in line graphs, comparing values in bar charts, or interpreting proportions within pie charts. Simultaneously, the Domain Analyst applies knowledge specific to the relevant ‘Professional Domain’ – such as finance, healthcare, or engineering – to contextualize these findings. This process moves beyond simple data identification to provide interpretations relevant to the subject matter, ensuring extracted insights are not only accurate but also meaningful within the applicable professional context.
The implementation of a dual-agent system – comprising a Data Analyst and a Domain Analyst – directly addresses the need for both statistical validity and practical applicability in chart insight generation. The Data Analyst’s focus on chart-type specific quantitative analysis minimizes errors in data interpretation and ensures factual correctness. Simultaneously, the Domain Analyst provides crucial contextualization, preventing misapplication of data and guaranteeing that identified trends are relevant within the specified professional domain. This collaborative process mitigates the risk of generating statistically sound but meaningless insights, or conversely, intuitively plausible but unsupported conclusions, resulting in a higher fidelity of actionable intelligence.
Measuring the Ephemeral: Insight Quality and Diversity
CIAF’s capabilities are rigorously tested using the ‘ChartSummInsights Dataset’, a specialized benchmark designed to evaluate chart summarization performance. This dataset comprises 240 images sourced from Our World in Data, a leading platform for data-driven journalism and research. Crucially, each chart within the dataset is paired with expertly crafted, human-written summaries, providing a gold standard against which CIAF’s generated insights can be measured. This carefully curated collection ensures a robust and reliable assessment of the system’s ability to accurately and comprehensively interpret visual data, moving beyond simple pattern recognition to meaningful and insightful summarization.
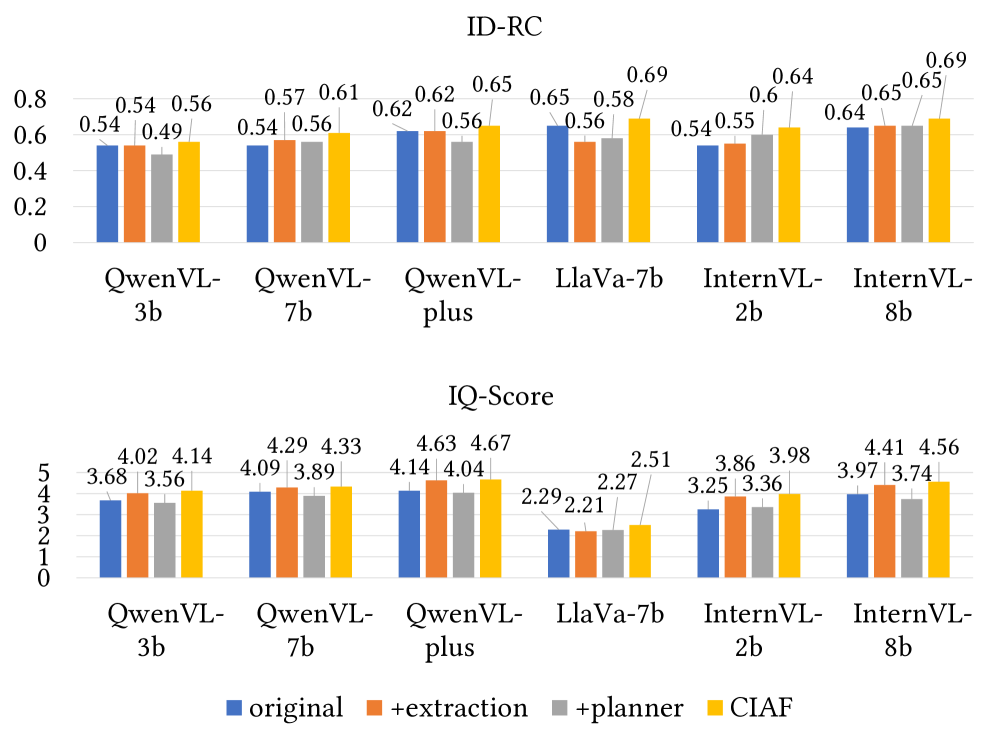
The quality of generated insights is rigorously evaluated through the ‘Insight Quality (IQ) Score’, a metric designed to quantify both the depth of understanding and factual accuracy present in each generated summary. This score doesn’t simply assess whether an insight exists, but rather how thoroughly it explores the data presented in the chart and how reliably it reflects the underlying truths. A higher IQ Score indicates a more comprehensive and trustworthy interpretation, moving beyond superficial observations to capture nuanced details and avoid misrepresentations. The metric is carefully calibrated to reward insights that demonstrate a strong connection to the visual evidence, ensuring that the generated summaries are not only informative but also grounded in verifiable data.
Assessing the range of viewpoints captured by a system requires dedicated metrics, and this work utilizes ‘Insight Diversity’ (ID) measures such as Remote-Clique (RC) and Span to quantify the breadth of generated insights. These metrics reveal that CIAF consistently outperforms baseline methods, not only improving the overall quality of insights – as measured by the GPT Score – but also significantly enhancing the diversity of perspectives presented. The SBERT-based diversity score further confirms this trend, indicating that CIAF is capable of generating a wider array of interpretations and observations from visual data, moving beyond simply replicating common knowledge and towards a more nuanced understanding of the information presented in charts.
The pursuit of automated chart summarization, as detailed in this framework, isn’t about imposing order on data – it’s about cultivating an environment where insights can emerge. This work acknowledges that a single monolithic model will inevitably falter, much like a rigidly designed system facing unforeseen realities. It anticipates the limitations of any static approach, instead proposing a dynamic interplay of agents. As Barbara Liskov observed, “Programs must be correct, not just functional.” This framework doesn’t simply aim for output; it strives for reliable insight extraction, acknowledging that the true measure of success lies not in generating summaries, but in generating trustworthy understandings of the visualized data. The inherent diversity encouraged within the multi-agent system is a direct response to the unavoidable entropy of complex information landscapes.
What Lies Ahead?
The pursuit of ‘insightful’ summarization, as demonstrated by this work, inevitably confronts the uncomfortable truth that insight isn’t a property of the chart itself, but a function of the observer’s pre-existing cognitive architecture. Chart Insight Agent Flow (CIAF) offers a fascinating choreography of Large Language Models, yet each agent remains a local maximum in a vast, unmapped solution space. The framework’s efficacy will be less about achieving ‘correct’ summaries and more about systematically exploring the boundaries of plausible interpretation. A guarantee of insight is, after all, merely a contract with probability.
The presented dataset, ChartSummInsights, is a necessary, if provisional, step. Future iterations must abandon the illusion of ground truth; true evaluation will require measuring not correspondence to a single ‘correct’ answer, but the diversity of generated interpretations and their subsequent impact on decision-making. Stability is merely an illusion that caches well; the system’s true robustness will be revealed by its ability to gracefully degrade when confronted with genuinely novel or ambiguous visualizations.
Ultimately, the architecture of such systems isn’t a matter of construction, but of cultivation. CIAF, and its successors, should be viewed not as tools, but as ecosystems. The current focus on multimodal integration is sensible, but the most significant gains will likely arise from embracing the inherent chaos of interpretation – for chaos isn’t failure, it’s nature’s syntax.
Original article: https://arxiv.org/pdf/2602.18731.pdf
Contact the author: https://www.linkedin.com/in/avetisyan/
See also:
- Invincible Season 4 Gender Swaps Tech Jacket As Fans Question Major Comic Change
- Building Agents That Learn and Improve Themselves
- Gold Rate Forecast
- Games That Faced Bans in Countries Over Political Themes
- Silver Rate Forecast
- Trading Crypto with AI: A New Approach to Portfolio Management
- 15 Films That Were Shot Entirely on Phones
- Why Won’t It Just *Do* What You Ask? Unpacking the Quirks of AI Language
- Unveiling the Schwab U.S. Dividend Equity ETF: A Portent of Financial Growth
- Thinking Before Acting: A Self-Reflective AI for Safer Autonomous Driving
2026-02-24 20:11