XRP Price Prediction: XRP’s Logarithmic Breakout Marks Beginning of Potential $10 Bull Run
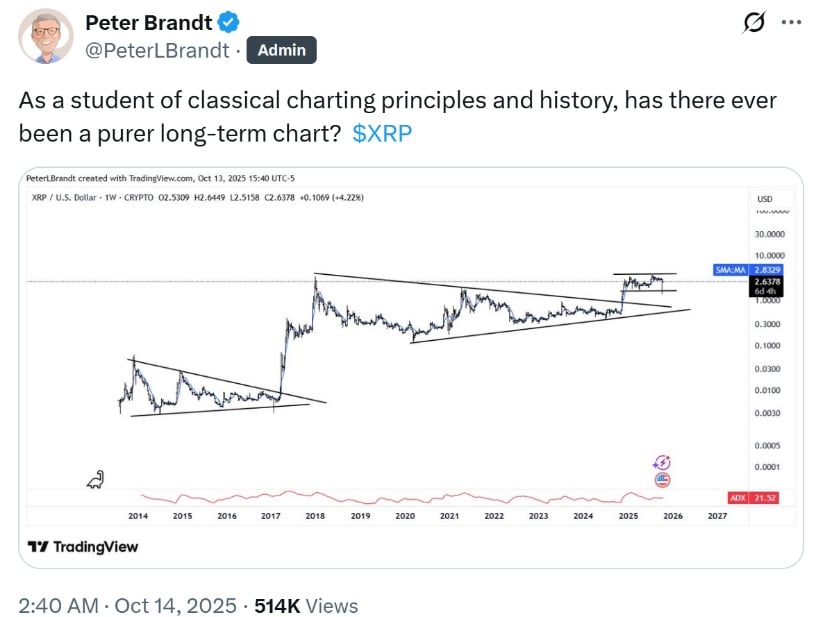
Veteran chartist Peter Brandt, whose trading experience spans five decades (yes, he’s been around long enough to remember the dinosaurs), has pointed to XRP’s multi-year logarithmic chart and dubbed it a “textbook breakout” from a descending channel that dates back to 2014. Brandt, who likely has more chart patterns in his sleep than most of us see in a lifetime, compared this structure to the explosive commodity bull runs of the past. This is no regular breakout; it’s a breakout with a capital B!