Author: Denis Avetisyan
A new method leverages the principles of network science to create synthetic time series data, offering a compelling alternative to computationally intensive deep learning approaches.
![The Inverse Quantile Graph (InvQG) method maps synthetic time series data to quantile graphs, a technique adapted from prior work [Campanharo et al., 2011] and suggesting that complex system behavior can be understood through the distribution of its constituent events.](https://arxiv.org/html/2601.22879v1/inverse_ts_mapping_qg.png)
This review details a novel technique for generating synthetic time series by mapping data to complex networks using Quantile Graphs, preserving key statistical characteristics for improved data augmentation and analysis.
Access to high-quality time series data is often hampered by privacy restrictions, cost, and labeling efforts. This limitation motivates the research presented in ‘Synthetic Time Series Generation via Complex Networks’, which introduces a novel framework for creating realistic time series data by mapping them to complex networks using Quantile Graphs. The authors demonstrate that reconstructing time series from these network representations preserves key statistical and structural properties, offering a competitive alternative to deep learning approaches like Generative Adversarial Networks. Could this network-based methodology unlock new avenues for data augmentation and analysis in time series applications?
The Inevitable Distortion: Representing Temporal Complexity
Time series data, characterized by observations ordered in time, often exhibits intricate dependencies that pose significant challenges to traditional analytical methods. These methods frequently assume data points are independent or rely on linear relationships, failing to account for the non-linear, multi-scale, and often chaotic dynamics inherent in many real-world time series. Consequently, attempts to model or forecast these series using simplified approaches can lead to inaccurate results and a diminished understanding of the underlying processes. The inability to effectively capture these complex interdependencies limits the potential for predictive accuracy in fields ranging from financial markets and weather forecasting to biomedical signal processing and industrial monitoring, highlighting the need for more sophisticated analytical techniques.
While statistical feature extraction techniques, such as calculating autocorrelation or spectral density, have long been staples in time series analysis, these methods often provide an incomplete picture of the underlying processes at play. Autocorrelation, for instance, reveals the degree of similarity between a time series and a lagged version of itself, but fails to capture non-linear dependencies or complex interactions spanning multiple time steps. Similarly, spectral analysis, while useful for identifying dominant frequencies, can obscure transient patterns or subtle shifts in the time series’ behavior. Consequently, relying solely on these summarized statistics risks overlooking crucial dynamic information, leading to inaccurate modeling and potentially flawed forecasts – a limitation that necessitates more sophisticated representational approaches capable of preserving the richness and complexity inherent in time series data.
Analyzing time series data effectively necessitates a shift away from relying solely on aggregated statistical measures. While statistics like mean, variance, and autocorrelation provide a basic understanding, they often fail to capture the intricate, non-linear dependencies and temporal structures inherent within the data. Modern approaches prioritize methods that directly model these underlying relationships, recognizing that a time series isn’t just a collection of values but a dynamic system evolving over time. Techniques such as wavelet transforms, recurrence plots, and increasingly, deep learning architectures are employed to uncover these hidden structures, allowing for more nuanced interpretations and significantly improved predictive capabilities. By focusing on the arrangement of data points – the patterns, cycles, and dependencies – rather than simply summarizing their values, analysts can unlock deeper insights and create more robust models for forecasting and understanding complex temporal phenomena.
Mapping the Flow: From Time to Network Topology
The Quantile Graph transforms a time series into a network by representing data points as nodes and establishing edges based on quantile transitions. Specifically, a directed edge is drawn from data point x_i to x_j if x_i is the k-th smallest value among all points up to time j, and x_j is the l-th smallest value among all points up to time j, where k < l. This process effectively maps the order of data points within the time series to network connections, preserving information about relative magnitudes and transitions in the data’s rank. The resulting graph’s structure reflects the dynamic changes in the time series’ distribution, allowing for the application of network analysis techniques to characterize temporal patterns.
The Visibility Graph (VG) transforms a time series into a network where nodes represent data points and edges signify visibility between them. Visibility is defined as an unobstructed line-of-sight between two points, x_i and x_j, meaning no other point x_k lies on the line segment connecting them. Formally, for i < j, x_k is not visible from x_i to x_j if x_k = αx_i + (1-α)x_j for some 0 < α < 1. This visibility criterion establishes direct connections in the VG, resulting in a network where the density of connections reflects the local extrema and turning points within the original time series. The resulting graph structure provides a refined network representation compared to solely using quantile transitions, emphasizing relationships based on direct observational linkages within the data.
Network representations of time series data enable the application of established graph algorithms for characterization and analysis. By framing time series data as networks – where data points become nodes and relationships between them define edges – techniques such as centrality measures, community detection, and pathfinding can be utilized to identify key patterns and structural properties. This approach facilitates Topological Feature Extraction, allowing quantification of network properties like node degree, clustering coefficient, and shortest path lengths, which serve as features for time series classification, anomaly detection, and forecasting. These extracted topological features offer a complementary perspective to traditional time-domain or frequency-domain analyses, potentially revealing hidden relationships and complexities within the data.
![The Quantile Graph mapping method transforms a time series by aligning its quantiles, as illustrated by the example adapted from Campanharo et al. [2011] and Silva et al. [2021].](https://arxiv.org/html/2601.22879v1/ts_mapping_qg.png)
The Ghost in the Machine: Generating Synthetic Temporal Echoes
The Inverse Quantile Graph (IQG) provides a method for generating synthetic time series data by reversing the process used to create network representations from observed data. Initially, time series values are mapped to a network space based on their quantile distribution; this creates a probabilistic network reflecting the statistical properties of the original series. The IQG then operates on this network, allowing for the creation of new network instances which, when mapped back to the time domain using the original quantile mapping, yield synthetic time series. This approach effectively translates probabilistic relationships within the network into corresponding statistical characteristics in the generated time series, preserving key features of the original data’s distribution without directly replicating it.
TimeGAN and DoppelGANger represent advanced generative adversarial networks (GANs) specifically designed for time series data. TimeGAN employs a recurrent generator and discriminator network, trained to minimize the Wasserstein distance between real and synthetic time series, thereby improving data fidelity. DoppelGANger, conversely, focuses on learning a latent representation of the time series and then generating new series by sampling from this latent space, prioritizing diversity. Both models address limitations of traditional GANs when applied to sequential data, such as vanishing gradients and the difficulty of capturing temporal dependencies, resulting in synthetic time series that more closely resemble the statistical properties and complexity of real-world data compared to simpler generative techniques.
A Markov Transition Matrix (MTM) is employed in synthetic time series generation to model the probabilities of transitioning between defined states or regimes within the data. The MTM, a |n x n| matrix where |n| represents the number of states, quantifies the likelihood of moving from one state |i| to another |j| at each time step. By structuring the generative process to adhere to these transition probabilities, the synthetic data accurately reflects the sequential dependencies observed in the original time series. This probabilistic modeling ensures that the generated data exhibits realistic state persistence and switching behavior, improving the fidelity and utility of the synthetic dataset for applications such as anomaly detection, forecasting, and system identification.

The Illusion of Reality: Validating Synthetic Temporal Constructs
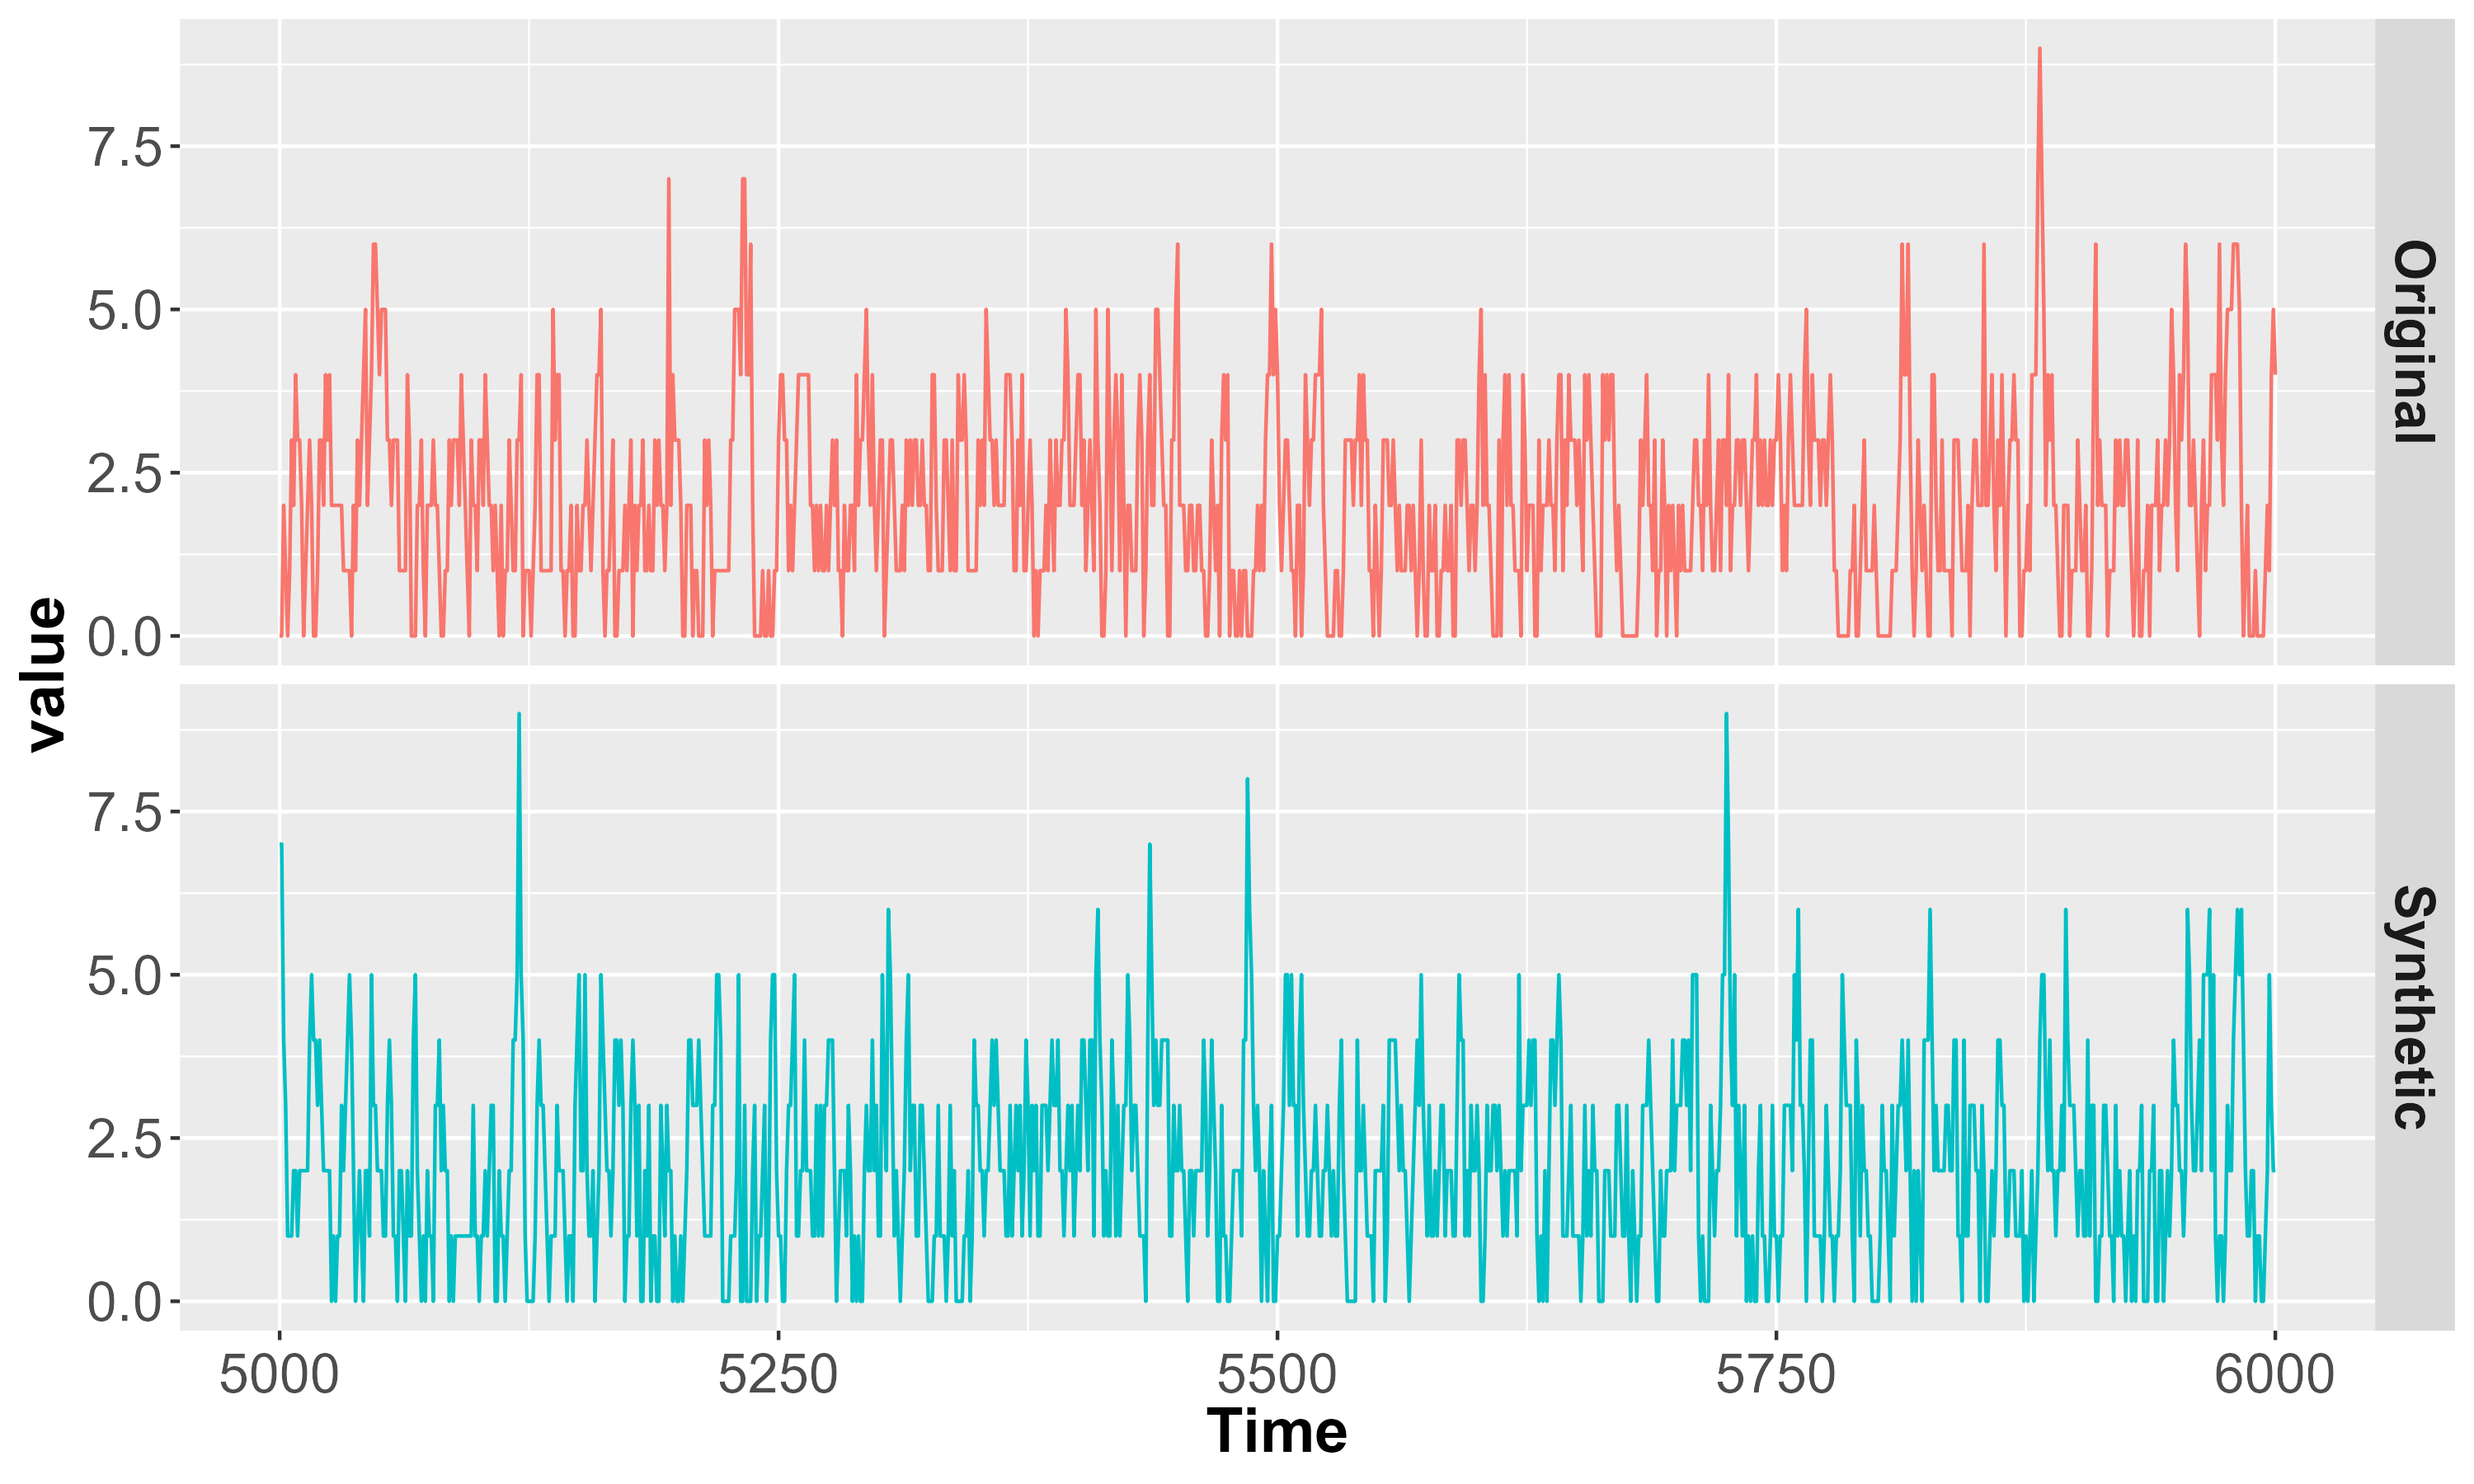
The creation of valuable synthetic time series data hinges on a dual assessment of its quality: fidelity and utility. Fidelity, in this context, measures how well the synthetic data mirrors the statistical characteristics and patterns present in the original data – effectively, how convincingly it looks like the real thing. However, accurate replication isn’t enough; utility determines whether this synthetic data can be effectively used for its intended purpose, such as training machine learning models or performing robust data analysis. A dataset might possess high fidelity – closely resembling the original – yet lack the utility needed for practical application if it fails to capture the nuances essential for downstream tasks. Consequently, evaluating synthetic data requires considering both its resemblance to the source material and its performance in real-world scenarios, ensuring it’s not only a convincing imitation but also a functional substitute.
Evaluating the trustworthiness of synthetic time series data fundamentally relies on confirming its fidelity – how well it mirrors the statistical characteristics of the original data. Statistical feature extraction serves as a crucial process in this validation, involving the calculation of properties like mean, standard deviation, autocorrelation, and spectral density, both for the real and generated datasets. By comparing these features, researchers can quantitatively assess whether the synthetic data accurately reproduces the underlying patterns and distributions present in the original time series. A successful preservation of these statistical properties is not merely an academic exercise; it directly impacts the utility of the synthetic data in downstream tasks such as model training, anomaly detection, and forecasting, ensuring that insights derived from the synthetic data are reliable and representative of the real-world phenomena they intend to simulate.
Topological feature extraction provides a powerful means of evaluating the practical value of synthetic time series data beyond simple statistical resemblance. This approach doesn’t merely assess if the synthetic data looks like the original; it examines whether the underlying structural relationships within the data are preserved, enabling more reliable analysis and modeling. By focusing on aspects like connected components, loops, and voids in the data’s representation, topological methods reveal if the synthetic data supports the same kinds of inferences and predictions as the real data. This is particularly crucial in applications where subtle patterns and dependencies are important, such as anomaly detection or forecasting, as preserved topology indicates a greater capacity for the synthetic data to function effectively in downstream tasks and contribute to robust, meaningful results.
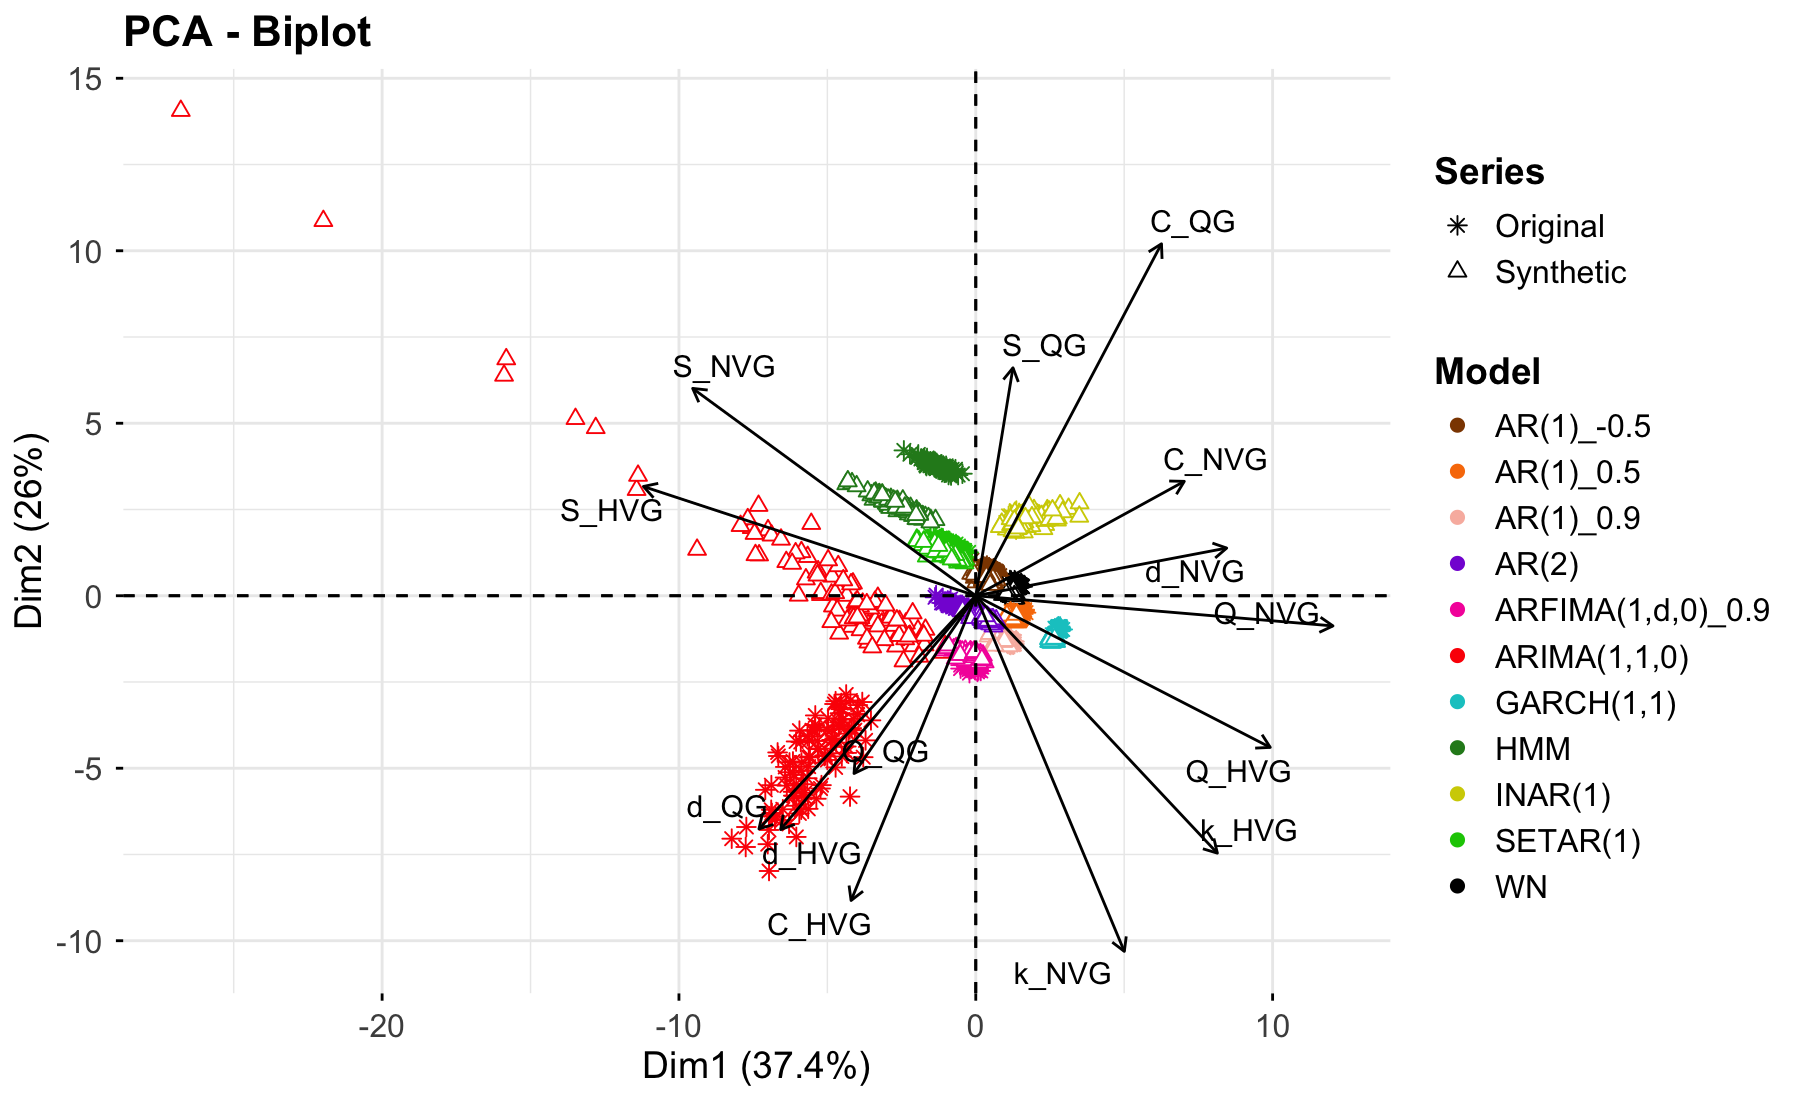
Principal Component Analysis visualizations reveal a compelling similarity between original and synthetically generated time series data across diverse modeling approaches. These visualizations consistently demonstrate close clustering of data points representing both real and synthetic datasets, suggesting the method effectively preserves key statistical features. This level of preservation is noteworthy, as it achieves comparable results to those obtained with more complex Generative Adversarial Network (GAN)-based techniques.
Dimensionality reduction through t-distributed stochastic neighbor embedding (t-SNE) provides compelling visual evidence of the Quantum-inspired Generative (QG) method’s superior performance in synthetic data generation. These visualizations consistently demonstrate that the distributions of synthetic time series created by the QG method more closely resemble those of the original data when contrasted with outputs from prominent generative adversarial networks like TimeGAN and DoppelGANger. Specifically, the QG-generated data points cluster more tightly with the original data’s distribution in the reduced-dimensional t-SNE space, suggesting a greater preservation of the underlying data structure and relationships. This improved alignment indicates that the QG method not only captures statistical features but also effectively models the complex dependencies inherent in the time series, potentially leading to more reliable results in downstream analytical tasks and modeling applications.
Principal Component Analysis reveals the capacity of this synthetic data generation method to effectively capture essential features present in original time series data, thereby confirming the retention of key statistical properties. Visualizations demonstrate a notable preservation of data structure, indicating the synthetic datasets closely mirror the characteristics of their real-world counterparts. However, analyses also highlight inherent challenges in perfectly replicating the intricacies of complex time series; subtle variations and nuanced patterns can prove difficult to fully synthesize. While the method achieves strong fidelity in capturing dominant statistical features, further refinement is necessary to address the complete reproduction of all underlying data characteristics and ensure seamless integration in demanding analytical applications.
The pursuit of synthetic time series, as detailed in this work, echoes a fundamental truth about complex systems: their behavior isn’t dictated by rigid control, but emerges from the interplay of countless, often unpredictable, connections. This research, by framing time series as networks and leveraging quantile graphs, doesn’t build data so much as cultivate it, allowing characteristics to propagate through the structure. As John von Neumann observed, “There is no possibility of absolute certainty.” The generation process, mirroring natural systems, accepts inherent uncertainty, acknowledging that every dependency – every connection within the quantile graph – is a promise made to the past, influencing future states. The model doesn’t strive for perfect prediction, but for a plausible evolution, recognizing that everything built will one day start fixing itself.
The Loom Unwinds
The mapping of temporal data onto network structures, as demonstrated, offers a momentary reprieve from the relentless pursuit of ever-more-complex generative models. Yet, this is not a solution, but a translation of problems. Each quantile graph, each node representing a point in time, is already haunted by the ghosts of missing data, of unmodeled dependencies. The network doesn’t create time; it encodes its fragility. Expect to see this approach strained by high-frequency data, by series exhibiting non-stationary variance – the network will fracture under the weight of real-world unpredictability.
The true challenge isn’t generating plausible series, but understanding the limitations of any generated series. This work hints at a shift away from purely predictive models, towards representations that explicitly encode uncertainty. The next iteration won’t focus on fidelity, but on the careful curation of controlled imperfections. The network will become a laboratory for controlled failures, a means of stress-testing downstream analytical processes.
Consider the inevitable: the proliferation of synthetic datasets, each tailored to exploit the weaknesses of specific detection algorithms. The arms race will not be about better generation, but about more sophisticated falsification. This is not a path to truth, but a dance with deception – and the music is already playing.
Original article: https://arxiv.org/pdf/2601.22879.pdf
Contact the author: https://www.linkedin.com/in/avetisyan/
See also:
- Invincible Season 4 Gender Swaps Tech Jacket As Fans Question Major Comic Change
- Silver Rate Forecast
- Gold Rate Forecast
- Building Agents That Learn and Improve Themselves
- 15 Films That Were Shot Entirely on Phones
- 22 Films Where the White Protagonist Is Canonically the Sidekick to a Black Lead
- 20 Movies Where the Black Villain Was Secretly the Most Popular Character
- Celebs Who Narrowly Escaped The 9/11 Attacks
- Games That Faced Bans in Countries Over Political Themes
- 18 TV Series Filming Rehearsals as Bonus Content
2026-02-02 21:21