
So, the stock market is currently doing its thing – which, let’s be honest, is often a bit like watching a caffeinated squirrel try to assemble a flat-pack wardrobe. Up one minute, down the next. It’s enough to give a person a headache, and a lot of investors are feeling distinctly uneasy. Recent surveys suggest around 40% are still optimistic, which is… well, optimistic. The other 30% are bracing for a bit of a wobble, and honestly, you can’t entirely blame them.
Predicting the market’s next move is, of course, a fool’s errand. If anyone genuinely knew, they’d be on a beach somewhere, sipping something exotic, and definitely not writing articles like this. But there are a few indicators that are starting to flash a bit of warning light, and it’s always prudent to take a look, just in case. Think of it as checking the weather forecast before a picnic – you might still go, but you’ll pack an umbrella.
Will the Stock Market Stage a Dramatic Exit in 2026?
There’s no crystal ball, sadly. Although, wouldn’t that be useful? I suspect it would be mostly used to find lost socks. Anyway, looking back at history can sometimes offer a bit of context. It’s not foolproof, mind you – history is full of things that never happened again – but it’s better than nothing. And right now, two particular metrics are raising a few eyebrows.
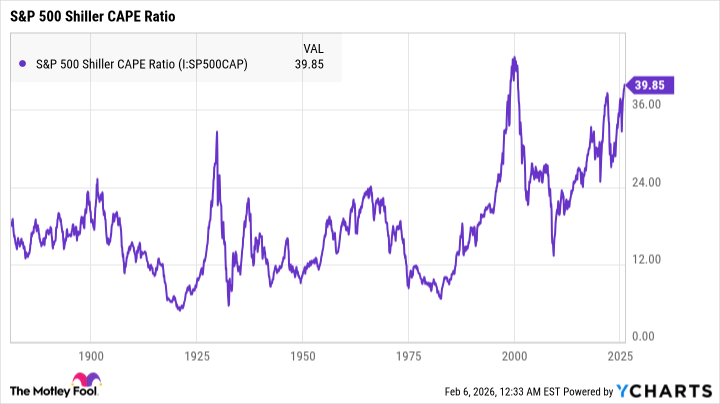
First, there’s the S&P 500 Shiller CAPE ratio. It’s a bit of a mouthful, I admit. It basically takes the average earnings of companies over the last ten years, adjusts for inflation (which is a fascinating story in itself, involving kings, sheep, and a surprising amount of bartering), and then compares that to the current stock price. The higher the number, the more… enthusiastically priced things are. Historically, around 17 is considered fairly normal. As of February 2026, though, it’s nudging 40. That’s… notable. It’s the second-highest reading ever, surpassed only by the giddy heights just before the dot-com bubble burst. Which, if you recall, wasn’t a particularly cheerful time.
Then there’s the Buffett indicator, named after, you guessed it, Warren Buffett. It’s a wonderfully simple idea, really. It compares the total value of all U.S. stocks to the size of the U.S. economy (GDP). Buffett, in a 2001 interview (and a remarkably prescient one, as it happens), pointed out that when this ratio falls to around 70-80%, stocks are looking like a good bet. But when it creeps up towards 200%… well, that’s when you start to feel a bit like you’re playing with fire. And right now? It’s at 221%. The last time it was this high was November 2021, just before the market decided to take a rather extended nap.
What Should Investors Do Right Now?
Now, before you rush off to sell everything and bury the proceeds in the garden (tempting, I know), let’s remember that no indicator is perfect. The market is a wonderfully unpredictable beast. Just because these numbers are flashing warning signs doesn’t guarantee a crash, a recession, or even a particularly grumpy bear market. But it does suggest that a bit of prudence wouldn’t go amiss.
The best thing you can do, perhaps, is to make sure your portfolio is prepared for a bit of turbulence. Think of it like checking the spare tire before a long road trip. That means double-checking that you’re investing in companies with solid foundations. Specifically, look for:
- Healthy Finances: A company needs to be on firm financial footing to weather a storm. A high stock price doesn’t necessarily mean a company is healthy – it just means a lot of people want to own a piece of it. Dig into the financial statements – look at profitability, debt levels, revenue growth – and see if the company is likely to survive tough times.
- Competitive Advantage: When the dot-com bubble burst, the companies that survived weren’t just lucky – they had something unique to offer. They provided a service or product that people actually wanted. Organizations that didn’t have a clear advantage – well, they vanished. The same principle applies today.
- A Strong Leadership Team: Even a great business can stumble with poor leadership. A strong executive team can navigate challenging times and make smart decisions. It’s a key factor for long-term success.
The stronger your portfolio, the more likely it is to survive even the worst market downturn. By double-checking your investments now, you’ll be better prepared for whatever the future may hold. And who knows? Maybe the market will continue to climb. But it’s always best to be prepared, just in case. After all, a little prudence never hurt anyone.
Read More
- Games That Faced Bans in Countries Over Political Themes
- Gold Rate Forecast
- Silver Rate Forecast
- Unveiling the Schwab U.S. Dividend Equity ETF: A Portent of Financial Growth
- 22 Films Where the White Protagonist Is Canonically the Sidekick to a Black Lead
- Superman Flops Financially: $350M Budget, Still No Profit (Scoop Confirmed)
- 20 Movies Where the Black Villain Was Secretly the Most Popular Character
- Celebs Who Narrowly Escaped The 9/11 Attacks
- 14 Movies Where the Black Character Refuses to Save the White Protagonist
- The Best Directors of 2025
2026-02-09 01:04