
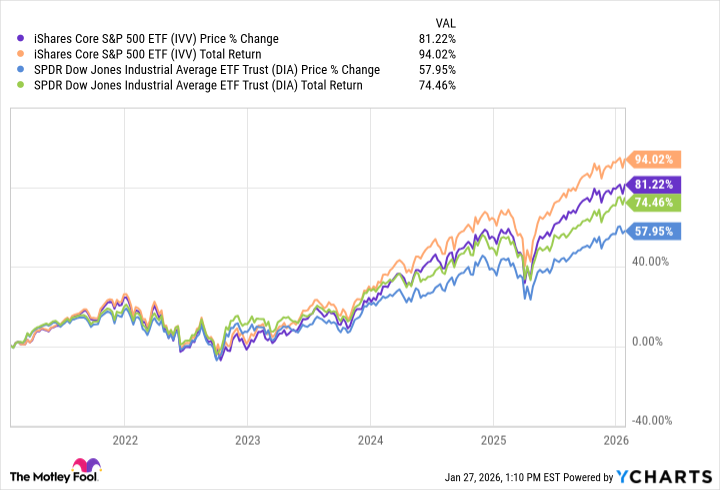
The iShares Core S&P 500 ETF (IVV +0.32%) and SPDR Dow Jones Industrial Average ETF Trust (DIA 1.09%) represent distinct approaches to capturing U.S. equity market exposure. While both provide access to a segment of the American economy, their construction and resulting performance characteristics diverge in ways that merit careful consideration by investors. A superficial comparison of returns obscures underlying structural differences that may prove more significant over extended periods.
Comparative Snapshot
The following table summarizes key metrics as of January 26, 2026:
| Metric | IVV | DIA |
|---|---|---|
| Issuer | iShares | SPDR |
| Expense Ratio | 0.03% | 0.16% |
| 1-Year Total Return | 15.4% | 13% |
| Dividend Yield | 1.05% | 1.4% |
| Beta | 1.00 | 0.89 |
| AUM | $763 billion | $44.1 billion |
Note: Beta is calculated from five-year weekly returns. The 1-year return reflects trailing twelve-month performance.
The disparity in AUM is immediately notable. IVV’s substantially larger asset base suggests greater liquidity and potentially tighter bid-ask spreads, a factor often overlooked in passive investment strategies. The lower expense ratio of IVV is, of course, advantageous, though the incremental savings may be offset by other factors for some investors.
Performance and Risk Profile
A review of historical performance reveals a nuanced picture. While IVV has demonstrated a marginally superior one-year return, a singular observation provides limited insight. The more pertinent metric is arguably maximum drawdown, which illustrates the potential downside risk. DIA’s significantly larger maximum drawdown (-43.43% vs. -27.67% for IVV) suggests a greater susceptibility to market corrections. This is not unexpected, given the concentrated nature of the Dow Jones Industrial Average.
Over a five-year period, a $1,000 investment in IVV would have grown to $1,814, compared to $1,582 for DIA. This difference, while not substantial, highlights the compounding effect of even modest outperformance combined with reduced volatility.
Portfolio Composition: A Matter of Concentration
DIA’s construction, predicated on a price-weighted index of 30 blue-chip companies, inherently limits diversification. Sector concentration is evident: financial services constitute 27.5% of the portfolio, followed by technology (18.9%) and industrials (15.8%). The top three holdings—Goldman Sachs (11.61%), Caterpillar (7.92%), and Microsoft (5.86%)—collectively represent a considerable portion of the fund’s assets.
In contrast, IVV’s exposure to the S&P 500 index provides a far broader representation of the U.S. equity market. While technology also constitutes the largest sector allocation (33.65%), the weighting is distributed across a significantly larger number of companies. Top holdings—Nvidia, Apple, and Microsoft—each represent a smaller proportion of the overall portfolio.
This difference in diversification has implications for risk management. DIA’s concentrated portfolio is more vulnerable to idiosyncratic risks—company-specific events that can negatively impact performance. IVV’s broader diversification mitigates this risk, though it does not eliminate it entirely.
Implications for Investors
Both IVV and DIA are viable options for investors seeking U.S. equity exposure. However, their distinct characteristics render them suitable for different investment objectives and risk tolerances. DIA, with its concentrated portfolio and higher volatility, may appeal to investors seeking potentially higher returns, coupled with a willingness to accept greater downside risk. Its emphasis on established, dividend-paying companies may also attract income-focused investors.
IVV, with its broader diversification and lower volatility, represents a more conservative approach. It is well-suited for investors seeking long-term capital appreciation, coupled with a desire to minimize downside risk. Its lower expense ratio further enhances its appeal as a core holding in a diversified portfolio.
The choice between IVV and DIA ultimately depends on an investor’s individual circumstances and investment objectives. A thorough understanding of the risks and rewards associated with each fund is essential before making a decision.
Glossary
- ETF (Exchange-Traded Fund): A fund holding a basket of securities that trades on an exchange like a stock.
- Expense Ratio: Annual fund operating costs expressed as a percentage of the amount invested.
- Dividend Yield: Annual dividends paid by a fund divided by its current share price, expressed as a percentage.
- Total Return: Investment performance including price changes plus all dividends, assuming dividends are reinvested.
- Beta: A measure of how volatile an investment is compared with a benchmark index, usually the S&P 500.
- AUM (Assets Under Management): The total market value of all assets a fund or manager oversees.
- Max Drawdown: The largest peak-to-trough decline in value over a specific period, indicating the worst historical loss.
- Price-Weighted Index: An index where companies with higher share prices have greater influence on index performance.
- Blue-Chip Stocks: Shares of large, well-established, financially sound companies with long records of stable performance.
- Sector Allocation: How a fund’s holdings are distributed across different industries, such as technology or financials.
- Core U.S. Equity Exposure: Foundational stock holdings intended to represent the broad U.S. stock market in a portfolio.
- Portfolio Diversification: Spreading investments across many holdings or sectors to reduce the impact of any single position.
Read More
- Top 20 Dinosaur Movies, Ranked
- 20 Movies Where the Black Villain Was Secretly the Most Popular Character
- Celebs Who Narrowly Escaped The 9/11 Attacks
- 25 “Woke” Films That Used Black Trauma to Humanize White Leads
- Spotting the Loops in Autonomous Systems
- Gold Rate Forecast
- The 10 Most Underrated Jim Carrey Movies, Ranked (From Least to Most Underrated)
- Transformers Under the Microscope: What Graph Neural Networks Reveal
- The Best Directors of 2025
- Silver Rate Forecast
2026-01-27 21:23