Ah, Hedera (HBAR), the fickle friend of the crypto world! Just yesterday, it plummeted over 4%, leaving its market cap at a mere $8.4 billion. A brief flicker of hope appeared earlier today, but alas, HBAR’s BBTrend remains a gloomy harbinger of bearishness.
Yet, the mystical Ichimoku Cloud whispers of a potential bullish reversal, should the buying spirits awaken. If the short-term EMA lines dare to cross above their long-term counterparts, HBAR might just flirt with resistance at $0.24 and, who knows, perhaps even breach the elusive $0.30 for the first time since the dawn of February.
HBAR BBTrend: A Bullish Dream Deferred
Currently, HBAR’s BBTrend languishes at -0.71, a negative echo since February 18, signaling a relentless bearish tide. It reached a dismal low of -6.21 on February 20, only to tease us with a recovery to -0.06 yesterday, before plummeting once more.
BBTrend, that fickle friend, measures the momentum and direction of price movements against the Bollinger Bands. A negative value? Oh, that’s just the price sliding toward the lower band, a clear sign of bearish sentiment. Meanwhile, a positive value would indicate a gallant charge toward the upper band.
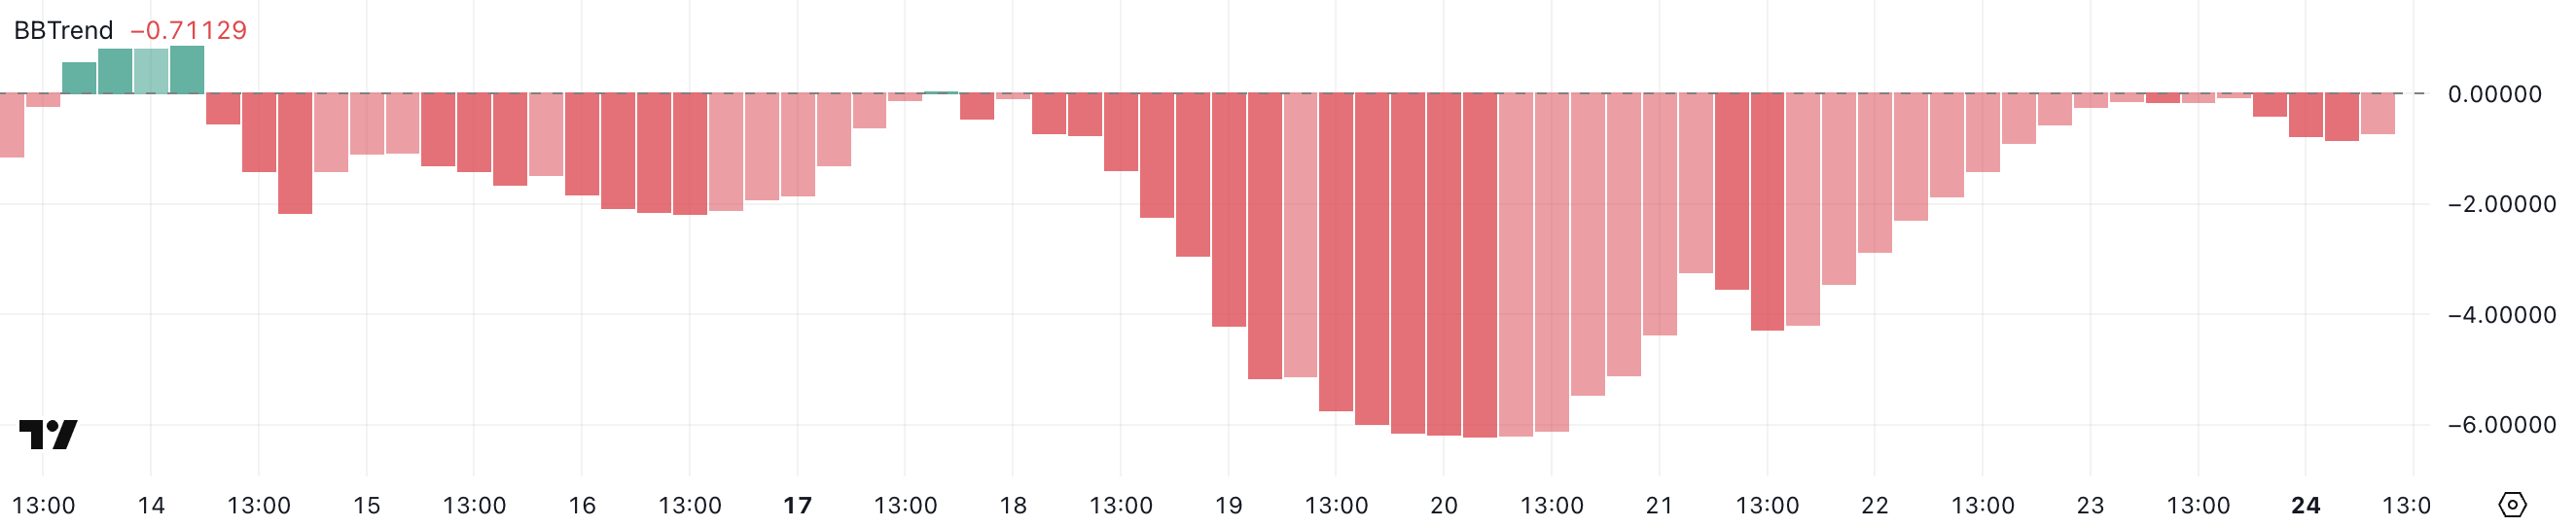
With Hedera’s BBTrend at -0.71, down from a hopeful -0.06, it seems the bearish forces are regaining their strength after a brief flirtation with recovery. This ominous shift hints at renewed selling pressure, potentially dragging prices down further if this negative trend continues.
The failure to maintain a positive shift? A clear sign of weakness in buying interest, increasing the likelihood of HBAR’s continued descent into the abyss. If BBTrend remains negative, brace yourselves for more selling pressure until a clear reversal emerges from the shadows.
HBAR Ichimoku Cloud: A Flicker of Hope Amidst the Gloom
The Ichimoku Cloud chart for HBAR reveals a recent break above the cloud, a typically bullish signal. But wait! The cloud ahead is thin and slightly bearish, a weak resistance indeed.
The blue Tenkan-sen line dances above the red Kijun-sen line, suggesting a flicker of short-term bullish momentum. Yet, their close proximity screams a lack of strong trend conviction.
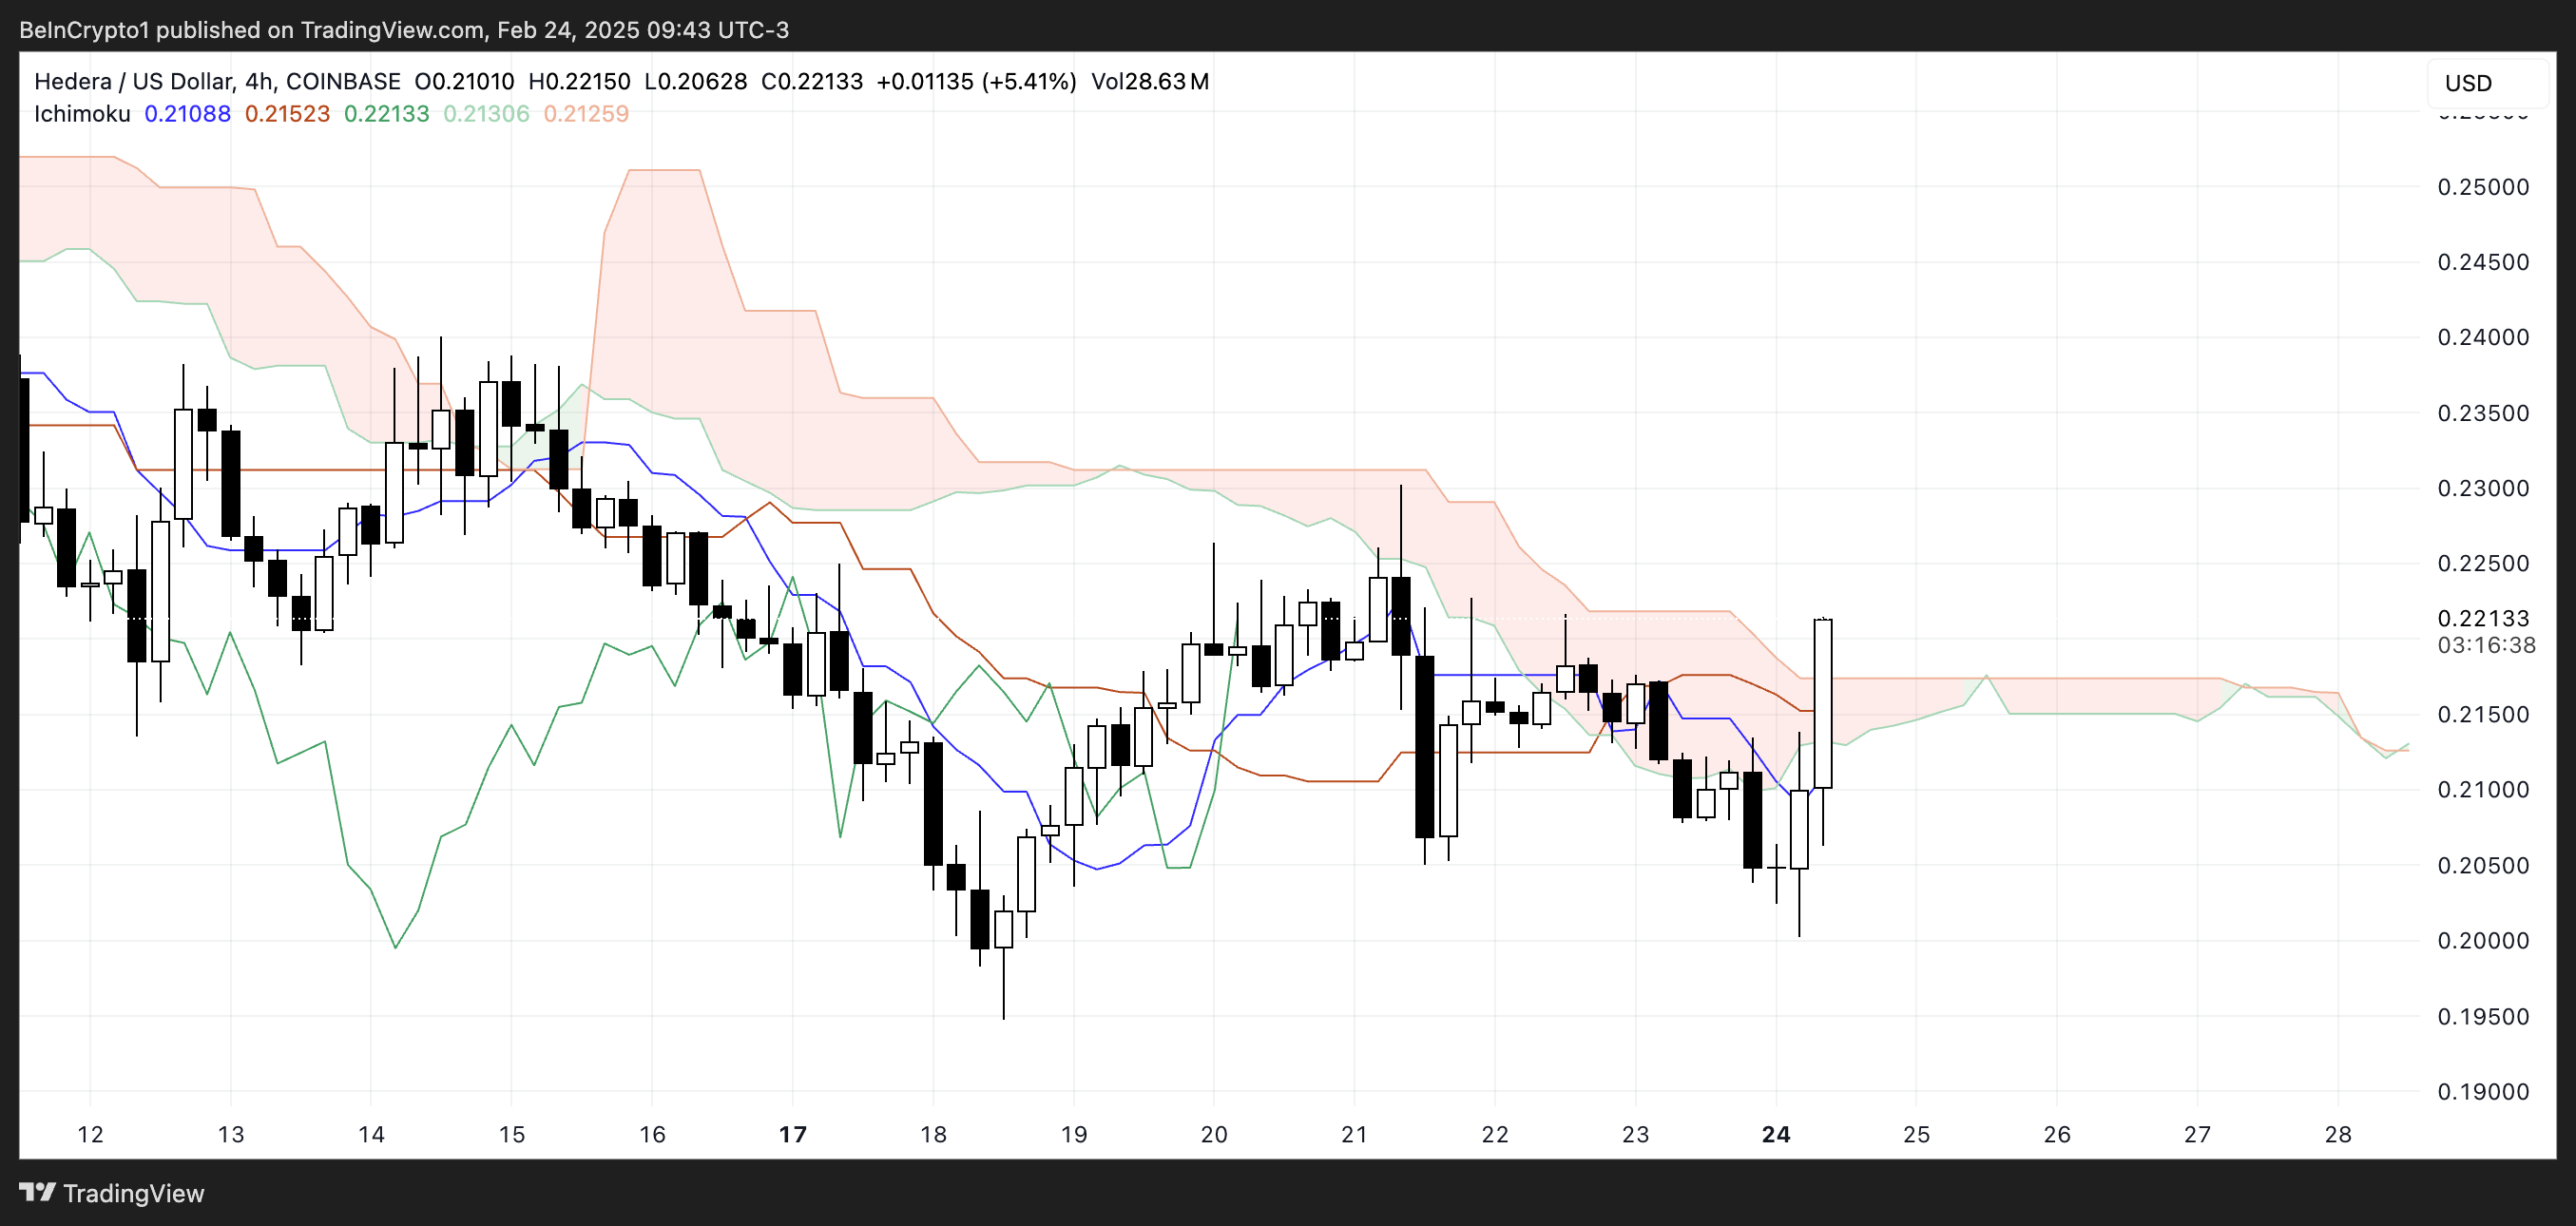
The green Chikou Span line hovers above the price, confirming bullish sentiment, but it’s too close for comfort, indicating indecision. The breakout above the cloud must be sustained for a continued uptrend; otherwise, it risks falling back into the depths of despair.
The $0.3 Dream – Is It Possible?
HBAR’s EMA lines indicate that the bearish trend still reigns supreme, with short-term lines perched above long-term ones, signaling ongoing selling pressure.
However, the Ichimoku Cloud dares to suggest a potential bullish reversal.
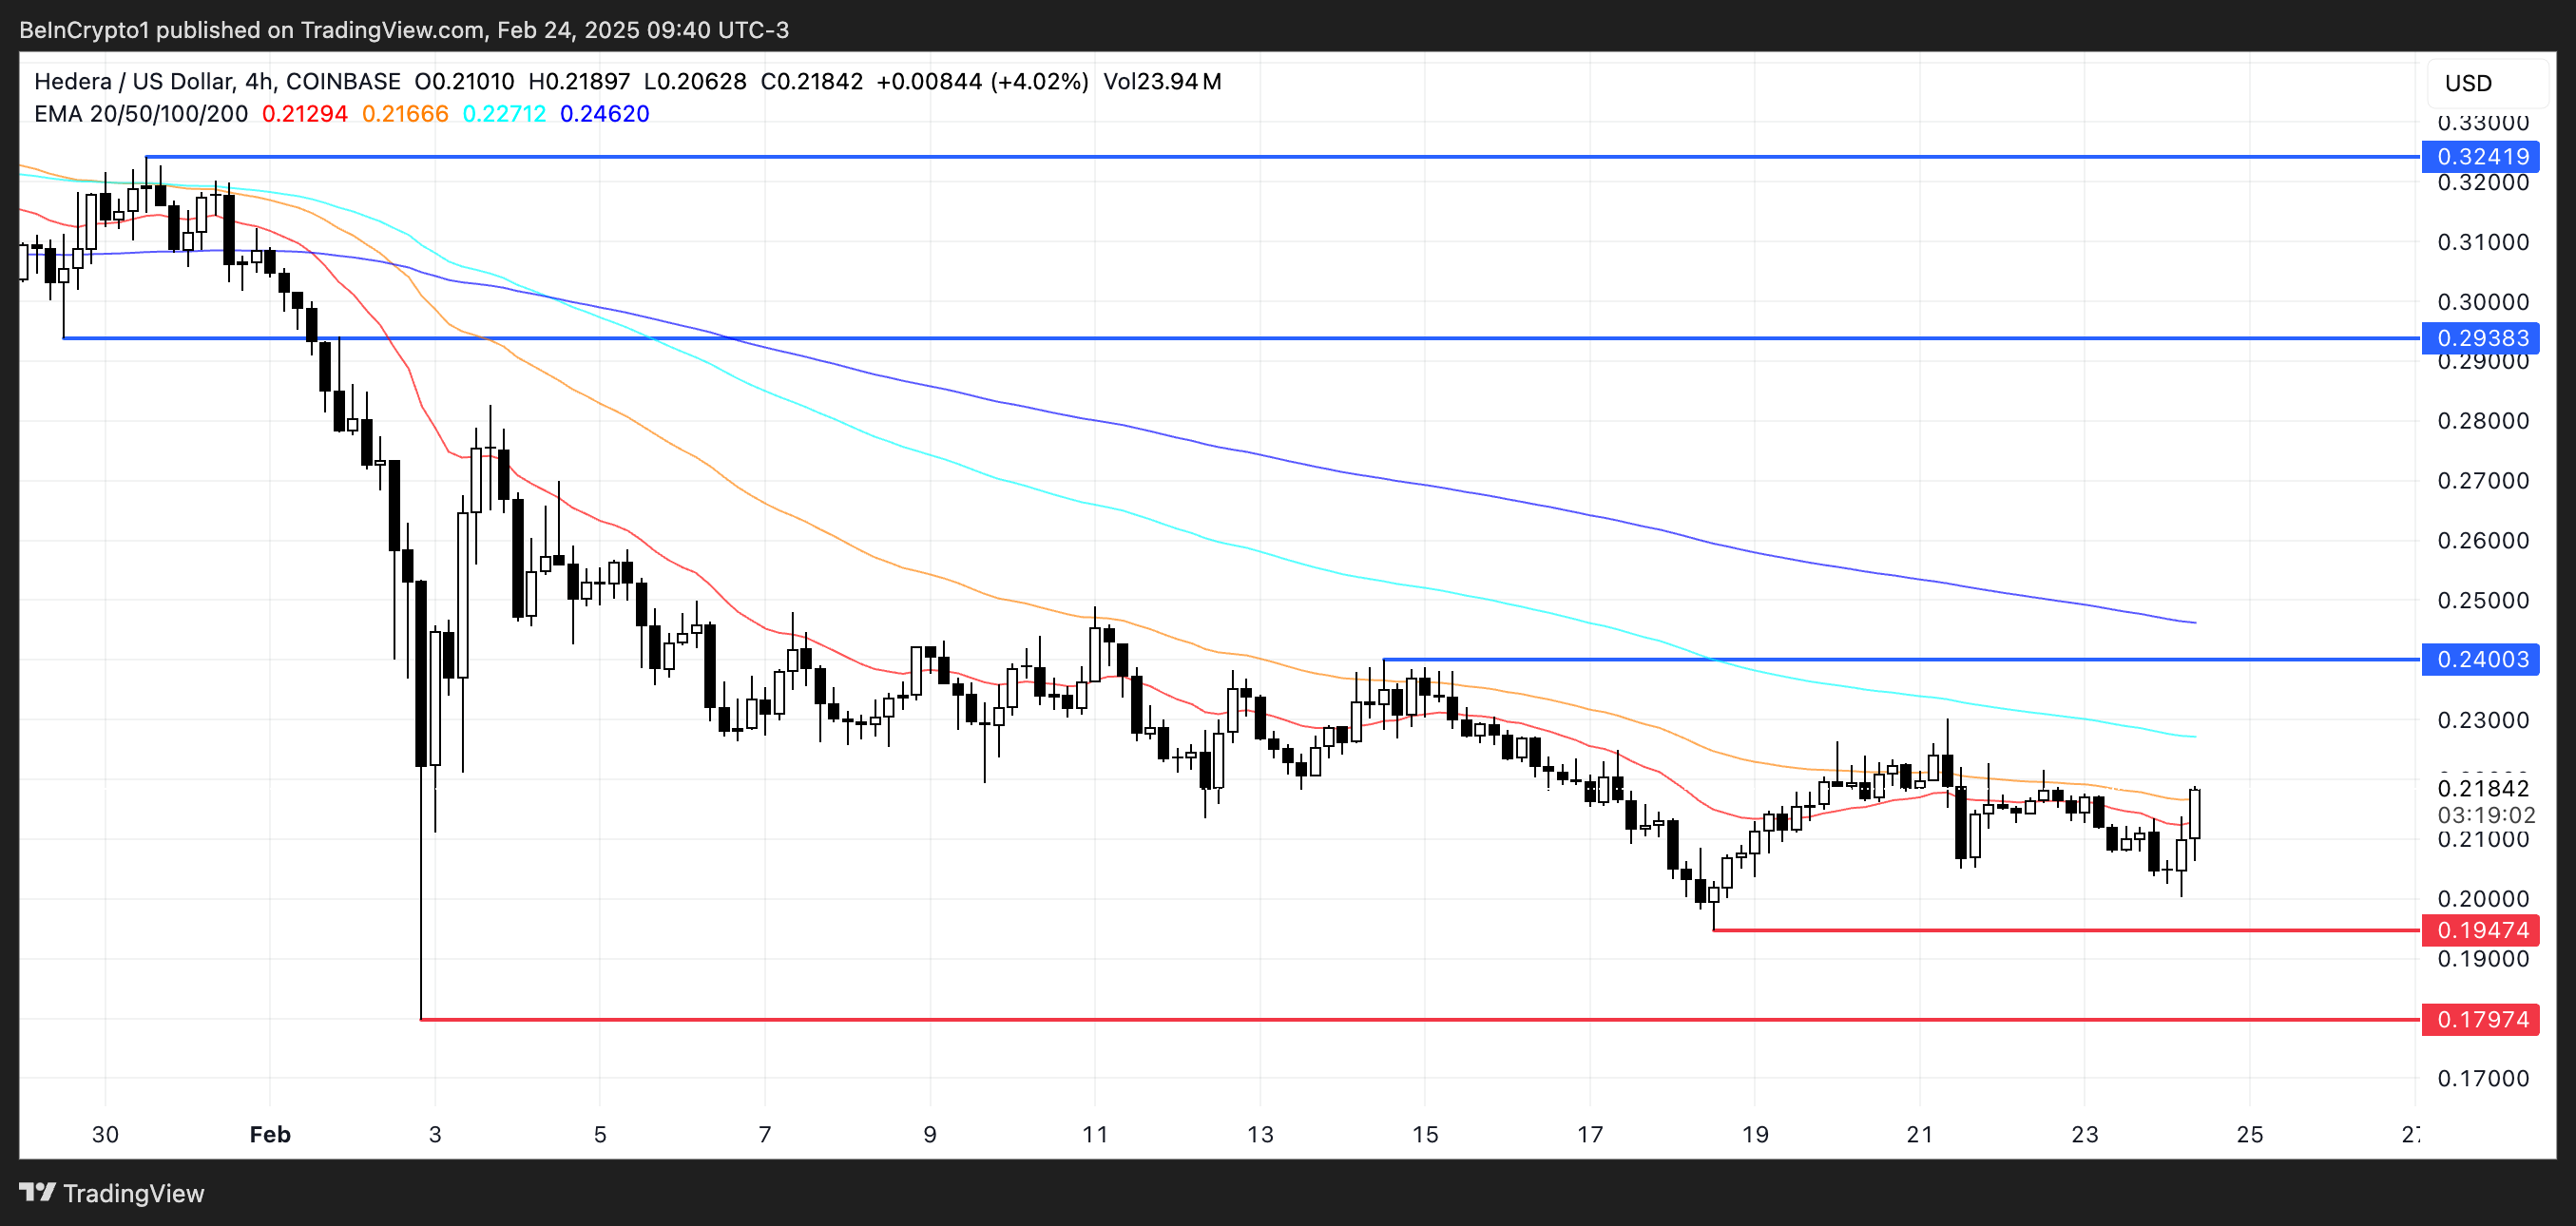
If the short-term EMA lines muster the courage to cross above the long-term ones, it could ignite a buying frenzy, leading HBAR to test the resistance at $0.24. Should it break above this level, we might see a rise to $0.29, and if the momentum holds, HBAR could finally soar to $0.32, marking its first triumphant leap above $0.30 since February 1.
But beware! If the current downtrend persists, HBAR may find itself retesting the support at $0.19. A break below this level would signal an increase in bearish momentum, potentially dragging it down to $0.
Read More
- Apothecary Diaries Ch.81: Maomao vs Shenmei!
- Mobile MOBA Games Ranked 2025 – Options After the MLBB Ban
- Gold Rate Forecast
- Batman and Deadpool Unite: Epic DC/Marvel Crossover One-Shots Coming Soon!
- Who was Peter Kwong? Learn as Big Trouble in Little China and The Golden Child Actor Dies at 73
- Hunter Schafer Rumored to Play Princess Zelda in Live-Action Zelda Movie
- 30 Best Couple/Wife Swap Movies You Need to See
- Netflix’s ‘You’ Season 5 Release Update Has Fans Worried
- Gachiakuta Chapter 139: Rudo And Enjin Team Up Against Mymo—Recap, Release Date, Where To Read And More
- Summer Game Fest 2025 schedule and streams: all event start times
2025-02-25 03:38