The price of Hedera (HBAR) has significantly dropped by 12.5% over the past 24 hours, with trading volume approximately $1 billion. This sharp decline is in line with bearish technical signals, such as a decreasing ADX, suggesting that although the downtrend continues, its strength is waning.
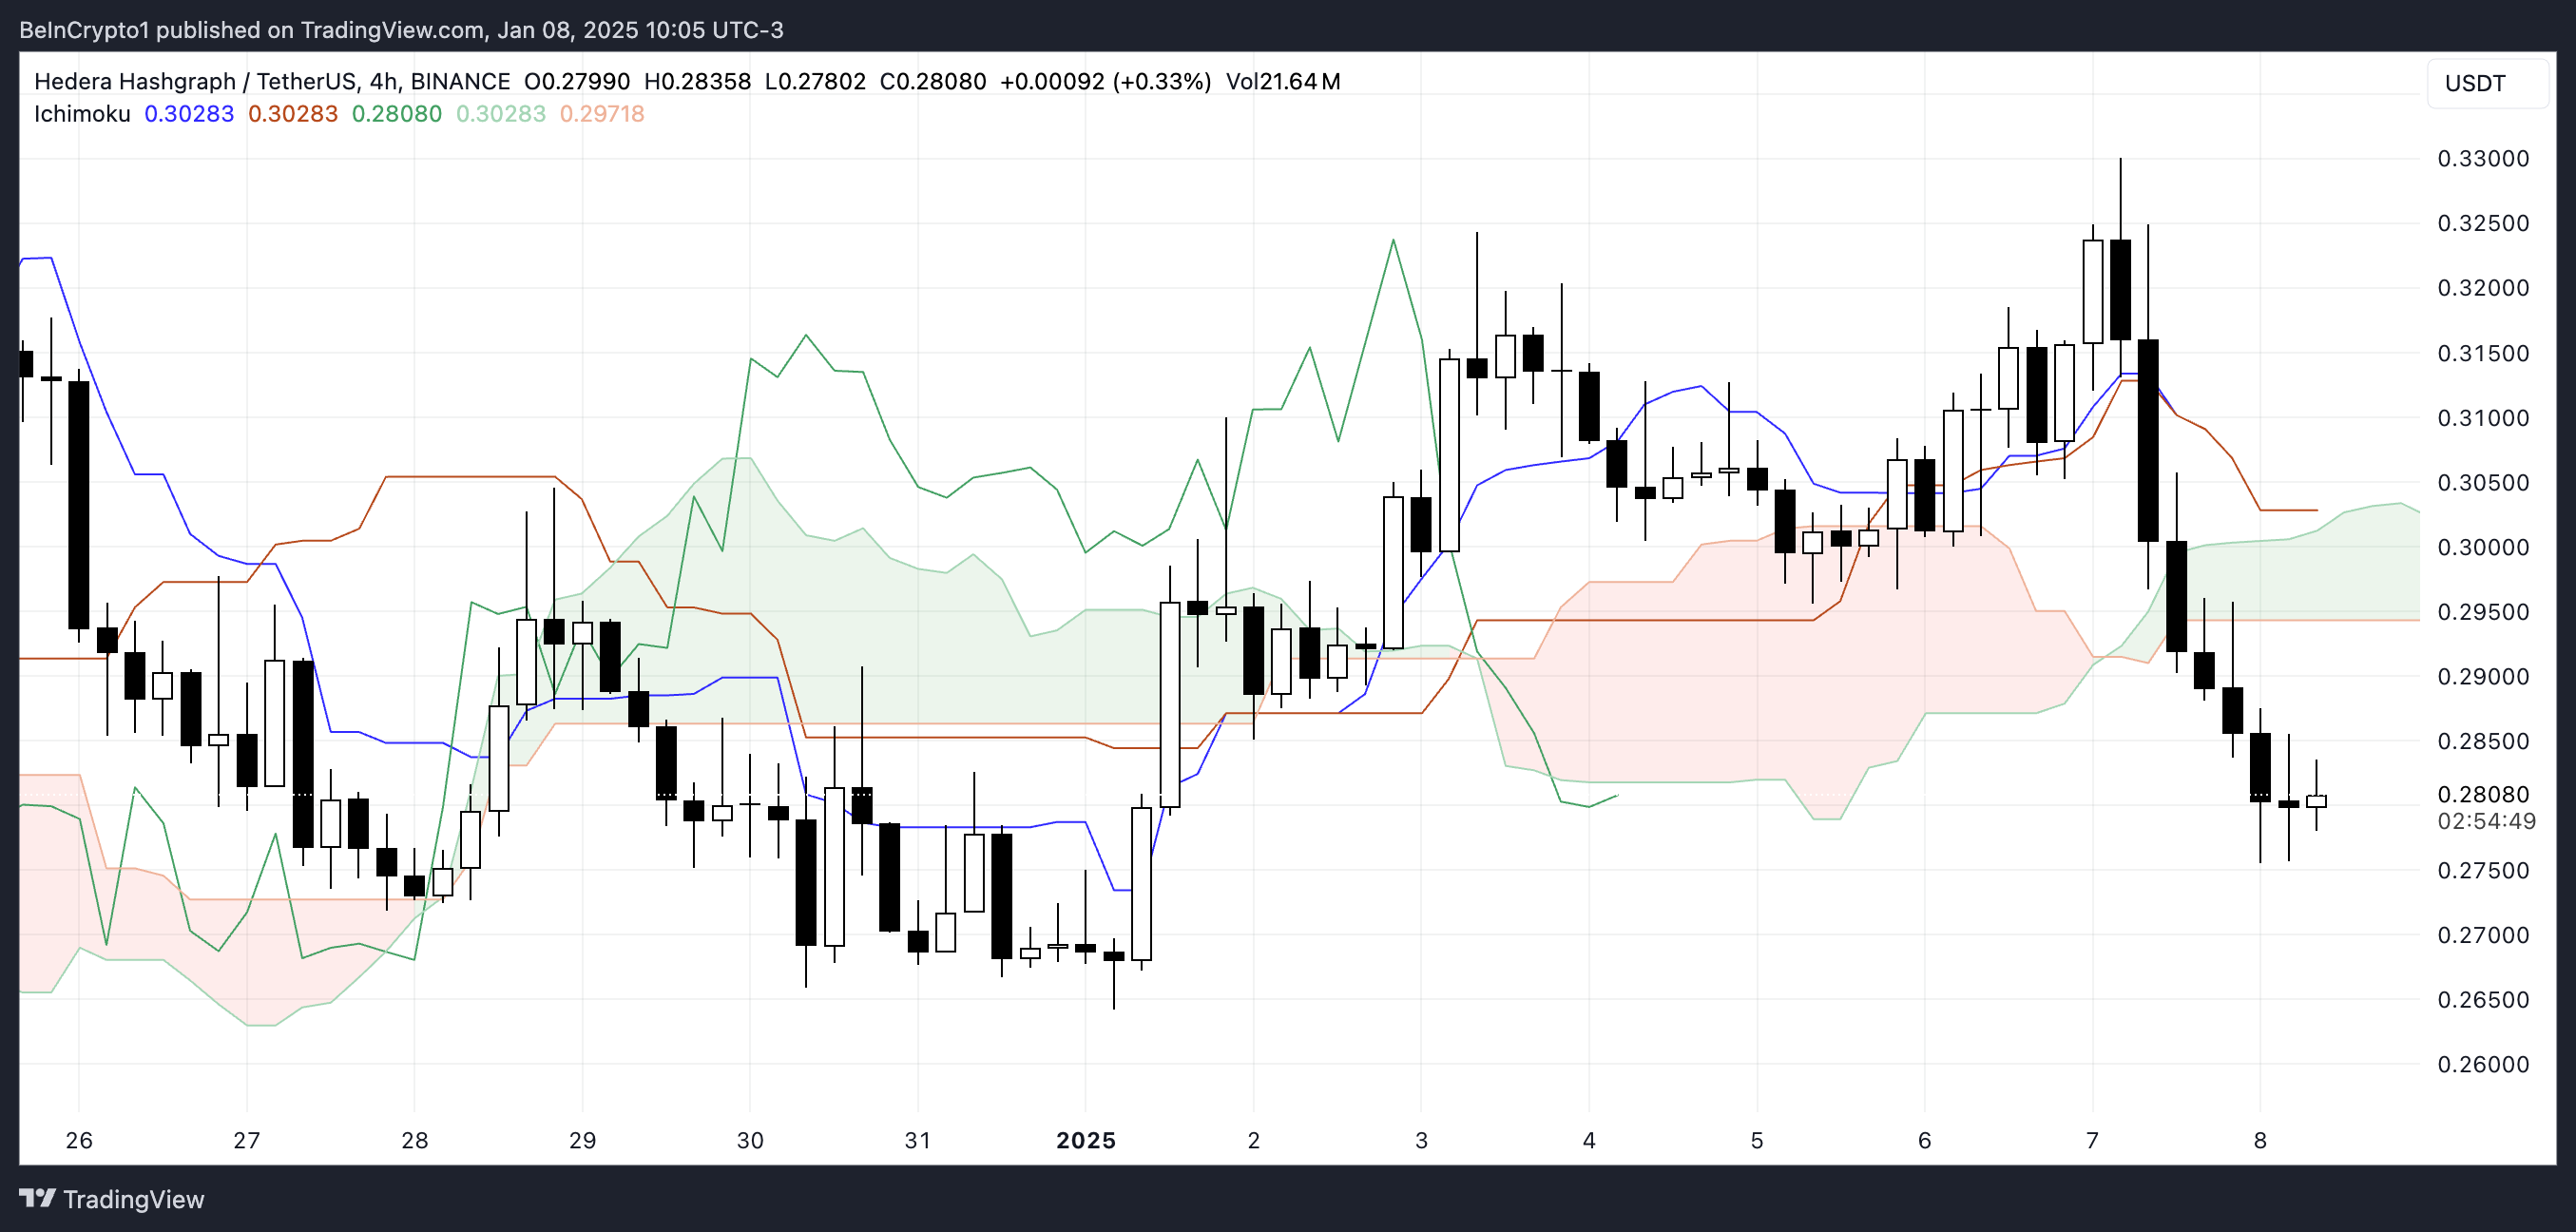
Currently, the price of HBAR is hovering beneath its Ichimoku Cloud, indicating potential resistance in the present market conditions. But if there’s a change in momentum and crucial support levels are maintained, it’s possible that HBAR might bounce back, possibly even reversing its recent declines.
Hedera ADX Shows Its Downtrend Is Still Here
The Average Directional Index (ADX) for Hedera, which indicates the strength of a trend regardless of its direction, has decreased to 27.9 today. Yesterday, when the recent correction started, it was at 37.9.
Values greater than 25 show a significant trend, implying strength, while values less than 20 suggest either a weak or nonexistent trend. In other words, the HBAR’s ADX being above 25 indicates that the downward trend is robust, although its drop from 37.9 suggests that bearish momentum might be weakening.

The decrease in ADX indicates that although the current downward trend remains, it might not be as intense as it used to be. Should the ADX keep falling, HBAR’s price may transition into a period of stabilization, characterized by lower volatility and diminished aggressive selling activity.
In other words, if there’s going to be a change in trend, there needs to be a substantial increase in buying activity that overpowers the current downward movement. As long as this doesn’t happen, the HBAR price may continue to face pressure and could potentially test lower support levels.
HBAR Ichimoku Cloud Indicates Bearish Setup
For HBAR, the Ichimoku Cloud chart suggests a downward trend, as the price is falling beneath the red-colored cloud area, suggesting that this region is acting as a barrier to the ongoing price movement, signifying potential resistance.
The red-colored cloud formed due to the gap between the Senkou Span A (represented by the green line) and Senkou Span B (the orange line), strengthens the evidence of a downward trend, or bearish momentum. This is particularly notable because the cloud’s descending angle indicates continuous pressure on the price, suggesting it will continue to move lower.

In simpler terms, when the price stays below a moving average (the “cloud”) and the predictive line (the “Chikou Span”) also falls beneath this and the current support level, it suggests that the decline in the market may continue, or the trend might persist as downward.
As a researcher, I find that for any anticipated turnaround in Hedera’s price, it is crucial that the price re-enters the price cloud, accompanied by a significant adjustment in the orientation of the key trend lines.
HBAR Price Prediction: Next Supports Are Fundamental
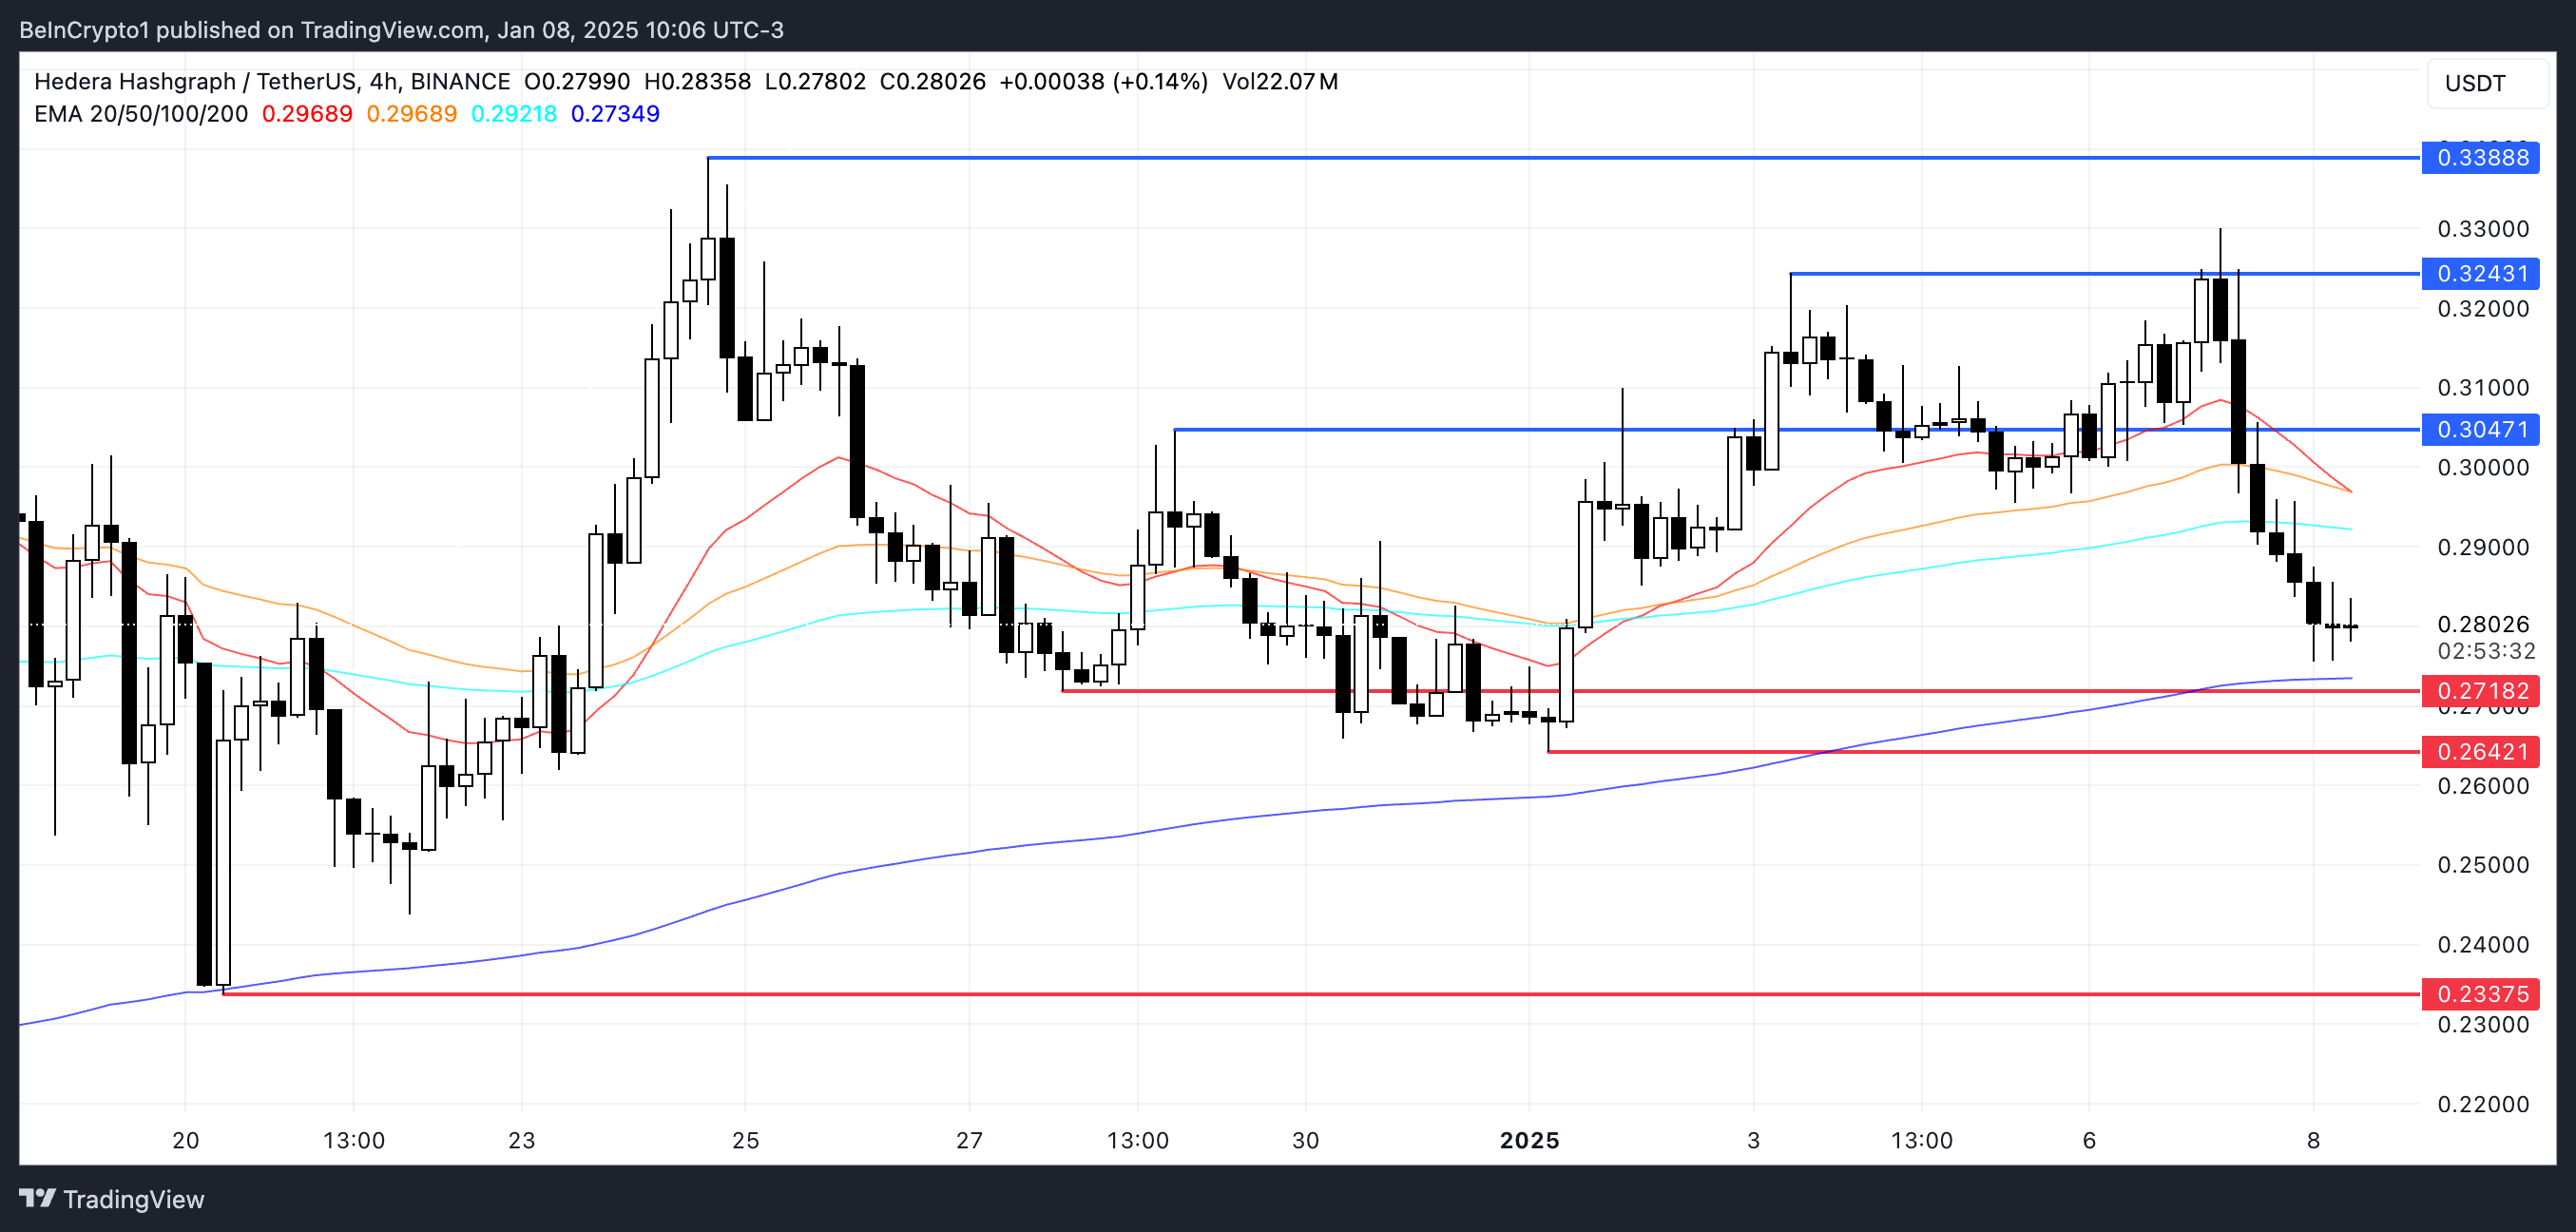
Based on the moving average analysis for HBAR’s price, it seems that the current corrective phase might become more pronounced if the short-term moving averages persist in falling and dip beneath the long-term moving averages, resulting in what’s known as a “death cross.
A bearish signal often signals an increase in strong negative movement, potentially causing HBAR to reach lower prices. If this occurs, HBAR might touch around $0.27 and $0.26. There’s also a chance it could fall further to about $0.23, implying a possible 17.8% decrease from its current value.

Yet, the ADX indicates that the ongoing downward trend may be losing intensity, potentially signaling a possible shift towards an uptrend. This hints at a potential turnaround.
If Hedera’s price continues to hold above crucial support points, it might trigger a new wave of buying pressure that pushes the price towards the resistance at $0.30. Overcoming this barrier could potentially open paths for growth to around $0.32 or even $0.338, representing a possible 20.7% increase.
Read More
- Does Oblivion Remastered have mod support?
- Thunderbolts: Marvel’s Next Box Office Disaster?
- To Be Hero X: Everything You Need To Know About The Upcoming Anime
- 30 Best Couple/Wife Swap Movies You Need to See
- DC: Dark Legion The Bleed & Hypertime Tracker Schedule
- Clair Obscur: Expedition 33 ending explained – Who should you side with?
- Summoners War Tier List – The Best Monsters to Recruit in 2025
- Elder Scrolls Oblivion Remastered: Best Paladin Build
- Clair Obscur: Expedition 33 – All Act 3 optional bosses and where to find them
- Skeet Ulrich Reportedly Set to Return For ‘Scream 7’
2025-01-09 02:48