Ah, Ethereum. The cryptic king of the digital world, perched in its lofty throne, momentarily taking a breather after a meteoric rise in May. Yet, like a firecracker ready to explode, whispers of bullish patterns and Wall Street’s newfound infatuation suggest it’s far from over. Oh yes, the market gods are stirring once again. 💰
As of Thursday, Ethereum (ETH) was prancing around a humble $2,630. An unremarkable price, one might say, until you remember that it’s a staggering 90% above its lowest dip earlier this year. Talk about a glow-up, eh? 😎
And what do the Wall Street moguls have to say about this? Oh, they’re buying—oh yes, they’re buying. Spot Ethereum ETFs are being scooped up like rare art pieces at a Sotheby’s auction. Just on Wednesday, $56.9 million poured into these little digital treasures, marking the 13th day in a row of this unholy streak. A blessed trio of months of consistent inflows. Wall Street loves a good trend, don’t they? 💵
And Ethereum, bless its blockchain heart, hasn’t been slacking off. It has ascended to the throne of real-world assets like some kind of digital monarch. The latest stats tell us that Ethereum now hosts over $7.375 billion of the $23 billion Real World Asset (RWA) market, easily outpacing the likes of ZKsync Era, Stellar, and Solana. Bow down, peasants! 👑
Not only that, but Ethereum is also playing the role of the biggest and baddest in the stablecoin game, with a whooping $129 billion in assets. Tron, Solana, and Arbitrum—well, they can just watch from the sidelines. Ethereum’s reign is not just limited to one industry either. Tokenized treasuries, private credit—ETH has its hand in it all. 🍸
And let’s not forget decentralized finance, where Ethereum sits as the emperor of all it surveys, with over $133 billion locked in total value. A market dominance of 62% that no other chain can touch, not even Solana or Tron. It’s a digital monopoly, darling. 😏
Ethereum Price Technical Analysis
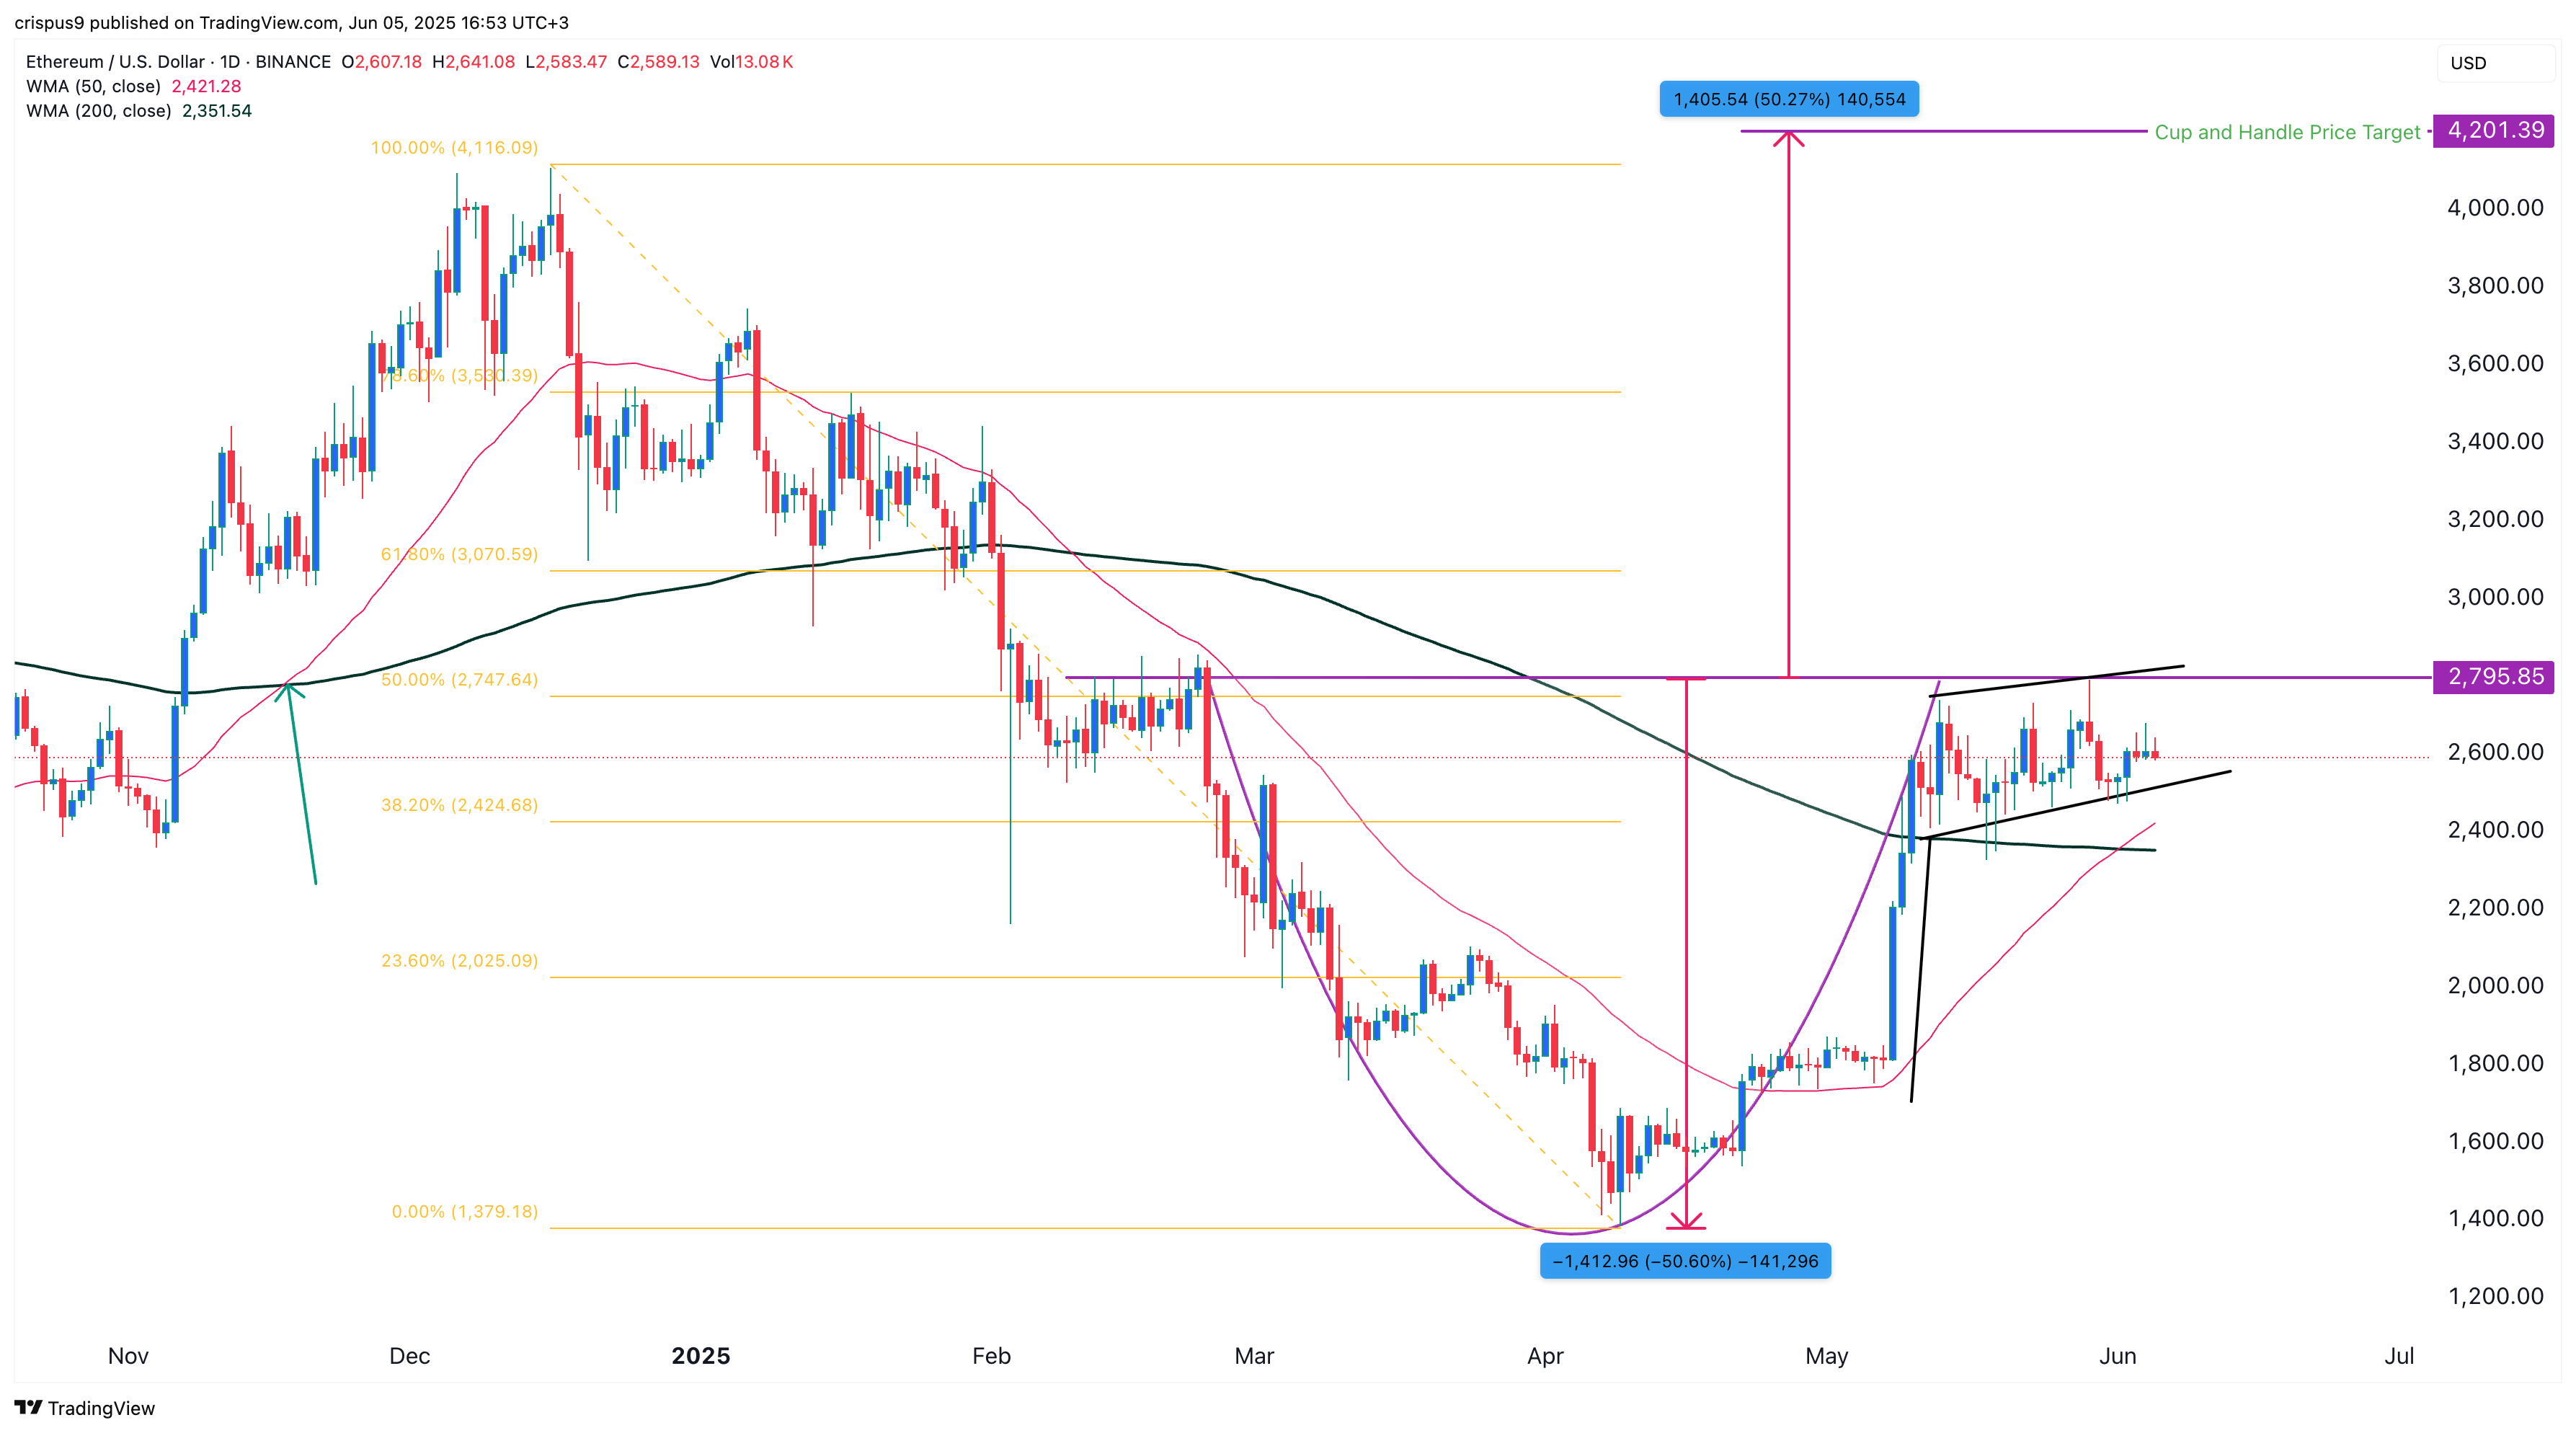
Now, let’s peek at the charts, shall we? The daily chart, like a seasoned fortune teller, is whispering of bullish patterns that suggest an inevitable rebound. First, behold the cup and handle formation. The cup’s upper boundary is shyly nestled near $2,795, right in line with the 50% Fibonacci retracement. A depth of 50%, how elegant! Now, Ethereum is in the process of forming the handle—ah, the suspense! 🍷
But wait—there’s more! The 50-day and 200-day weighted moving averages have crossed paths in what can only be described as a golden cross formation. The last time this occurred, ETH surged nearly 40%. History, darling, is repeating itself. 📈
And lastly, we have the bullish flag pattern. A mighty vertical rally followed by a consolidation phase that resembles a flag fluttering triumphantly in the breeze. Can you feel the excitement? 🌟
Read More
- Apothecary Diaries Ch.81: Maomao vs Shenmei!
- 30 Best Couple/Wife Swap Movies You Need to See
- Gachiakuta Chapter 139: Rudo And Enjin Team Up Against Mymo—Recap, Release Date, Where To Read And More
- Gold Rate Forecast
- Every Minecraft update ranked from worst to best
- Netflix’s ‘You’ Season 5 Release Update Has Fans Worried
- Mobile MOBA Games Ranked 2025 – Options After the MLBB Ban
- Batman and Deadpool Unite: Epic DC/Marvel Crossover One-Shots Coming Soon!
- Who was Peter Kwong? Learn as Big Trouble in Little China and The Golden Child Actor Dies at 73
- Ncuti Gatwa Exits Doctor Who Amidst Controversy and Ratings Crisis!
2025-06-05 17:35