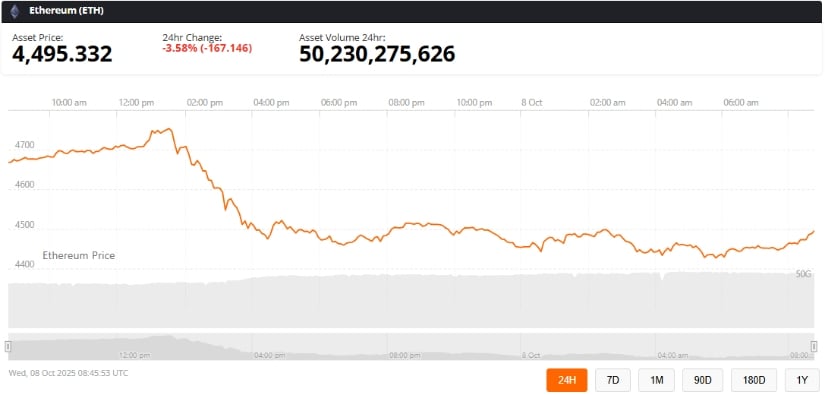
So, Ethereum (ETH) is lounging around $4,495 today, acting all cool and collected despite the market’s emotional rollercoaster. 🌪️ Analysts-those modern-day soothsayers-are whispering that this setup smells suspiciously like the prelude to a wild rally. Institutional money is flowing in like it’s an open bar, technical charts are flexing their muscles, and on-chain activity is buzzing like a caffeine-addled bee. 🐝 Could Ethereum be gearing up for its next big *ta-da* moment? Spoiler alert: probably.
Golden Cross: The Crypto Prom King 👑
Ethereum just busted out a golden cross on its 3-day chart-basically, the 50-period moving average waltzed past the 200-period one like it owned the place. 💃 Analysts are interpreting this as a bullish mic drop, though let’s be real, these patterns are about as reliable as a weather forecast in April. 🌧️
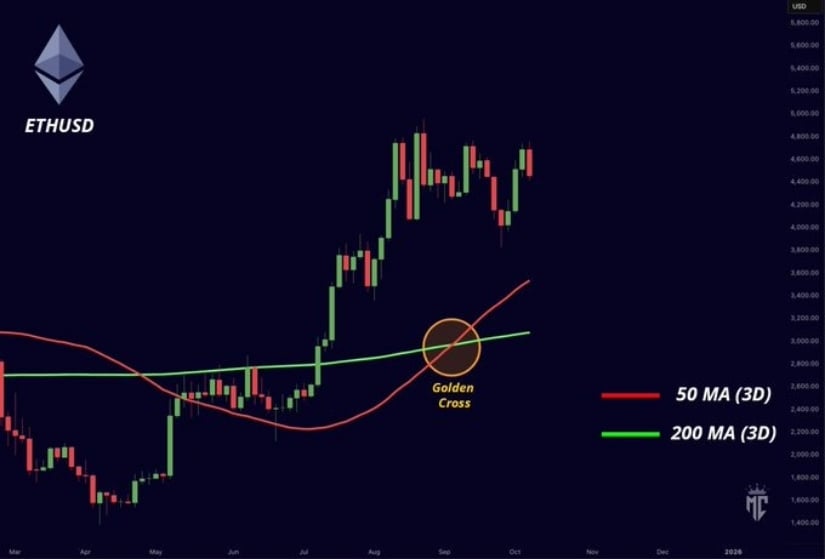
Mister Crypto-yes, that’s his name-took to X (formerly Twitter, because why not?) to declare, “Golden cross on $ETH. What comes next is obvious!” 🧙♂️ Historically, this move has been the opening act for some serious rallies. After a similar crossover in 2020, Ethereum outshone Bitcoin by 250%. Eat your heart out, BTC. 💔
But let’s not get too starry-eyed. Golden crosses have been known to ghost us during volatile times, especially when the macro gods are in a mood. 🤷♂️
Logarithmic Trendline: The $9K Crystal Ball 🔮
Now, let’s talk about the real star of the show: a logarithmic trendline that’s been calling Ethereum’s tops since 2017. ZYN (@Zynweb3) pointed out that “every ETH top has happened when it touched this trendline,” which-if it holds-could send ETH to $9,000 by mid-2026. 🚀
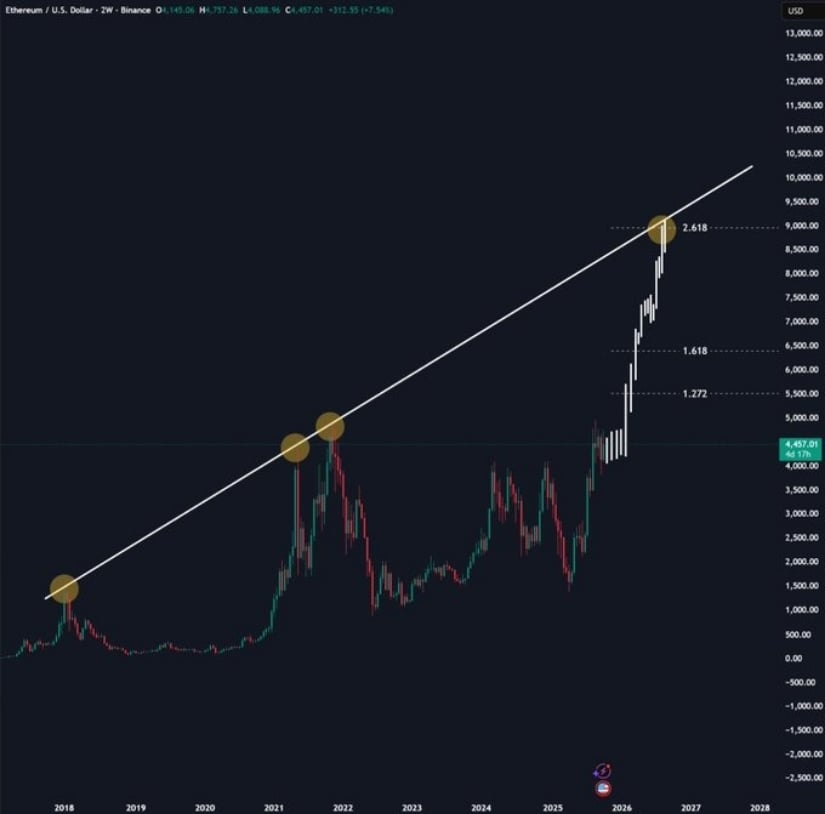
At $4,495, Ethereum’s still got some legwork to do before hitting this resistance band. But hey, this trendline’s track record is better than my dating history, so maybe it’s worth listening to. 📈
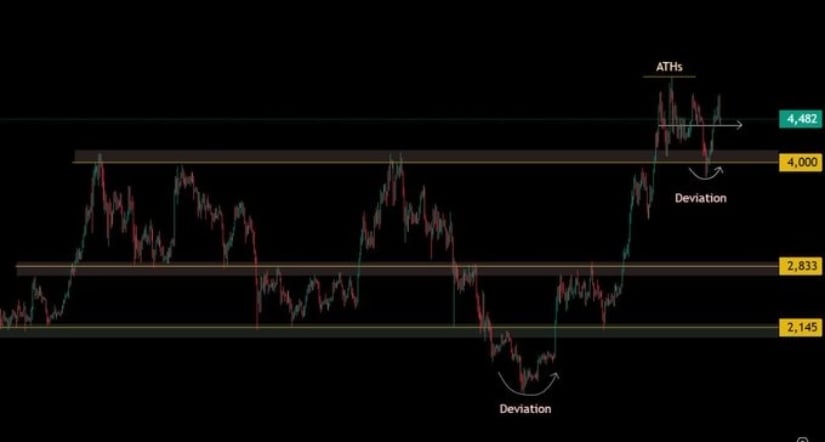
The $5K Resistance: Crypto’s Velvet Rope 🎟️
Ethereum’s currently chilling below the $5,000 resistance zone, a level that once marked its all-time high in November 2021. Mando CT (@XMaximist) predicts that once ETH breaks through, “capital will start pouring in like it’s a Black Friday sale.” 🛍️
A breakout above $5K could reignite DeFi’s flame, reminiscent of the 2020-2021 boom when TVL skyrocketed from $1 billion to $250 billion. But let’s not forget: technical indicators are like horoscopes-fun to read, but don’t bet your house on them. 🏠
Institutional Love: ETFs Are the New Black 💼
Ethereum’s also getting some serious side-eye from institutions, thanks to those shiny new ETH ETFs. CoinShares data shows consecutive weeks of net inflows, a stark contrast to the Q3 2025 outflows. 💸 Lower gas fees and layer-2 solutions like Arbitrum and Base are making Ethereum the belle of the blockchain ball. 🌟
Final Thoughts: $9K or Bust? 🚀
So, is Ethereum headed to $9,000? The golden cross, logarithmic trendline, and institutional FOMO say “yes.” But let’s not forget: crypto markets are like a toddler-unpredictable and prone to tantrums. 😈 Short-term dips are likely, but the long-term trajectory looks as solid as my excuse for skipping the gym. 🏋️♂️
If ETH can reclaim its previous all-time high near $4,878, it might just kick off the next crypto frenzy. Until then, grab your popcorn and enjoy the show. 🍿
Read More
- Trading on Thin Air: AI Agents Conquer Crypto Volatility
- 20 Movies Where the Black Villain Was Secretly the Most Popular Character
- Invincible Season 4 Gender Swaps Tech Jacket As Fans Question Major Comic Change
- Silver Rate Forecast
- 22 Films Where the White Protagonist Is Canonically the Sidekick to a Black Lead
- Gold Rate Forecast
- 15 Films That Were Shot Entirely on Phones
- Trading Smarter: AI-Powered Execution Schedules
- Celebs Who Narrowly Escaped The 9/11 Attacks
- Smarter Order Execution: How AI is Outperforming Wall Street’s Playbook
2025-10-08 16:09