Ethereum price has continued to trade under pressure in late January 2026, and it’s giving off that vibe of being stuck in a lift with questionable Wi‑Fi: all the macro factors swirling, investors being suspiciously cautious, and volatility doing high kicks in the corner. That’s the vibe, anyway. On-chain data shows leverage hitting record highs while overall exposure pools-like a bad decision at a party-are shrinking. Fancy that: more leverage, less crowd noise, and everyone pretending this isn’t exactly how you lose the keys to the candy store.
Ethereum Price Faces a Structural Shift in Derivatives Behavior
From a derivatives perspective, Ethereum price dynamics are increasingly shaped by leverage concentration rather than broad participation. Binance data shows the Estimated Leverage Ratio climbing to a new all-time high near 0.675, the highest level ever recorded for this metric.
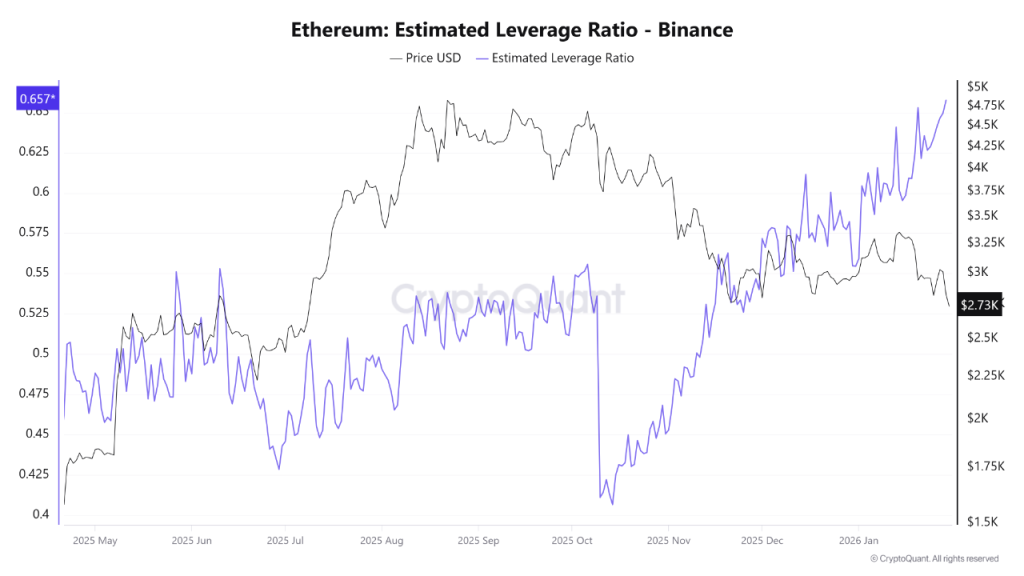
This development stands out because it has emerged without a decisive bullish breakout. Ethereum price has hovered around $2,700 for extended periods, suggesting traders are deploying leverage to extract returns from relatively narrow price movements rather than committing fresh capital to long-duration bets.
Historically, leverage ratios approaching the 0.70 level have coincided with heightened sensitivity to volatility. In such environments, even moderate price fluctuations can trigger outsized liquidations, making Ethereum price action more fragile than headline levels may imply.
Open Interest Declines as Exposure Contracts
At the same time, Ethereum onchain chart data from derivatives markets paints a contrasting picture. Per CryptoQuant insights, its total open interest has fallen to roughly $16.4 billion, marking its lowest reading since November. This decline signals a broad reduction in the number of outstanding contracts rather than an expansion of market participation.
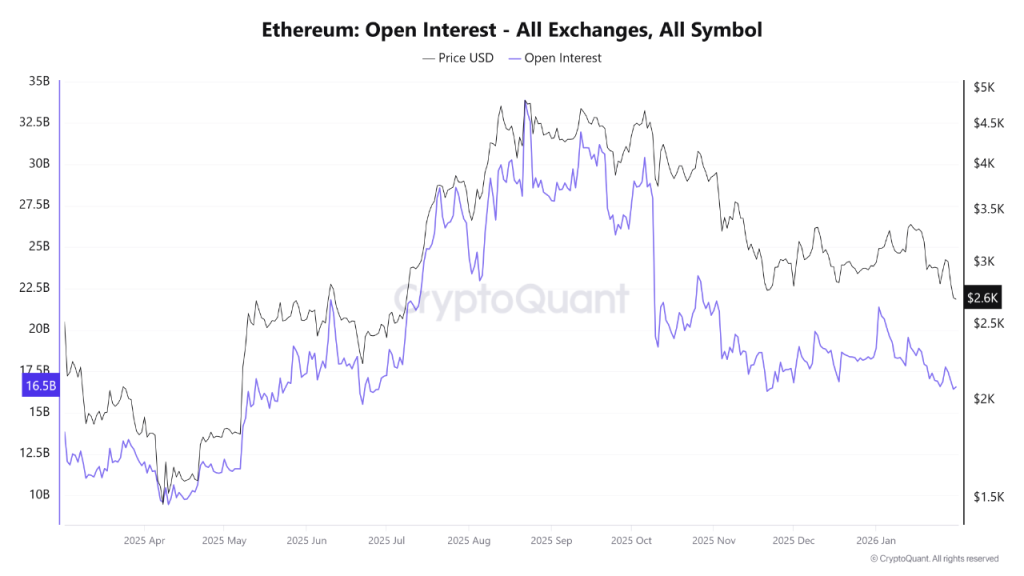
In practical terms, fewer positions remain active across futures and perpetual markets. However, those positions that do remain are increasingly leveraged. This divergence suggests a market undergoing repositioning instead of accumulation.
From an Ethereum price analysis standpoint, declining open interest typically reduces directional conviction. When paired with rising leverage ratios, it creates an environment where liquidity becomes thinner and price reactions sharper.
Ethereum Price Chart Highlights Key Technical Stress Zones
Still, price structure remains a central reference. The Ethereum price chart shows a sharp decline toward 200-day EMA band.
$ETH Longterm buy between 1900 – 1700
– UNKNOWN TRADER (@Learnernoearner) January 30, 2026
It suggests that if demand comes, it can reverse its decline, but if it breaks the 200-day EMA band, then horizontal support zones around $1,900 and $1,713 could be retested.
Read More
- Invincible Season 4 Gender Swaps Tech Jacket As Fans Question Major Comic Change
- Silver Rate Forecast
- Gold Rate Forecast
- 15 Films That Were Shot Entirely on Phones
- 22 Films Where the White Protagonist Is Canonically the Sidekick to a Black Lead
- Building Agents That Learn and Improve Themselves
- 20 Movies Where the Black Villain Was Secretly the Most Popular Character
- Celebs Who Narrowly Escaped The 9/11 Attacks
- Trading Crypto with AI: A New Approach to Portfolio Management
- 18 TV Series Filming Rehearsals as Bonus Content
2026-01-31 18:52