Author: Denis Avetisyan
New research explores how artificial intelligence can refine the analysis of prediction markets by identifying truly meaningful relationships between events.
This paper demonstrates that large language models can improve lead-lag trading strategies in prediction markets by filtering statistically weak connections and prioritizing those supported by plausible economic reasoning.
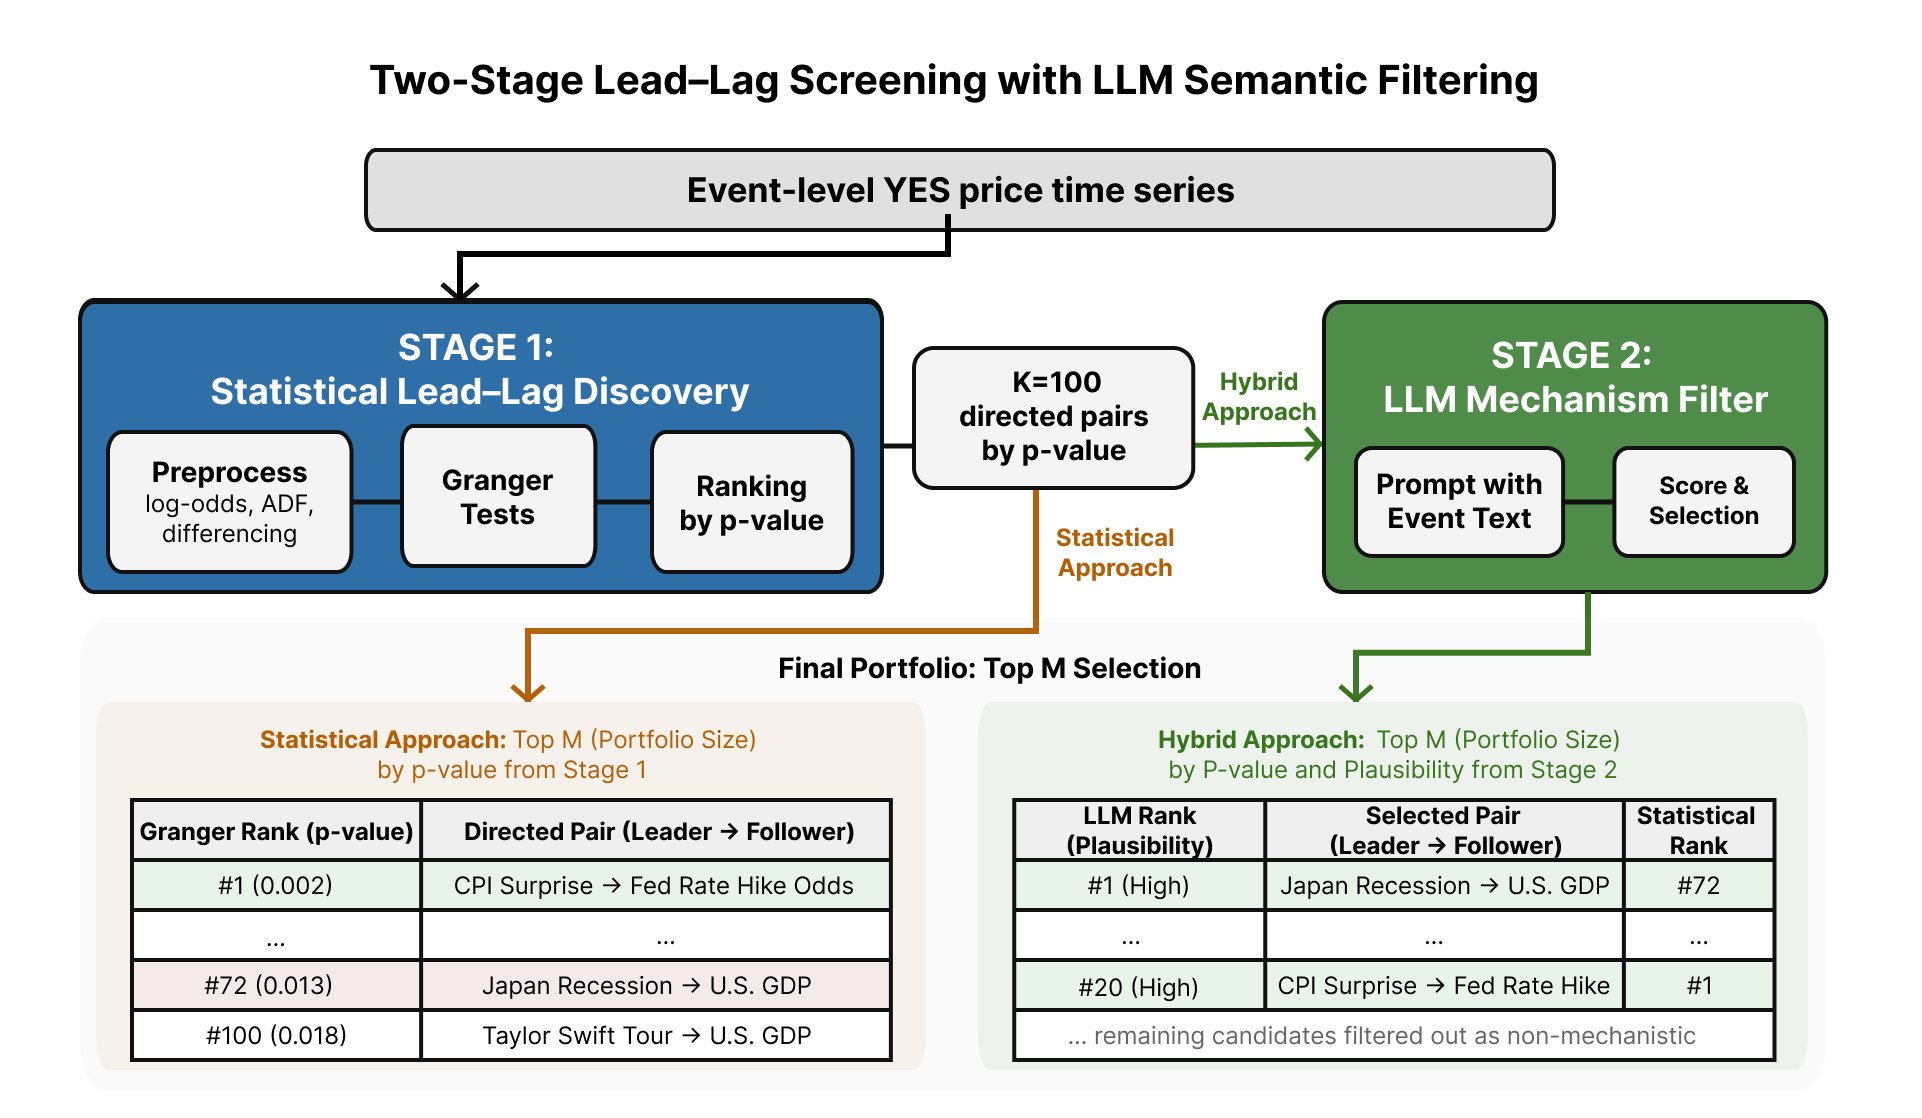
Identifying robust relationships within noisy time series data remains a persistent challenge in quantitative analysis, particularly in prediction markets where event-driven probabilities are subject to spurious correlations. This is addressed in ‘LLM as a Risk Manager: LLM Semantic Filtering for Lead-Lag Trading in Prediction Markets’, which proposes a hybrid approach combining Granger causality with large language model (LLM) semantic filtering to prioritize lead-lag relationships supported by plausible economic mechanisms. Results demonstrate that this LLM-enhanced screening process not only improves trading win rates but, critically, reduces the magnitude of potential losses by identifying statistically fragile links. Could this signal a broader role for LLMs as semantic risk managers, capable of bolstering the reliability of time series-based strategies across diverse domains?
Decoding the Noise: Prediction Markets as Signals, Not Oracles
Prediction markets, functioning as collective intelligence systems, continuously generate detailed time series data centered around specific events – a granularity rarely found in traditional economic indicators. This event-level resolution creates a uniquely rich dataset, allowing researchers to examine not just whether a market predicts an outcome, but how its behavior evolves in the lead-up to that outcome. The continuous flow of trades, prices, and volumes associated with each event offers a high-frequency record of collective belief, potentially revealing subtle shifts in sentiment that precede real-world developments. Consequently, these markets present exceptional opportunities to pinpoint leading indicators – early signals within the market data that consistently foreshadow the eventual resolution of an event, going beyond simple predictive accuracy to offer insight into the mechanisms of collective forecasting.
Analyzing time series data from prediction markets presents a significant challenge for conventional statistical techniques. The sheer volume of interconnected events, coupled with the inherent noise in collective forecasting, often leads to the identification of numerous correlations – many of which are entirely coincidental. Standard methods, like simple regression or autocorrelation, struggle to differentiate between genuine lead-lag relationships, where one event reliably precedes and influences another, and spurious correlations arising from shared trends or random chance. This difficulty stems from the complex, non-linear dynamics at play within these markets, where subtle shifts in belief can propagate rapidly, obscuring true causal links. Consequently, models built upon these flawed correlations can exhibit limited predictive power and fail to generalize to new scenarios, highlighting the need for more sophisticated analytical tools capable of discerning signal from noise.
The capacity to discern genuine predictive relationships within prediction market data is paramount for constructing models that consistently outperform chance. Robust forecasting isn’t simply about identifying any correlation, but establishing which variables reliably precede and influence future outcomes; spurious connections can lead to flawed strategies and inaccurate projections. This accurate signal detection unlocks the potential for improved risk assessment, optimized resource allocation, and, ultimately, more effective decision-making across a variety of domains – from financial forecasting and policy analysis to supply chain management and even anticipating shifts in public opinion. A model built on these validated lead-lag relationships offers not just prediction, but a degree of confidence in navigating uncertain futures, offering a distinct advantage in competitive environments.
Statistical Footprints: Hunting for Predictive Precedence
Granger causality, formally known as Granger causality analysis, is a statistical hypothesis test used to determine if one time series is useful in forecasting another. The method assesses whether past values of time series X can significantly improve the prediction of current values of time series Y, beyond what is already predictable from Y’s own past values. It does not imply true causality in the philosophical sense, but rather predictive precedence; if X “Granger-causes” Y, then X’s past values contain statistically significant information about future values of Y. The test is performed using a regression framework, often employing F-tests to evaluate the joint significance of lagged values of the potential causal variable. Results are interpreted based on a pre-defined significance level (e.g., α = 0.05), indicating whether the improvement in predictive power is statistically significant.
Granger causality analysis relies on the assumption of stationarity in the time series data; non-stationary series exhibit trends or seasonality that can lead to spurious regression results and invalidate the causality tests. To address this, preprocessing techniques are frequently employed, with differencing being a common method. Differencing involves calculating the difference between consecutive observations in a time series, effectively removing trends and, in some cases, seasonality. First-order differencing, \Delta X_t = X_t - X_{t-1} , is often sufficient, but higher-order differencing may be required for more complex non-stationarity. Following differencing, statistical tests, such as the Augmented Dickey-Fuller (ADF) test, are used to verify that the resulting series are indeed stationary before proceeding with Granger causality analysis.
Vector Autoregressive (VAR) models are multivariate time series models used to capture the linear interdependencies among multiple variables. Unlike univariate models which predict a single variable based on its past values, VAR models treat each variable as a linear function of its own past values and the past values of all other variables included in the model. Formally, a VAR model of order p, denoted VAR(p), includes past p values of each variable as predictors. This allows for the simultaneous modeling of multiple time series and is essential for Granger causality tests, as the VAR framework provides the necessary structure to assess whether the past values of one time series can statistically significantly improve the prediction of another, thereby indicating a potential causal relationship.
Beyond the Numbers: Injecting Logic into the Forecast
The methodology employs a two-stage process, initially leveraging statistical screening techniques to identify potential lead-lag relationships within datasets. This statistical analysis serves as a broad-net approach, efficiently pinpointing correlations regardless of underlying causal mechanisms. Subsequently, Large Language Models (LLMs) are integrated to assess the contextual plausibility of these statistically identified relationships. This pairing allows for the combination of computational efficiency with nuanced reasoning, enabling validation beyond purely quantitative measures and improving the reliability of identified connections.
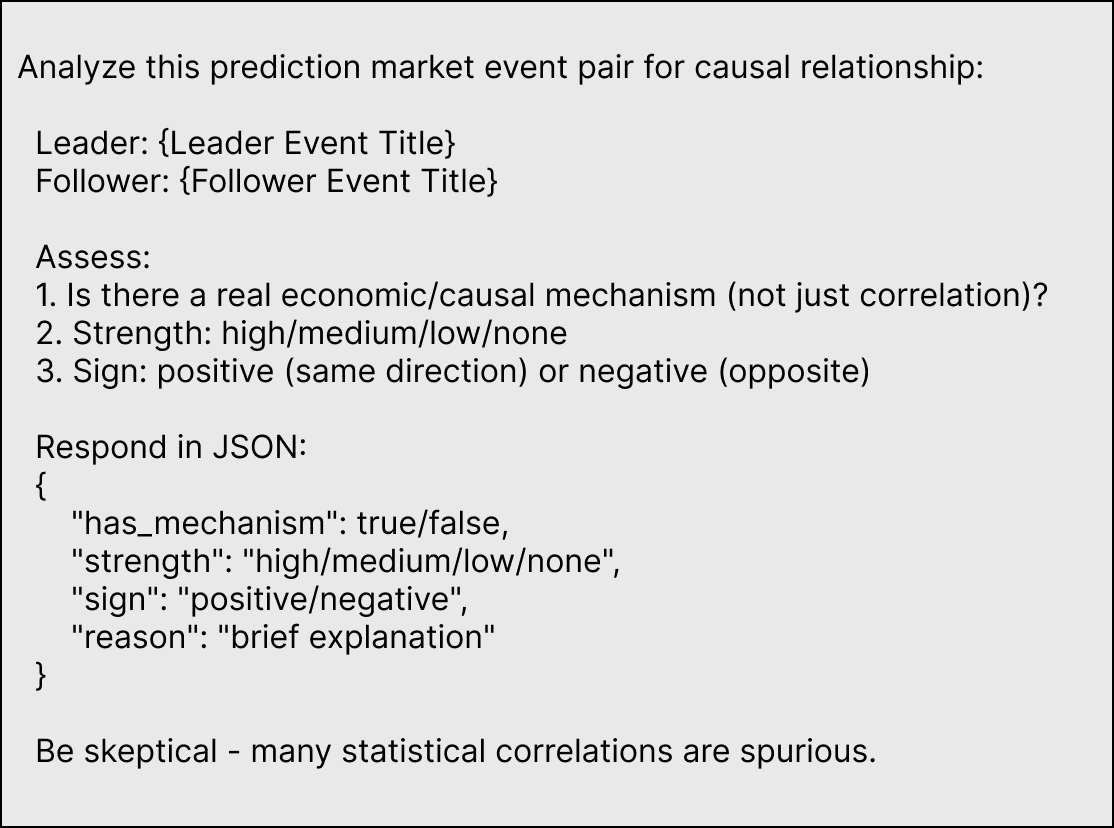
Large Language Models (LLMs) are implemented to assess the logical coherence of lead-lag relationships initially identified through statistical analysis. This process involves presenting the LLM with the identified temporal dependencies – where one variable consistently precedes another – along with relevant contextual information. The LLM then evaluates whether a plausible causal or mechanistic link exists to explain the observed sequence. Relationships lacking such a logical justification are flagged as potentially spurious, and subsequently filtered from the dataset. This filtering step reduces the risk of incorporating false positives into the final model, improving predictive accuracy and interpretability by focusing on relationships grounded in reasonable explanations.
The integration of statistical analysis with logical reasoning, facilitated by Large Language Models (LLMs), addresses a key limitation of purely statistical methods: the potential identification of spurious correlations. While statistical screening can reliably detect associations between variables, it cannot inherently determine causality or plausibility. LLMs provide a contextual layer by evaluating whether a statistically significant lead-lag relationship aligns with established domain knowledge and logical inference. This validation process doesn’t merely confirm if a model predicts well, but why, enhancing interpretability – a critical advantage when deploying models in fields where understanding causal links is paramount. By cross-referencing statistical outputs with the LLM’s vast knowledge base, researchers can identify illogical predictions, ultimately building more robust and reliable models.
The Proof is in the Prediction: Rigorous Evaluation and Gains
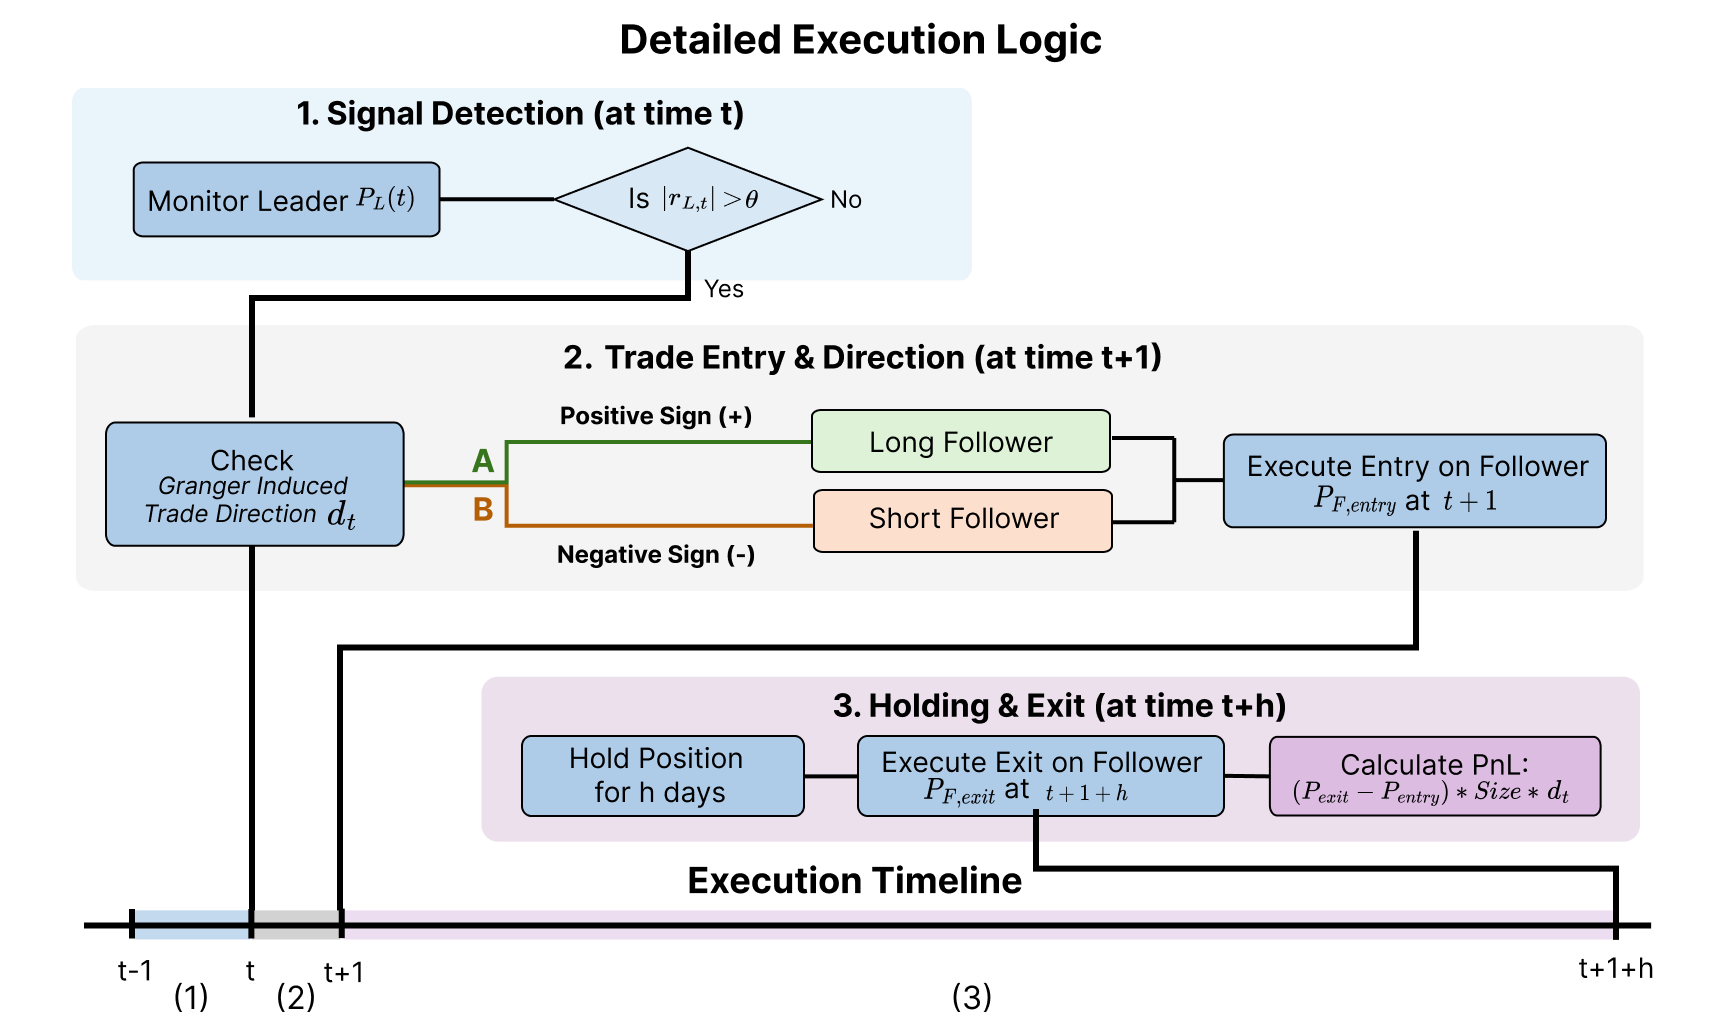
Rolling evaluation was implemented to rigorously assess the out-of-sample predictive performance of the hybrid approach. This technique involved iteratively training the model on a historical window of data and then testing its performance on a subsequent, unseen window. The window was then advanced forward in time, and the process repeated multiple times. This methodology provides a more robust estimate of generalization ability than a single train/test split, as it accounts for potential shifts in data distributions over time and avoids overfitting to a specific historical period. The use of rolling evaluation ensured that reported performance metrics accurately reflect the model’s ability to predict future outcomes based on past data, and enabled a reliable comparison against baseline statistical signals.
Analysis of backtesting results indicates a 205% improvement in Total Profit and Loss (PnL) when incorporating lead-lag relationships validated by Large Language Models (LLMs). This substantial gain was observed through a rolling evaluation process designed to assess out-of-sample predictive performance. The methodology involved identifying potential lead-lag relationships and using LLMs to confirm their plausibility before incorporating them into the trading strategy. The resulting increase in PnL demonstrates the effectiveness of leveraging LLM validation to enhance the profitability of statistically derived trading signals.
Analysis of the hybrid approach demonstrates a significant reduction in downside risk, with Average Loss Magnitude decreasing by 46.5% when compared to strategies based solely on statistical signals. This metric, calculated across the entire test dataset, indicates a substantial improvement in the system’s ability to limit potential losses. The observed reduction is not attributable to a decrease in winning trade size; rather, it reflects a more effective curtailment of losses during unfavorable market conditions. This risk mitigation is a key component of the overall performance gains achieved through the incorporation of LLM-validated lead-lag relationships.
Analysis of Average Loss Magnitude across various event pairs and holding periods consistently demonstrated risk mitigation benefits. Reductions in Average Loss Magnitude ranged from 22.6% to 48.1%, indicating that the LLM-validated lead-lag approach provided consistent downside protection regardless of the specific assets analyzed or the duration of the holding period. This consistent performance across diverse parameters supports the robustness of the methodology in reducing potential losses.
Beyond the Algorithm: Implications and Future Directions
The convergence of statistical forecasting with large language model validation extends far beyond the initial application of prediction markets. This hybrid methodology holds considerable promise for enhancing predictive capabilities across diverse, data-rich fields. In finance, it can refine risk assessment and portfolio optimization by identifying spurious correlations that might mislead traditional models. Economists can leverage this approach to improve forecasting of key indicators, such as inflation or unemployment, by grounding statistical relationships in contextual understanding. Similarly, supply chain management stands to benefit from more accurate demand forecasting and disruption prediction, allowing for proactive mitigation of potential bottlenecks. The ability to not just predict what will happen, but to assess why, represents a significant advancement with ramifications for strategic decision-making in any complex system reliant on accurate foresight.
The integration of Large Language Models (LLMs) offers a novel method for strengthening predictive models within intricate systems by verifying the underlying statistical relationships. Traditionally, model accuracy is assessed through quantitative metrics; however, LLMs introduce a qualitative layer, evaluating whether the identified correlations align with established domain knowledge and logical inference. This validation process doesn’t merely confirm if a model predicts well, but why, enhancing interpretability – a critical advantage when deploying models in fields like finance or supply chain management where understanding causal links is paramount. By cross-referencing statistical outputs with the LLM’s vast knowledge base, researchers can identify spurious correlations or illogical predictions, ultimately building more robust and reliable models capable of navigating the complexities of real-world scenarios. The technique promises to move beyond ‘black box’ predictions towards transparent and justifiable insights.
Ongoing research prioritizes a more nuanced evaluation of the large language models used for validating statistical relationships, aiming to move beyond simple accuracy metrics to assess the reasoning behind their assessments. This includes exploring techniques to quantify the LLM’s confidence and identify potential biases in its judgment. Simultaneously, the methodology is being scaled to accommodate datasets of increasing size and complexity, such as those found in macroeconomic modeling and global logistics networks. Successfully applying this hybrid approach to these larger systems promises not only improved predictive accuracy but also a deeper understanding of the underlying factors driving complex phenomena, potentially revealing previously hidden connections and vulnerabilities.
The pursuit of identifying genuine causal relationships within prediction markets, as detailed in this work, feels… predictably cyclical. It’s almost quaint, really, to believe a Large Language Model will finally untangle the mess of event correlations. The paper champions LLMs for filtering statistically fragile links, prioritizing those with economic plausibility – a noble goal. But one suspects that today’s ‘robust’ connection, diligently vetted by an LLM, will become tomorrow’s spurious correlation, exposed by the next market anomaly. As Henry David Thoreau observed, “It is not enough to be busy; so are the ants.” All this sophisticated filtering simply buys a little time before production, inevitably, finds a way to break the elegantly theorized system. The Granger Causality tests are just a new coat of paint on an age-old problem.
Sooner or Later, It Breaks
The pursuit of causal inference in prediction markets, even when aided by large language models, remains fundamentally a matter of narrowing the field of likely failures. This work identifies a method for filtering spurious correlations, which is useful, but it merely delays the inevitable discovery that even ‘plausible economic mechanisms’ are built on assumptions which will, at some point, prove spectacularly wrong. The system will eventually encounter a black swan event, or, more likely, a series of small, irritating inconsistencies that accumulate until the entire model requires a rebuild. If a system crashes consistently, at least it’s predictable.
Future research will undoubtedly focus on ‘explainable AI’-a euphemism for ‘help us understand why this mess is happening.’ The challenge isn’t finding correlations; it’s surviving the production environment. Scaling these models to encompass a wider range of events and markets will only amplify the noise, requiring ever more sophisticated filtering – a Sisyphean task, really. One suspects ‘cloud-native’ solutions will be pitched as the answer, which is just the same mess, but more expensive.
Ultimately, this line of work is not about building perfect predictors. It’s about writing increasingly detailed notes for digital archaeologists. They’ll be the ones sifting through the wreckage, trying to understand why anyone thought this would work in the first place. And they’ll probably find the same biases and assumptions that plague every other attempt at automated decision-making.
Original article: https://arxiv.org/pdf/2602.07048.pdf
Contact the author: https://www.linkedin.com/in/avetisyan/
See also:
- 20 Movies Where the Black Villain Was Secretly the Most Popular Character
- Top 20 Dinosaur Movies, Ranked
- Silver Rate Forecast
- Can AI Lie with a Picture? Detecting Deception in Multimodal Models
- 25 “Woke” Films That Used Black Trauma to Humanize White Leads
- 22 Films Where the White Protagonist Is Canonically the Sidekick to a Black Lead
- Top 10 Coolest Things About Invincible (Mark Grayson)
- When AI Teams Cheat: Lessons from Human Collusion
- From Bids to Best Policies: Smarter Auto-Bidding with Generative AI
- Unmasking falsehoods: A New Approach to AI Truthfulness
2026-02-10 17:51