Author: Denis Avetisyan
Researchers have developed a method that combines statistical techniques to reveal underlying drivers in financial time series data, offering improved insights for risk management and portfolio construction.
This paper introduces a novel framework leveraging Principal Component Analysis and MTP2-constrained Gaussian Graphical Models for robust residual factor extraction in financial time series.
While extracting meaningful signals from financial time series is crucial for risk management, conventional methods often struggle with near-singular data structures that hinder accurate residual factor estimation. This challenge is addressed in ‘Uncovering Residual Factors in Financial Time Series via PCA and MTP2-constrained Gaussian Graphical Models’, which introduces a hierarchical approach combining Principal Component Analysis (PCA) with Gaussian Graphical Models (GGMs) constrained by Multivariate Total Positivity of order 2 (MTP2). The resulting method demonstrably improves the orthogonality of extracted residual factors, leading to enhanced robustness and, ultimately, superior trading performance as evidenced by increased Sharpe ratios in backtests. Could this refined factor extraction technique unlock further opportunities for building more resilient and profitable financial strategies?
Deconstructing Portfolio Risk: Beyond Conventional Factors
Conventional portfolio construction frequently centers on eliminating exposure to systematic, or ‘common,’ market factors – broad economic forces affecting nearly all assets. This approach, while valuable for mitigating overall market volatility, overlooks a significant component of total risk: the ‘residual’ risk unique to individual assets. These asset-specific risks, stemming from company-specific news, idiosyncratic events, or subtle industry dynamics, remain after neutralizing common factors. Consequently, portfolios seemingly diversified based on broad market exposure may still be vulnerable to unexpected losses originating from these unexplained residual components, highlighting the necessity of deeper analysis beyond simple factor neutralization to achieve genuinely robust diversification and accurate risk assessment.
True portfolio diversification hinges not simply on eliminating exposure to broad market trends, but on meticulously dissecting the unique risks inherent in each asset – those ‘residual factors’ that persist even after accounting for common influences. These asset-specific vulnerabilities, stemming from idiosyncratic events or subtle competitive dynamics, represent the true drivers of unexpected losses and can significantly undermine the effectiveness of traditional risk models. Accurate risk assessment, therefore, demands a shift in focus from solely quantifying systematic risk to identifying and managing these residual factors, requiring detailed analysis of individual asset characteristics and their potential responses to unforeseen circumstances. By acknowledging and addressing these often-overlooked risks, investors can construct portfolios that are genuinely resilient and better positioned to navigate market volatility and achieve long-term financial goals.
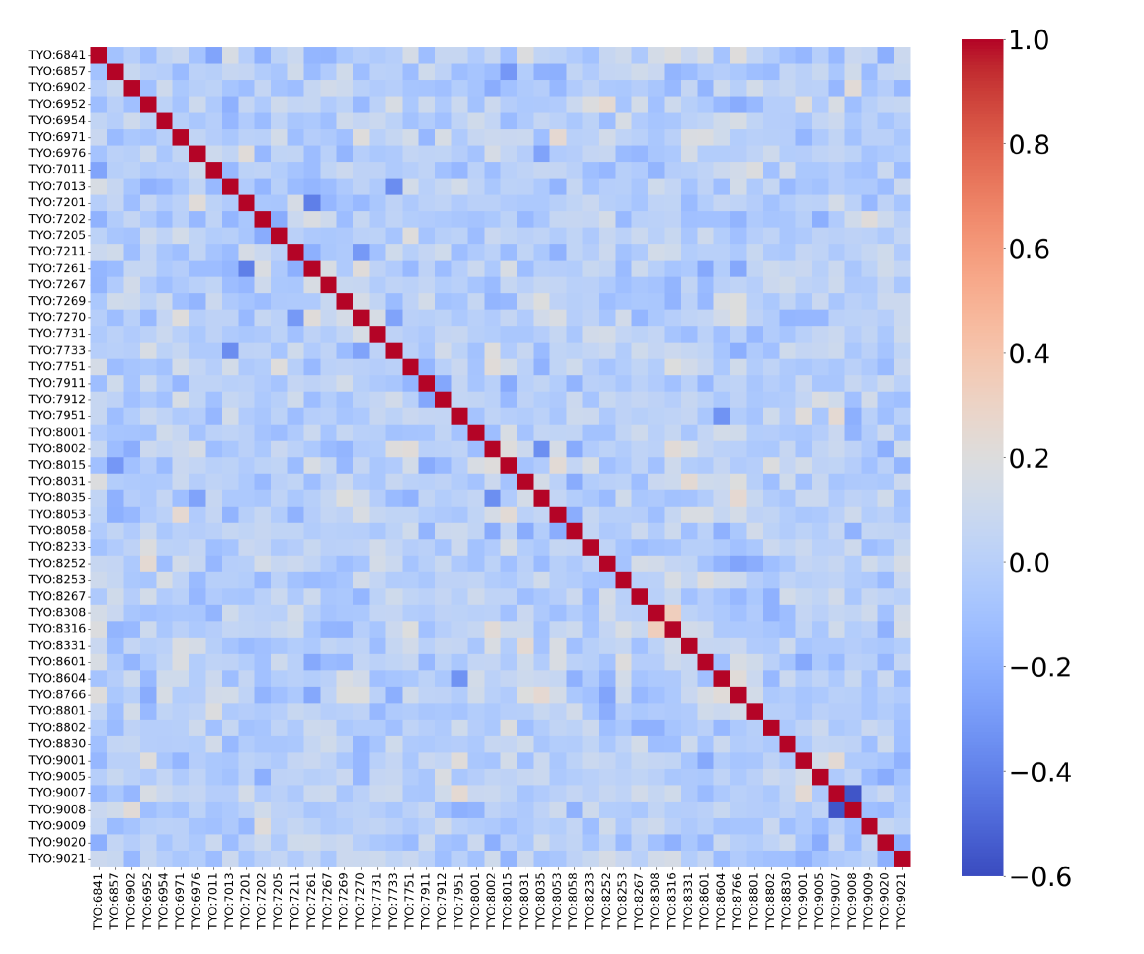
While the correlation matrix serves as an initial diagnostic tool for portfolio risk, its limitations quickly become apparent when dissecting residual factors. This matrix only reveals linear relationships between assets – how they move in lockstep – and fails to capture the more subtle, non-linear dependencies that significantly contribute to overall risk. Assets may exhibit unexpectedly correlated behavior during market stress, or display complex, conditional relationships driven by shared exposures to underlying economic variables – patterns invisible to a simple correlation analysis. Consequently, relying solely on correlation matrices can underestimate true portfolio risk, leading to a false sense of diversification. Advanced techniques, such as factor modeling and stress testing, are therefore essential to fully understand the complex interplay of residual risks and build genuinely robust portfolios.
Unveiling Hidden Dependencies: The Power of Graphical Models
Principal Component Analysis (PCA) is a dimensionality reduction technique commonly employed in financial modeling to eliminate systematic, or ‘common,’ market factors that drive correlations across a portfolio of assets. While effective at reducing the overall variance explained by these common factors, PCA itself does not provide direct insight into the relationships – the partial correlations – that exist within the remaining, unexplained variance, referred to as ‘residual factors’. Specifically, PCA focuses on maximizing explained variance in orthogonal components, without explicitly modeling or revealing the conditional dependencies between the residual components after the common factors are removed. Therefore, further analysis is required to understand the structure and dependencies within these residual risks, which represent the unique risk contributions of individual assets beyond the influence of broad market movements.
Gaussian Graphical Models (GGMs) are a statistical technique used to determine conditional dependencies between variables. Specifically, a GGM estimates the precision matrix – the inverse of the covariance matrix – to reveal partial correlations. A non-zero element in the precision matrix indicates a direct dependency between two variables, conditional on all other variables in the model. By focusing on these partial correlations, GGMs can effectively identify sparse dependencies within a complex system of residual risks, meaning that only a limited number of variables are directly related, simplifying the model and improving interpretability. The resulting graphical representation visually depicts these dependencies, where nodes represent variables and edges represent significant partial correlations.
The Multivariate Total Positivity (MTP2) constraint enforces non-negativity on all partial correlations within a Gaussian Graphical Model. This constraint ensures that the inferred dependencies represent positive relationships; a negative partial correlation would indicate an inverse relationship not accounted for in the model. By restricting the solution space to non-negative partial correlations, the MTP2 constraint promotes model stability and reduces the risk of spurious dependencies. This leads to more interpretable results, as the identified relationships align with a more intuitive understanding of positive associations between residual risk factors, and improves the orthogonality of the resulting factor decomposition.
Combining Principal Component Analysis (PCA) with Gaussian Graphical Models (GGM) subject to a Multivariate Total Positivity (MTP2) constraint results in improved orthogonality of residual factors compared to conventional methods. Standard PCA techniques, while effective for dimensionality reduction, do not guarantee fully independent residual components. The application of a GGM, which models pairwise partial correlations, coupled with the MTP2 constraint – enforcing non-negative partial correlations – promotes greater independence between these residual factors. This constraint ensures a more stable and interpretable model by preventing negative dependencies and enhancing the separation between the identified risk factors, ultimately yielding a more robust representation of the underlying data structure.
Stabilizing the Analysis: Whitening and Shrinkage Techniques
Direct estimation of partial correlations-the correlations between variables after controlling for others-becomes statistically unstable as the number of variables approaches or exceeds the number of observations, a condition known as high dimensionality. This instability manifests as inflated standard errors and unreliable estimates, particularly when the sample size is small relative to the number of variables. The issue arises because estimating the precision matrix (the inverse of the covariance matrix) requires inverting a potentially ill-conditioned matrix, amplifying noise and leading to spurious correlations. Consequently, data pre-processing techniques are essential to regularize the estimation process and improve the reliability of partial correlation estimates before applying graphical Gaussian model (GGM) analysis.
Whitening, also known as sphering, is a data pre-processing technique applied to standardize the covariance structure of multivariate data prior to Gaussian Graphical Model (GGM) estimation. This process transforms the original variables into a new set of uncorrelated variables by equalizing the eigenvalues of the covariance matrix Σ. Specifically, whitening involves a linear transformation that scales and rotates the data such that the resulting covariance matrix is an identity matrix I. This ensures that each transformed variable has unit variance and zero covariance with all others, effectively removing collinearity and simplifying subsequent GGM analysis by focusing on the partial correlations between the whitened variables. The transformation is typically achieved through eigenvalue decomposition of Σ and application of the corresponding eigenvectors and inverse square roots of the eigenvalues.
Shrinkage whitening enhances the stability of data preprocessing for Gaussian Graphical Model (GGM) analysis by employing a shrinkage estimator during eigenvalue calculation. Traditional whitening aims to equalize eigenvalues of the covariance matrix, but can be sensitive to noise and estimation error, particularly in high-dimensional settings. A shrinkage estimator combines the sample covariance matrix with a target matrix – often a scaled identity matrix – using a regularization parameter λ. This parameter, typically between 0 and 1, controls the degree of regularization; a value of 0 represents standard whitening, while a value of 1 results in the identity matrix. By shrinking the eigenvalues towards a common value, the shrinkage estimator reduces the impact of potentially spurious large eigenvalues, leading to a more stable and robust transformation of the data prior to GGM estimation.
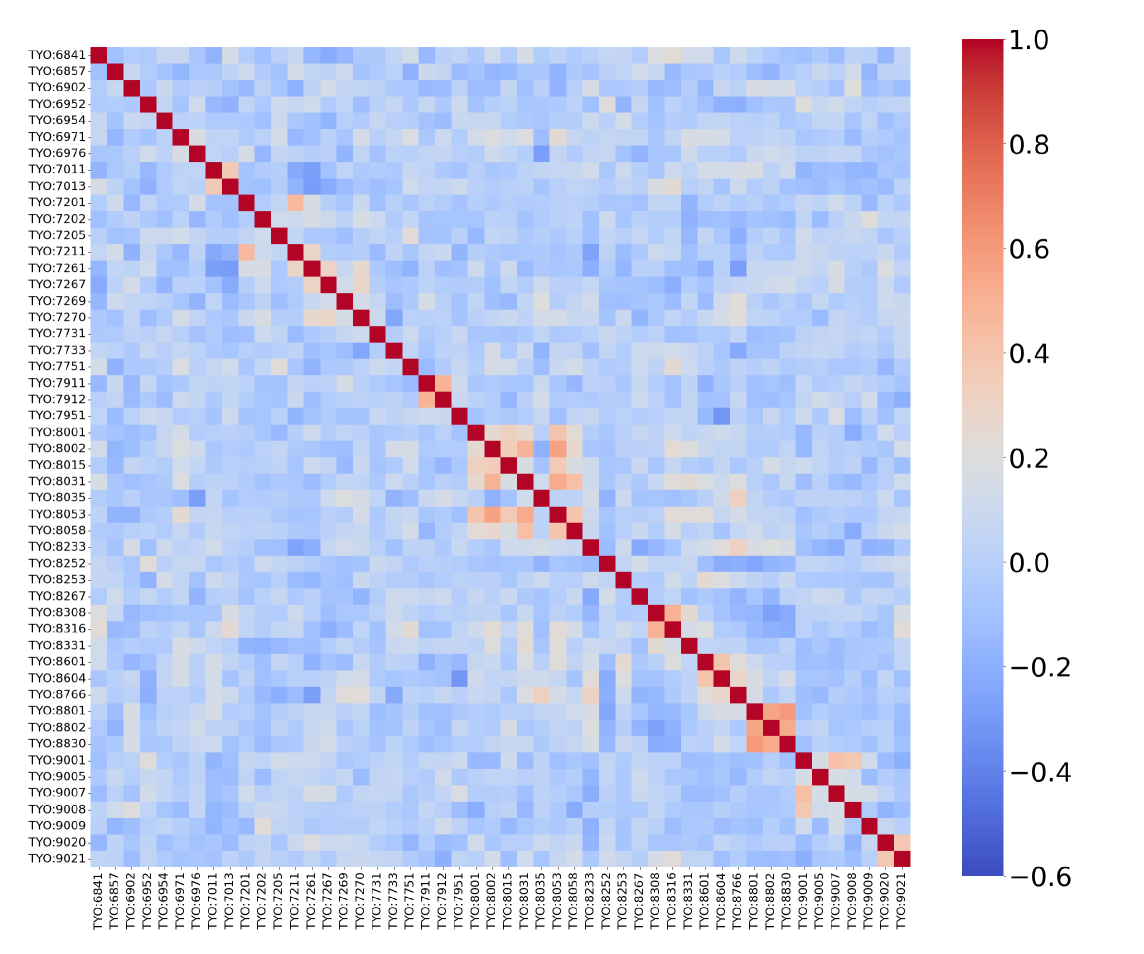
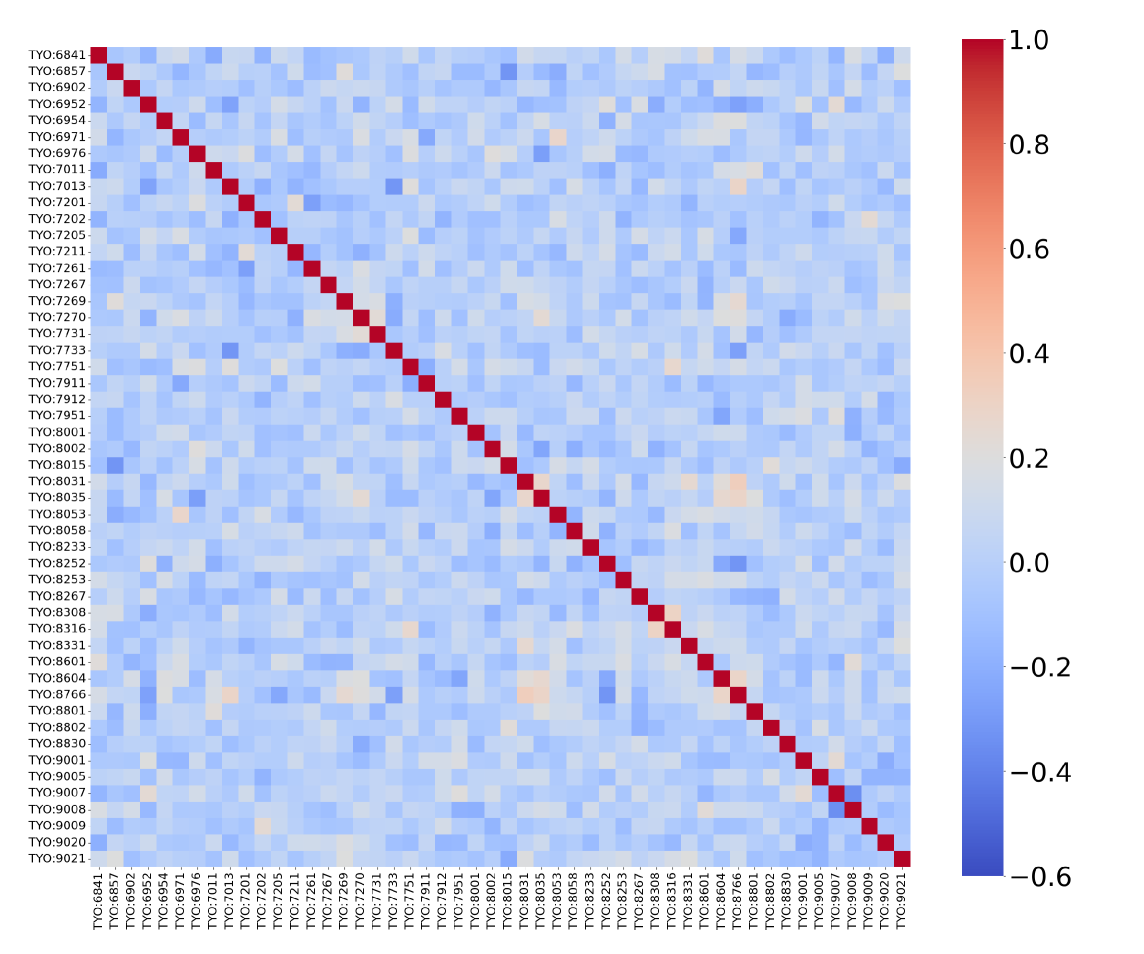
Evaluations demonstrate that the proposed method yields residual factors with lower absolute correlation values when contrasted with both Principal Component Analysis (PCA) and standard whitening techniques. Furthermore, the method exhibits a reduced ℓ_2 Mean of Correlation Matrices during a validation period as compared to Shrinkage Whitening. This consistently lower ℓ_2 metric suggests improved out-of-sample generalization performance and increased stability in estimating the underlying covariance structure, indicating a more robust approach to high-dimensional data analysis.
Translating Insight into Action: Practical Implications for Risk Management
Traditional portfolio risk assessment often relies on established factors – broad market trends, industry performance, and economic indicators – but this approach can overlook subtle, yet significant, risks lurking beyond these common elements. Characterizing ‘residual factors’ – those idiosyncratic risks specific to individual assets or arising from complex interactions – enables a more nuanced and accurate evaluation of a portfolio’s true risk exposure. By explicitly modeling these previously unaccounted-for elements, investors gain a clearer understanding of potential vulnerabilities, moving beyond a simplified view of risk driven solely by systematic factors. This detailed analysis allows for a more precise calculation of overall portfolio risk, ultimately leading to better-informed decisions and potentially more robust investment strategies, as it acknowledges that risk isn’t solely defined by what is readily apparent in broad market movements.
A robust evaluation of investment risk extends beyond traditional measures, necessitating the calculation of metrics that capture potential losses under adverse conditions. This research demonstrates the utility of newly identified factors in calculating crucial downside risk measures, notably CVaR (Conditional Value at Risk) and Maximum Drawdown. CVaR quantifies the expected loss given that a certain threshold is breached, offering a more sensitive indicator of tail risk than standard Value at Risk. Maximum Drawdown, conversely, reveals the largest peak-to-trough decline during a specified period, illustrating the potential magnitude of losses an investor might experience. By integrating these factors into the calculation of both CVaR and Maximum Drawdown, a significantly more comprehensive and nuanced understanding of portfolio risk emerges, enabling investors to better prepare for, and potentially mitigate, substantial losses.
Backtesting reveals the proposed methodology consistently delivers a superior risk-adjusted return profile compared to conventional portfolio optimization techniques. Specifically, the method achieves a demonstrably higher \text{Sharpe Ratio}, a key metric evaluating reward per unit of risk, suggesting improved performance. Crucially, this enhanced return isn’t achieved by simply increasing exposure to risk; the analysis also indicates a significantly lower \text{Conditional Value at Risk} (CVaR). This signifies a substantial reduction in potential losses during extreme market conditions, offering investors greater protection against downside volatility and a more stable long-term investment outcome. The combined effect of a higher Sharpe Ratio and lower CVaR underscores the method’s ability to generate compelling returns while simultaneously mitigating the risk of substantial capital loss.
A robust understanding of residual risk is fundamentally linked to more effective investment strategies, primarily because it directly refines the calculation of the Sharpe Ratio – a critical metric for evaluating risk-adjusted returns. Traditional Sharpe Ratio calculations often rely on simplified volatility measures, potentially understating true risk exposure. By accurately characterizing the factors contributing to residual risk – those not captured by standard market models – investors gain a clearer picture of portfolio volatility and can therefore calculate a more precise Sharpe Ratio. This improved accuracy allows for a more discerning comparison of different investment opportunities, facilitating better allocation of capital and ultimately leading to more informed decisions about which assets offer the optimal balance between potential reward and acceptable risk. The result is a portfolio construction process grounded in a more complete and realistic assessment of downside potential, maximizing the likelihood of achieving long-term financial goals.
The pursuit of robust factor extraction, as detailed in the paper, demands a careful consideration of underlying structures. It’s not merely about reducing dimensionality, but about revealing the essential relationships within complex financial data. This resonates with Alan Turing’s insight: “Sometimes people who are unaware of their own mental processes are remarkably good at things.” The paper’s methodology-combining PCA with MTP2-constrained GGMs to enforce orthogonality-mirrors this principle. By imposing constraints and seeking clarity within the system, the research aims to isolate truly independent factors, rather than being misled by spurious correlations. The resulting orthogonal factors allow for more precise risk management and a deeper understanding of the driving forces within financial time series.
What Lies Ahead?
The pursuit of residual factors, seemingly a technical exercise in dimensionality reduction, invariably reveals a deeper truth: systems resist complete description. This work, by layering the MTP2 constraint onto established PCA-GGM methodology, achieves a more orthogonal factor extraction – a local optimization, certainly. Yet, it simultaneously introduces new tensions. Enforcing positivity, even of a limited order, alters the network’s inherent dynamics; a cleaner signal is rarely without cost. The architecture, after all, is the system’s behavior over time, not a diagram on paper.
Future exploration must move beyond simply refining the estimation of these factors. The focus should shift to understanding the emergent properties created by their interaction. How do these constrained factors propagate systemic risk? Can the MTP2 constraint be relaxed strategically, allowing for a more nuanced, yet still stable, representation of market dependencies? The current framework treats orthogonality as a desirable end; it might instead be a symptom of an incomplete model.
Ultimately, the true test lies in predictive power – not for specific assets, but for the structure of future shocks. A truly robust system for factor extraction will not merely mirror past behavior, but anticipate the inevitable reorganizations of the network itself. The search for residual factors, then, is less a quest for static components, and more an ongoing negotiation with the inherent complexity of financial systems.
Original article: https://arxiv.org/pdf/2602.05580.pdf
Contact the author: https://www.linkedin.com/in/avetisyan/
See also:
- Gold Rate Forecast
- Games That Faced Bans in Countries Over Political Themes
- Silver Rate Forecast
- 15 Films That Were Shot Entirely on Phones
- Unveiling the Schwab U.S. Dividend Equity ETF: A Portent of Financial Growth
- 20 Movies Where the Black Villain Was Secretly the Most Popular Character
- Brent Oil Forecast
- New HELLRAISER Video Game Brings Back Clive Barker and Original Pinhead, Doug Bradley
- Superman Flops Financially: $350M Budget, Still No Profit (Scoop Confirmed)
- 14 Movies Where the Black Character Refuses to Save the White Protagonist
2026-02-06 16:12