Author: Denis Avetisyan
A new system harnesses the power of existing data science work to automatically generate more insightful and relevant exploratory data analysis notebooks for new datasets.
NotebookRAG leverages retrieval-augmented generation and code execution from multiple computational notebooks to improve automated EDA quality and user alignment.
Despite the increasing power of large language models, automated exploratory data analysis remains challenging when user intent is abstract and requires deep analytical knowledge. This paper introduces ‘NotebookRAG: Retrieving Multiple Notebooks to Augment the Generation of EDA Notebooks for Crowd-Wisdom’, a retrieval-augmented generation approach that leverages a corpus of existing computational notebooks to enhance EDA notebook generation. By transforming code cells into executable, context-enriched components, NotebookRAG improves retrieval quality and enables the dynamic generation of updated visualizations and reliable insights. Does this approach unlock a new paradigm for democratizing data analysis and harnessing collective analytical wisdom?
The Inherent Limitations of Manual Data Exploration
Historically, gaining initial insights from data has relied heavily on manual exploratory data analysis, a process wherein analysts meticulously examine datasets through visualizations and summary statistics. This traditional approach, while valuable for nuanced understanding, presents a significant bottleneck in the era of big data; the time required for comprehensive manual investigation can severely limit the pace of discovery. Each step – data cleaning, outlier detection, hypothesis generation – demands considerable human effort, preventing rapid iteration and delaying the translation of raw information into actionable intelligence. Consequently, organizations face challenges in swiftly responding to evolving trends or capitalizing on time-sensitive opportunities hidden within their data assets.
As datasets swell in size and complexity, traditional exploratory data analysis techniques become impractical, necessitating automated approaches to uncover hidden patterns and anomalies. However, simply increasing automation isn’t enough; a significant challenge lies in preserving interpretability. Algorithms can swiftly identify correlations and outliers, but these findings are useless without a clear understanding of why they exist. Researchers are actively developing methods to ensure automated EDA not only processes vast amounts of data, but also presents its findings in a manner that is readily understandable to domain experts, avoiding the creation of ‘black box’ insights. The goal is to move beyond simply detecting patterns to explaining them, enabling informed decision-making and genuine data-driven discovery.
Automated Exploration: A Framework for Logical Deduction
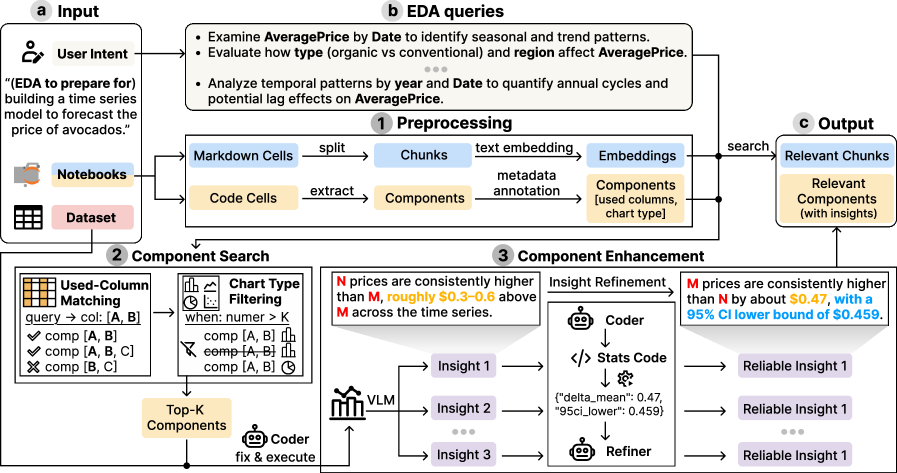
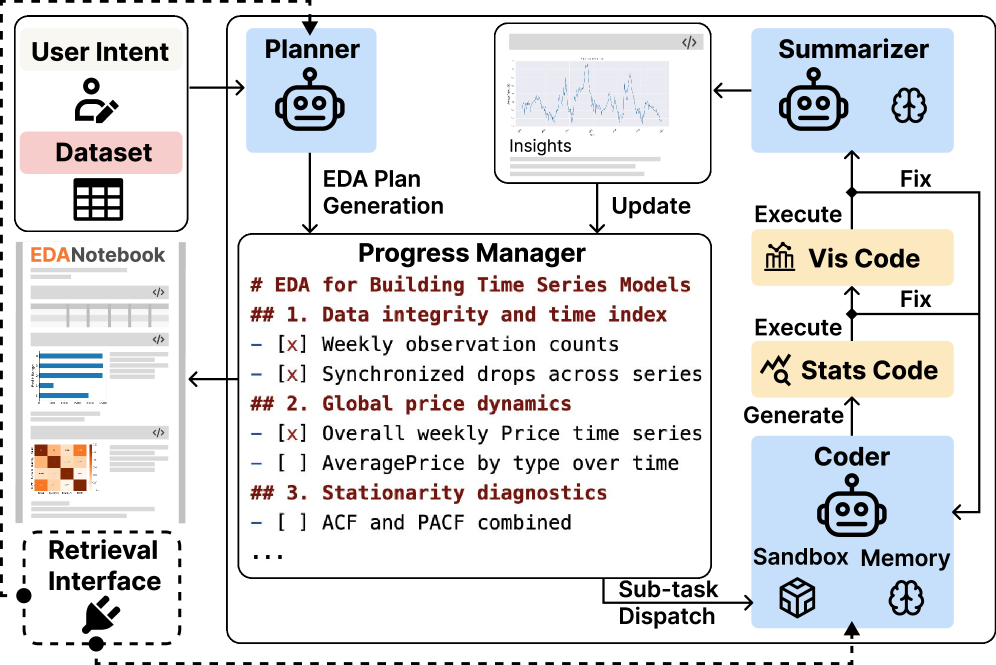
NotebookRAG automates Exploratory Data Analysis (EDA) by translating a user’s high-level ‘Abstract Intent’ – a natural language description of the desired analysis – into a fully functional computational notebook. This process moves beyond simple code generation by constructing an entire analytical workflow, including data loading, cleaning, transformation, visualization, and interpretation. The system interprets the Abstract Intent to identify the necessary steps and dynamically assembles these into a cohesive notebook structure, reducing the need for manual scripting and allowing users to rapidly prototype and execute data analyses based on their initial objectives.
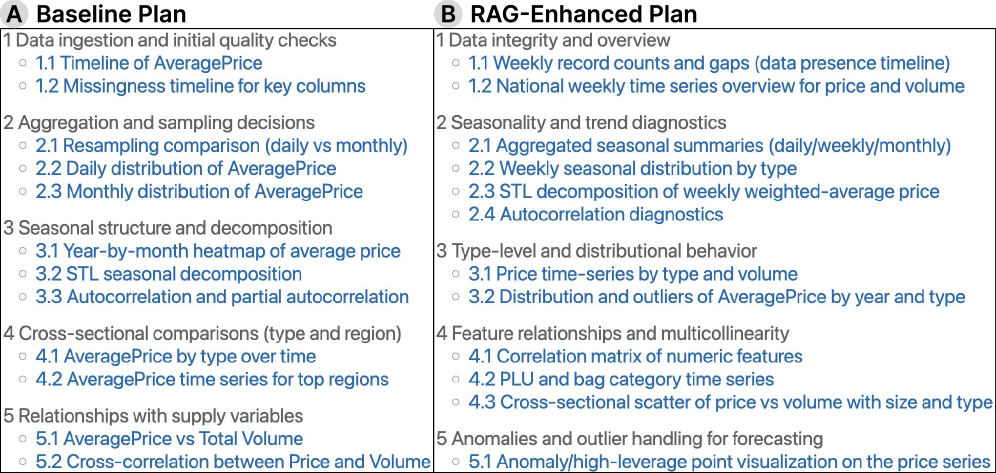
NotebookRAG streamlines the Exploratory Data Analysis (EDA) workflow by integrating Retrieval-Augmented Generation (RAG) with pre-existing notebooks and datasets. The RAG component allows the system to retrieve relevant code snippets and analytical approaches from a repository of established notebooks based on the user’s specified analytical intent. This retrieved information is then combined with the user’s input data, enabling the automated construction of a new, customized EDA notebook. By leveraging existing analytical assets, NotebookRAG minimizes the need for manual code writing and facilitates a more efficient and reproducible data analysis process. This approach accelerates the EDA lifecycle by providing a starting point based on proven techniques and adapting them to the specific dataset at hand.
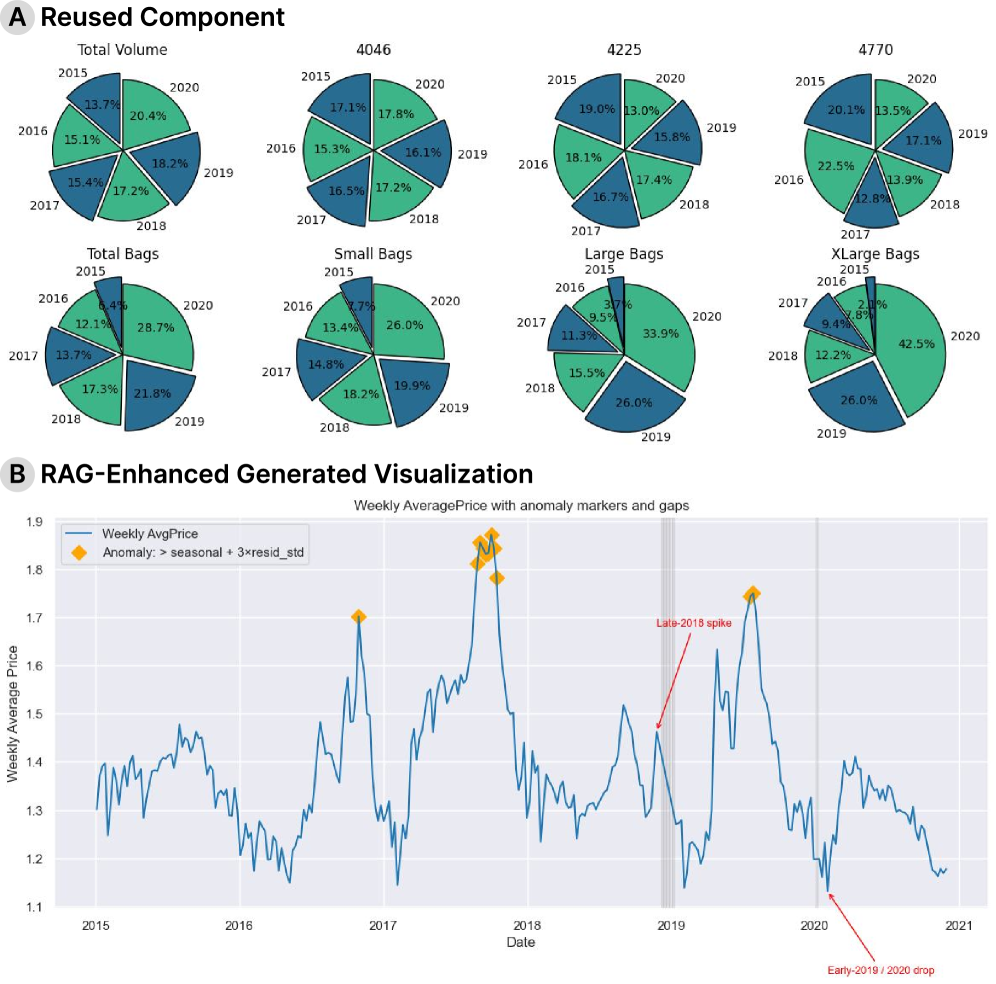
NotebookRAG’s functionality is built around modular ‘Components’, which are discrete, executable units of code. These Components are not monolithic; rather, they depend on two core elements for operation: ‘Code Cells’ and processed ‘Data Variables’. Code Cells contain the specific instructions to be executed, while Data Variables represent the input or output data used and generated by those instructions. This dependency structure allows for reusability; a Component can be integrated into different notebooks or workflows, adapting to varying datasets or analytical objectives as long as the required Data Variables are provided. The self-contained nature of Components facilitates a streamlined and reproducible EDA process, as each unit operates independently yet contributes to the overall analysis.
Statistical Foundations and Visual Inference
NotebookRAG employs statistical code and methods as the foundational layer for data analysis and subsequent insight generation. This integration allows for the execution of descriptive statistics – including measures of central tendency like mean and median, and dispersion such as standard deviation – as well as inferential statistics like hypothesis testing and regression analysis. The system supports common statistical programming languages, enabling the automated application of these techniques to datasets. The results of these analyses, quantified through statistical values and p-values, are then used to identify patterns, anomalies, and relationships within the data, ultimately forming the basis for automatically generated insights.
NotebookRAG prioritizes data visualization as a key component of exploratory data analysis. The system employs a variety of established ‘Visualization Methods’, including but not limited to histograms, scatter plots, and box plots, to represent datasets graphically. Beyond simple graphical rendering, NotebookRAG is designed to integrate ‘Visual Language Models’ (VLMs) capable of interpreting the information within these visualizations. This allows the system to move beyond merely displaying data and instead derive insights directly from graphical representations, such as identifying trends, anomalies, or correlations present in the visual data itself.
NotebookRAG’s Exploratory Data Analysis (EDA) process builds upon established techniques such as rule-based methods, which rely on pre-defined criteria for data investigation. To further refine EDA efficiency and effectiveness, the system also incorporates reinforcement learning (RL) algorithms. These RL agents are trained to dynamically select and sequence EDA operations – including statistical tests and visualizations – based on observed data characteristics and feedback signals. This adaptive approach allows NotebookRAG to move beyond static rule sets and optimize the EDA workflow for specific datasets, potentially uncovering insights more rapidly and comprehensively than traditional methods.
The Dawn of Automated Insight: A Paradigm Shift
NotebookRAG dramatically accelerates the data analysis lifecycle by automating exploratory data analysis (EDA). Traditionally, EDA-the critical initial step of understanding data through visualization and summary statistics-is a time-consuming, manual process. This system bypasses much of that effort, swiftly transforming raw data into structured insights. By automating tasks like identifying key variables, detecting patterns, and generating visualizations, NotebookRAG allows data scientists and analysts to move rapidly from initial data ingestion to informed decision-making. The reduced time to insight enables faster iteration on hypotheses, more thorough exploration of potential solutions, and ultimately, a quicker path to actionable results, proving particularly valuable in dynamic and fast-paced environments.
NotebookRAG prioritizes clarity and shared understanding by structuring its data exploration process within the familiar framework of computational notebooks, specifically generating analyses as readable Markdown cells. This approach moves beyond simply producing insights to actively documenting the analytical journey, detailing each step from data cleaning to visualization. The resulting notebooks aren’t static reports, but living documents that clearly articulate the methodology, assumptions, and rationale behind each finding. This inherent transparency is crucial for effective collaboration, allowing data scientists and stakeholders to readily review, validate, and build upon the work, fostering a more iterative and trustworthy data analysis workflow. By presenting complex analyses in a digestible, well-documented format, NotebookRAG significantly lowers the barrier to entry for understanding and leveraging data-driven insights.
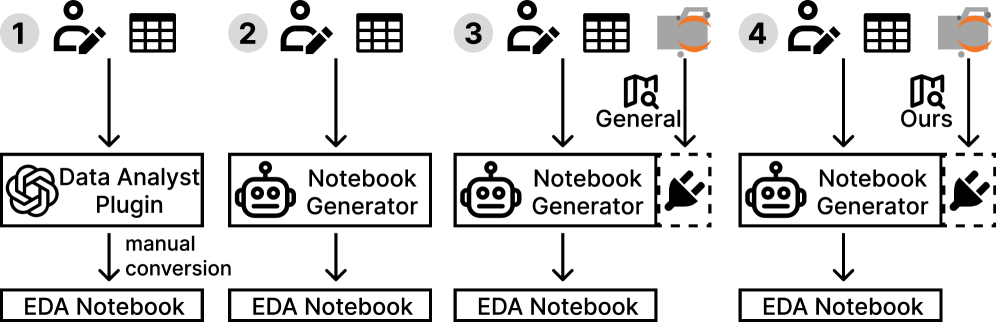
The advent of NotebookRAG facilitates a paradigm shift in data exploration through its seamless integration with large language models, mirroring the functionality seen in tools like the ChatGPT Data Analyst Plugin. This connection transcends traditional querying methods, enabling users to interact with datasets using natural language. Rather than crafting complex code or navigating intricate interfaces, a user can simply pose questions – “What are the key drivers of customer churn?” or “Visualize sales trends by region” – and receive insightful, data-driven responses. The system translates these requests into analytical operations, generates appropriate visualizations, and delivers results in a readily understandable format, effectively democratizing data analysis and empowering a broader audience to extract value from complex information.
Rigorous user studies reveal that NotebookRAG demonstrably exceeds the performance of existing data exploration tools across a comprehensive suite of metrics. Evaluations, conducted using Wilcoxon signed-rank tests with Holm-Bonferroni correction, consistently yielded statistically significant improvements – at the p<0.05, p<0.01, and p<0.001 levels – in areas crucial for effective data analysis. Participants rated NotebookRAG substantially higher in its Helpfulness, the Quality of generated analyses, its Task Alignment, demonstrated Data Comprehension, the Coverage of relevant variables, the clarity of Visualizations, the soundness of its Methodology, the depth of Insight provided, the Robustness of its findings, the coherence of its Narrative, and the Reproducibility and Efficiency of the entire exploratory process. These results collectively underscore NotebookRAG’s potential to significantly accelerate and enhance the data exploration workflow for analysts of all skill levels.
Rigorous evaluation demonstrates that the system consistently identifies and incorporates a broader range of crucial variables relevant to the analytical task at hand. Beyond simply including more data points, the generated insights themselves exhibit a demonstrably higher degree of accuracy, as confirmed through detailed manual assessments conducted by the research team. This validation process involved a careful review of the system’s analytical outputs, ensuring not only that the correct data was utilized, but also that the interpretations and conclusions drawn were logically sound and aligned with the underlying data patterns. These objective checks establish a substantial improvement in both the comprehensiveness and reliability of data exploration, moving beyond superficial analysis to deliver genuinely meaningful and trustworthy results.
NotebookRAG’s approach to retrieving and augmenting existing computational notebooks exemplifies a commitment to foundational correctness. The system doesn’t simply generate code; it builds upon verified components, prioritizing provability over mere functionality. This resonates with a sentiment expressed by Vinton Cerf: “The internet treats everyone like a peer.” In this context, each notebook represents a peer contribution, a validated unit of data analysis. NotebookRAG’s retrieval mechanism acknowledges this peer-to-peer validation, leveraging the wisdom embedded within existing work rather than relying solely on the fallibility of de novo generation. The emphasis on retrieving relevant code components for new datasets, rather than reinventing them, highlights a preference for established truth over convenient approximation.
Further Horizons
The presented work, while a pragmatic step toward automated exploratory data analysis, merely addresses the symptoms of a deeper inadequacy. The reliance on retrieving and adapting existing notebooks-a form of inductive reasoning-inherently limits the potential for genuinely novel insight. True elegance would reside in a system capable of deducing analytical procedures directly from the data’s underlying mathematical structure, free from the constraints of prior example. The current approach, though functional, is fundamentally bound by the biases and limitations of the ‘crowd-wisdom’ it seeks to harness.
A critical unresolved question concerns the formal verification of retrieved code components. Ensuring semantic correctness-that a retrieved snippet actually performs the intended analysis on a new dataset-remains a significant challenge. Superficial syntactic adaptation is insufficient; a robust system demands a mathematically rigorous proof of equivalence, or at least a quantifiable measure of analytical fidelity. The absence of such a guarantee introduces a subtle, yet pervasive, source of error.
Future efforts should focus less on the accumulation of examples and more on the development of algorithms capable of generating analytical procedures from first principles. This necessitates a shift in focus from large language models as mere pattern-matchers to systems capable of embodying and manipulating formal mathematical knowledge. Only then can the promise of truly automated, and demonstrably correct, data analysis be realized.
Original article: https://arxiv.org/pdf/2602.17215.pdf
Contact the author: https://www.linkedin.com/in/avetisyan/
See also:
- Invincible Season 4 Gender Swaps Tech Jacket As Fans Question Major Comic Change
- Building Agents That Learn and Improve Themselves
- Gold Rate Forecast
- Superman Flops Financially: $350M Budget, Still No Profit (Scoop Confirmed)
- Silver Rate Forecast
- Games That Faced Bans in Countries Over Political Themes
- Trading Crypto with AI: A New Approach to Portfolio Management
- 15 Films That Were Shot Entirely on Phones
- 22 Films Where the White Protagonist Is Canonically the Sidekick to a Black Lead
- Unveiling the Schwab U.S. Dividend Equity ETF: A Portent of Financial Growth
2026-02-21 23:14