Well, folks, it seems the little LINK has finally found its way out of the doghouse. After weeks of being cooped up in a descending channel, it’s finally broken free, shifting the short-term momentum to the upside. And let me tell you, the technical indicators and chart structures are all pointing to greener pastures. 🌱
With LINK now trading above a key exponential moving average, the analysts are starting to get a bit giddy, eyeing those higher resistance levels like kids in a candy store. The big question on everyone’s mind is whether this bullish pressure can hold up beyond the $14.00 mark. 🤔
Channel Breakout Signals: A Technical Shift
The 4-hour chart of LINK/USDT, as shared by the ever-observant AltWolf, shows a decisive breakout from a descending channel that had been holding the token back since early May. This breakout happened just above the $13.50 level, marking a shift from lower highs to a structure that’s more favorable to buyers. It’s like the token finally decided to stand up and say, “I’ve had enough of this!” 🙌
Notably, the breakout was accompanied by a price move above the 200 EMA, a trend indicator that’s as widely followed as the weather report. The reclaim of this level not only reinforces the breakout’s validity but also hints at a medium-term reversal. It’s like the token is saying, “I’m back, and I mean business!” 💪
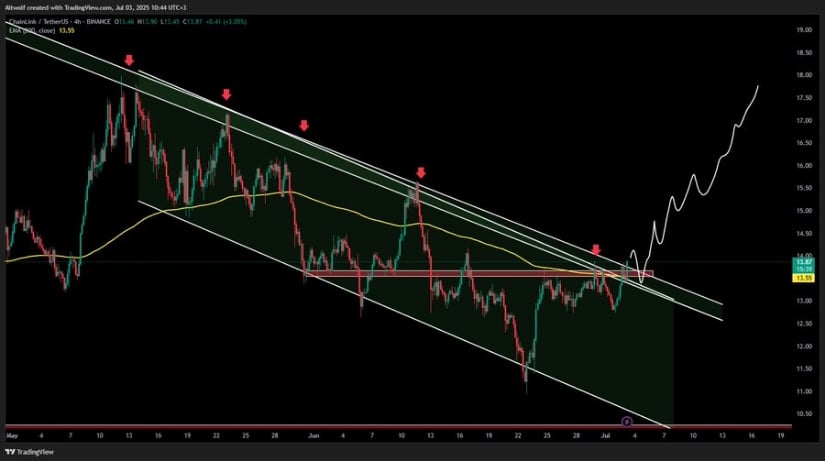
AltWolf identifies a key support zone between $13.30 and $13.60, which had previously acted as resistance. The recent price action suggests a potential retest of this zone, which could confirm support before any further upward continuation. It’s like the token is testing the waters before diving in headfirst. 🏊♂️
If the retest holds, the projected path points toward $15.50 in the near term and potentially $18.00 as a longer-term target. This projection aligns with historical resistance observed in April and fits the technical profile of a measured move following a channel breakout. Volume will be a critical component in confirming this breakout trajectory. It’s like the token needs a bit of a pep talk to keep going. 🗣️
Price Volatility and Participation Suggest Temporary Resistance
The 24-hour performance of Chainlink price from July 3 to July 4, 2025, recorded moderate price swings. LINK opened near $13.55 and climbed to an intraday peak of $13.93, before closing around $13.67, marking a 0.73% gain. It’s like the token had a bit of a rollercoaster ride, but it managed to hold on. 🎢
While the session began with strong upward momentum, resistance near $14.00 led to a pullback, reflecting possible profit-taking. This suggests that while bullish sentiment is building, there remains hesitation near psychological levels. It’s like the token is saying, “I’m almost there, but I need a little more encouragement.” 🙏
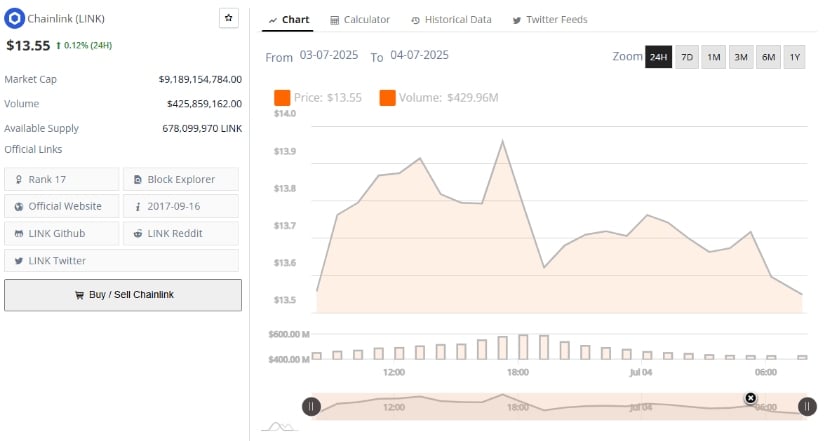
Trading volume peaked around midday in conjunction with the price rally, confirming that the surge had market support. However, both price and volume declined in the later part of the session, indicating reduced follow-through. This divergence underscores the importance of renewed buying activity to sustain any upward movement. It’s like the token needs a bit of a push to keep going. 🚀
LINK’s market cap stood at $9.27 billion, supported by a circulating supply of 678 million tokens. Until a clean break above $14.00 occurs with increased participation, the price may remain range-bound between support at $13.30 and resistance at $14.20. It’s like the token is caught in a bit of a tug-of-war. 🤹♂️
Momentum Indicators Suggest Cautious Optimism at the Time of Writing
As of July 4, 2025, LINK is trading at $13.54, down 0.95% on the day. Recent price action has been confined within a relatively narrow band, forming a base near $13.00 after a broader correction from April highs above $17.00. The overall trend on the daily chart remains neutral, with alternating candles of minor gains and losses reflecting market indecision. It’s like the token is taking a breather before making its next move. 🛀
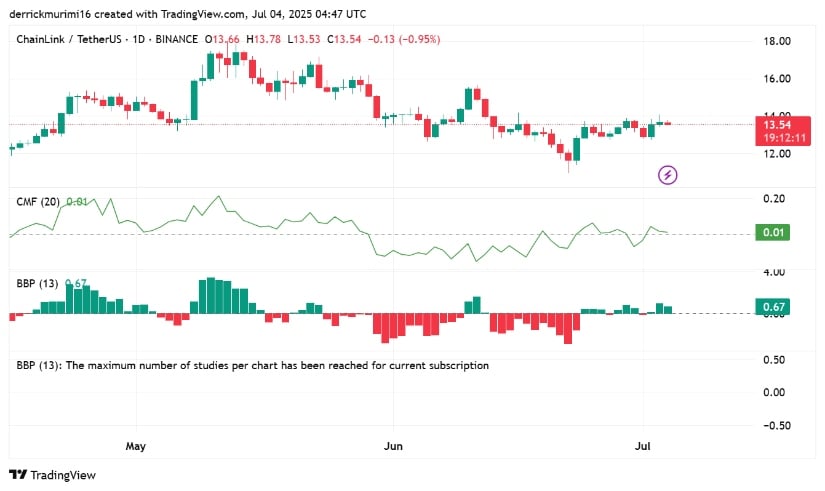
Momentum indicators present mixed signals. The Chaikin Money Flow (CMF) sits at 0.01, indicating mild capital inflow, though not enough to suggest strong accumulation. A sustained move above +0.05 would be required to confirm growing buyer conviction. It’s like the token needs a bit more faith from the market. 🙏
Meanwhile, the Bollinger Band Percent (BBP) stands at 0.67, placing the current price near the upper range of recent trading activity. If LINK maintains its position above $13.50 and closes higher with growing volume, a breakout toward $14.50 or beyond remains possible. Failure to hold this level could see LINK retest support closer to $12.80 in the near term. It’s like the token is on a tightrope, and it needs to keep its balance. 🧗♂️
Read More
- Gold Rate Forecast
- 22 Films Where the White Protagonist Is Canonically the Sidekick to a Black Lead
- Games That Faced Bans in Countries Over Political Themes
- Silver Rate Forecast
- Unveiling the Schwab U.S. Dividend Equity ETF: A Portent of Financial Growth
- How to Do Sculptor Without a Future in KCD2 – Get 3 Sculptor’s Things
- Celebs Who Narrowly Escaped The 9/11 Attacks
- 14 Movies Where the Black Character Refuses to Save the White Protagonist
- 20 Movies Where the Black Villain Was Secretly the Most Popular Character
- The Best Directors of 2025
2025-07-05 00:00