Oh, Bitcoin, you fickle beast. 🤑 Currently lounging at $119,128, you’re like that friend who’s “just hanging out” between $118.5K and $119K after a wild night out (aka a sharp sell-off). Your market cap is a cool $2.37 trillion, and your 24-hour trading volume is $63.34 billion-because why not? The intraday range? A thrilling $117,201 to $121,073. Traders are basically staring at their screens like, “What now?” while technical indicators shrug and say, “Beats me.” 🤷♀️
Bitcoin: The Drama Queen of Crypto 👑
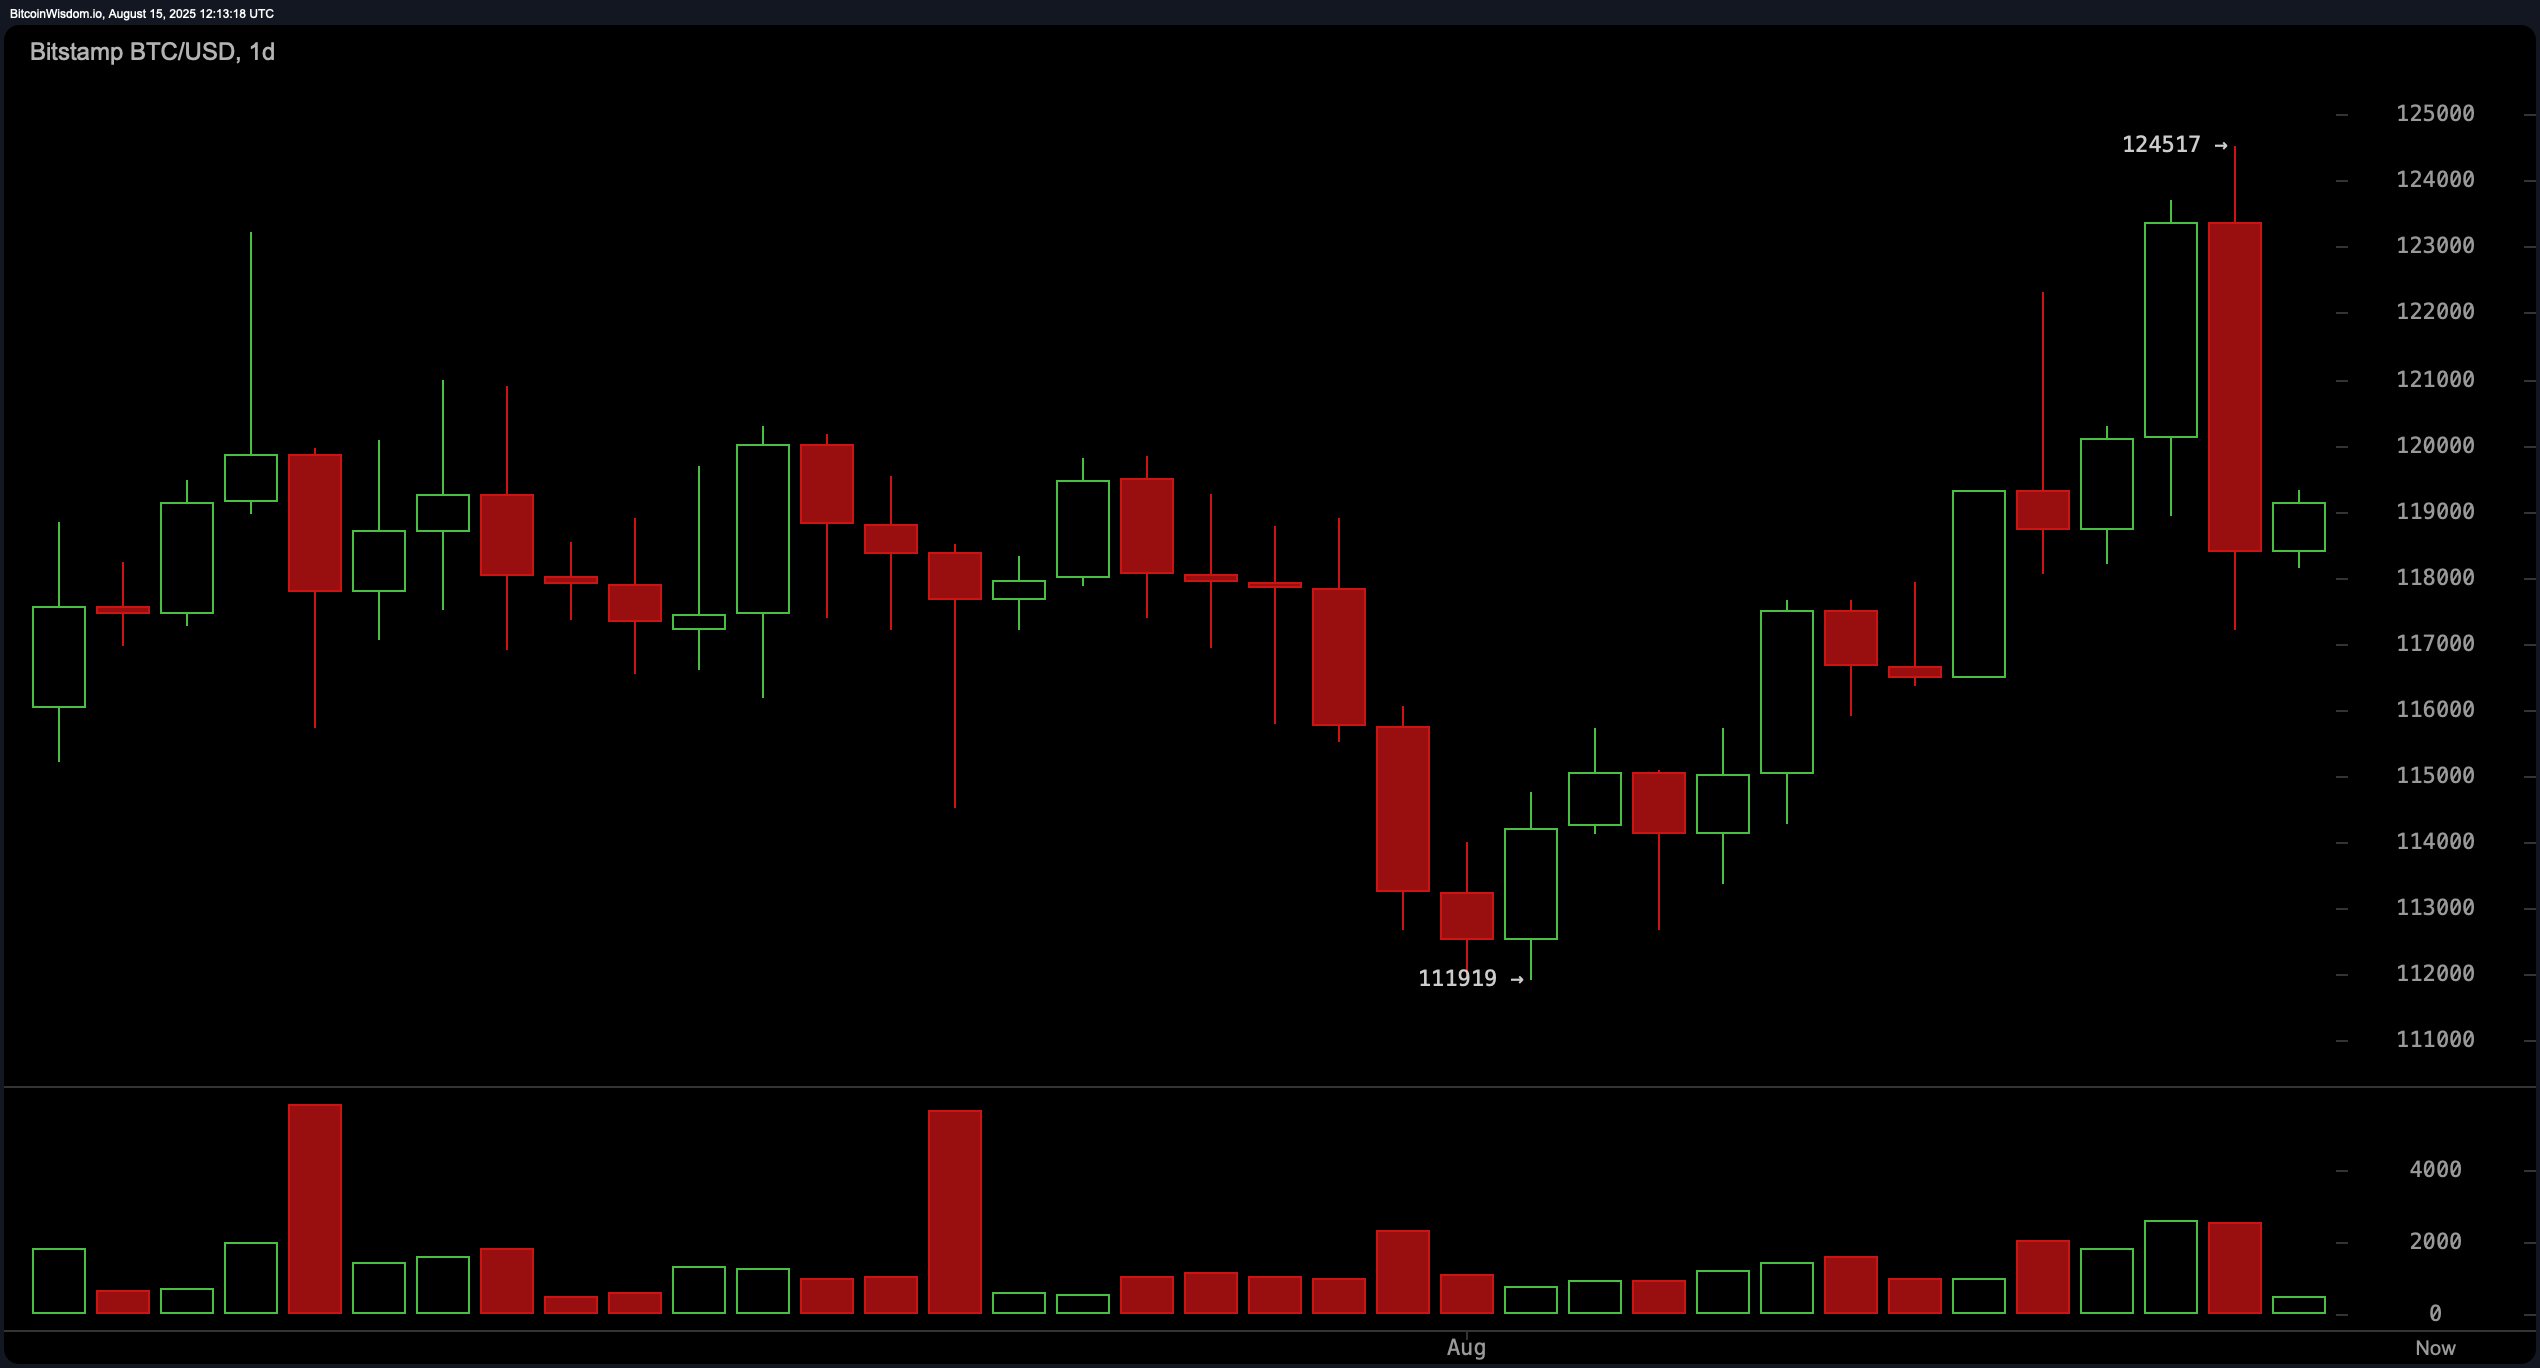
The daily chart? Oh, honey. Bitcoin’s been retreating like it’s running from its own shadow, dropping from a local peak of $124,517. The latest candle is a bearish engulfing formation-basically a “I’m out” moment with increased volume. The RSI is at 55.1, which is like, “I’m fine, I swear,” while the MACD at 1,224.5 is still team “bullish phase.” But let’s be real, if it dips below $117,000, it’s headed for a $113,000-$115,000 pity party. Unless, of course, it decides to reclaim $119,500-$120,000 like a boss. 💪
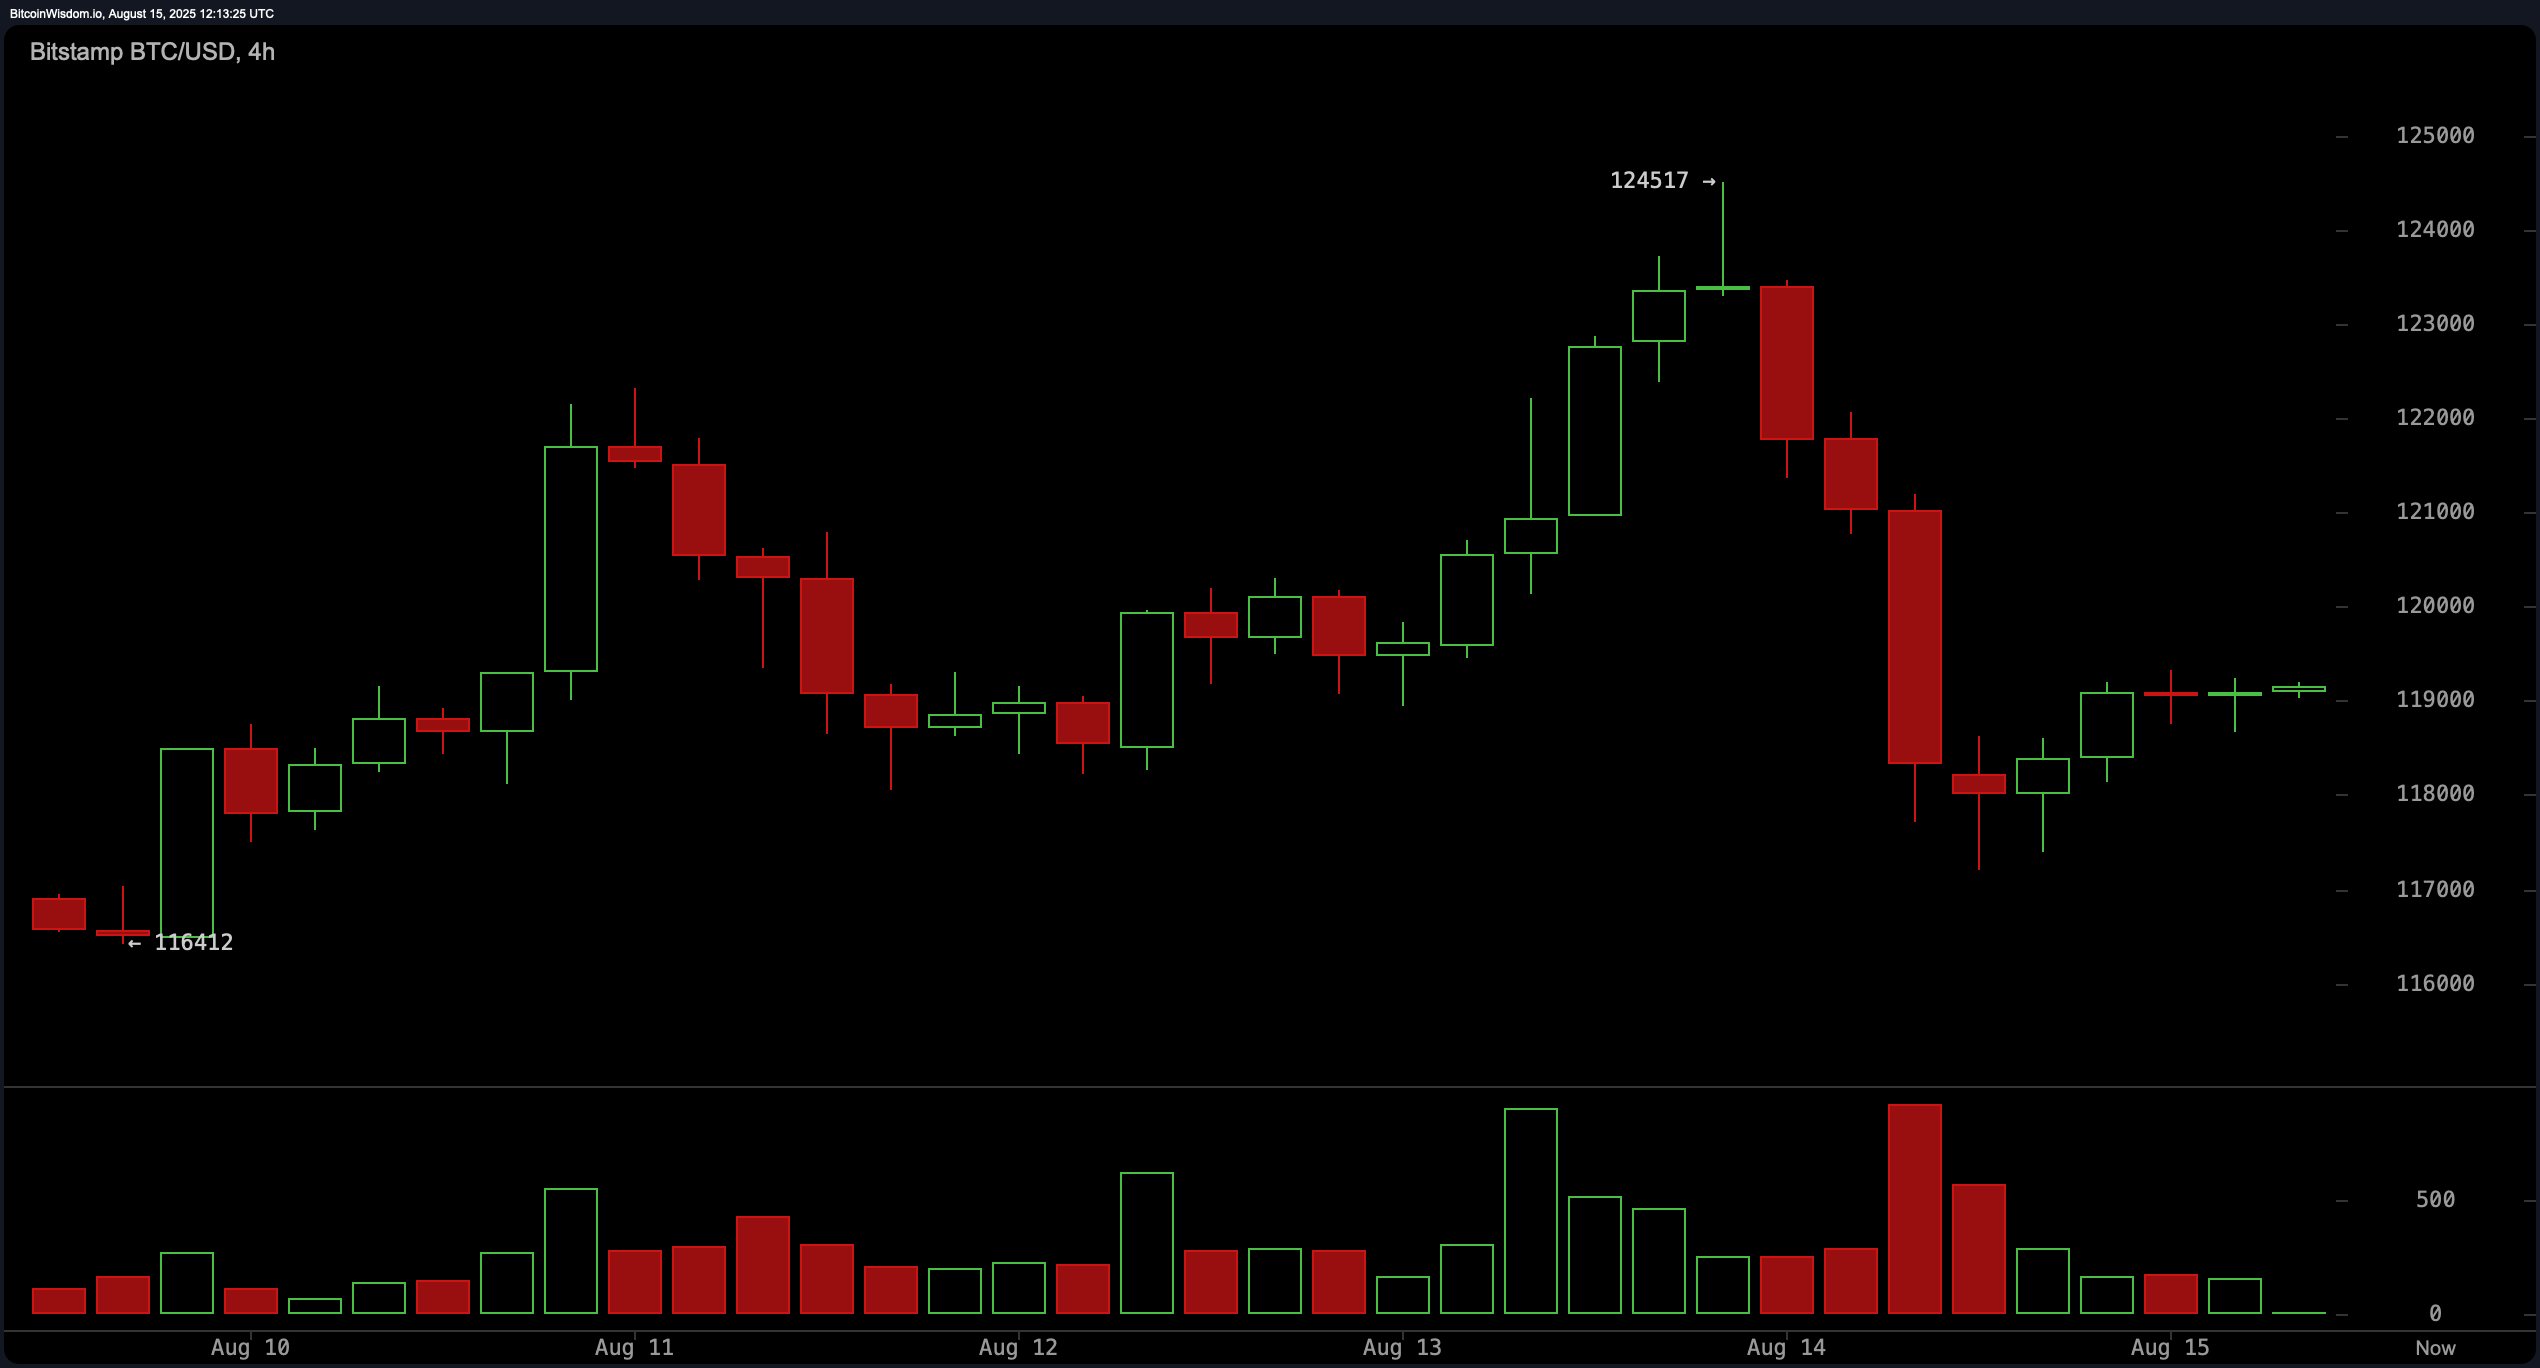
The 4-hour chart? It’s giving major side-eye. Lower highs since the $124,517 peak, with red volume spikes during sell-offs and green volume that’s like, “Eh, I tried.” The Stochastic oscillator at 68.7 and the CCI at 57.9 are basically yawning. But hey, the EMAs and SMAs are still team “long-term trend support.” Traders are eyeing $120,000-$121,500 like it’s the last slice of pizza, while $119,500 is the line in the sand. 🍕🚫
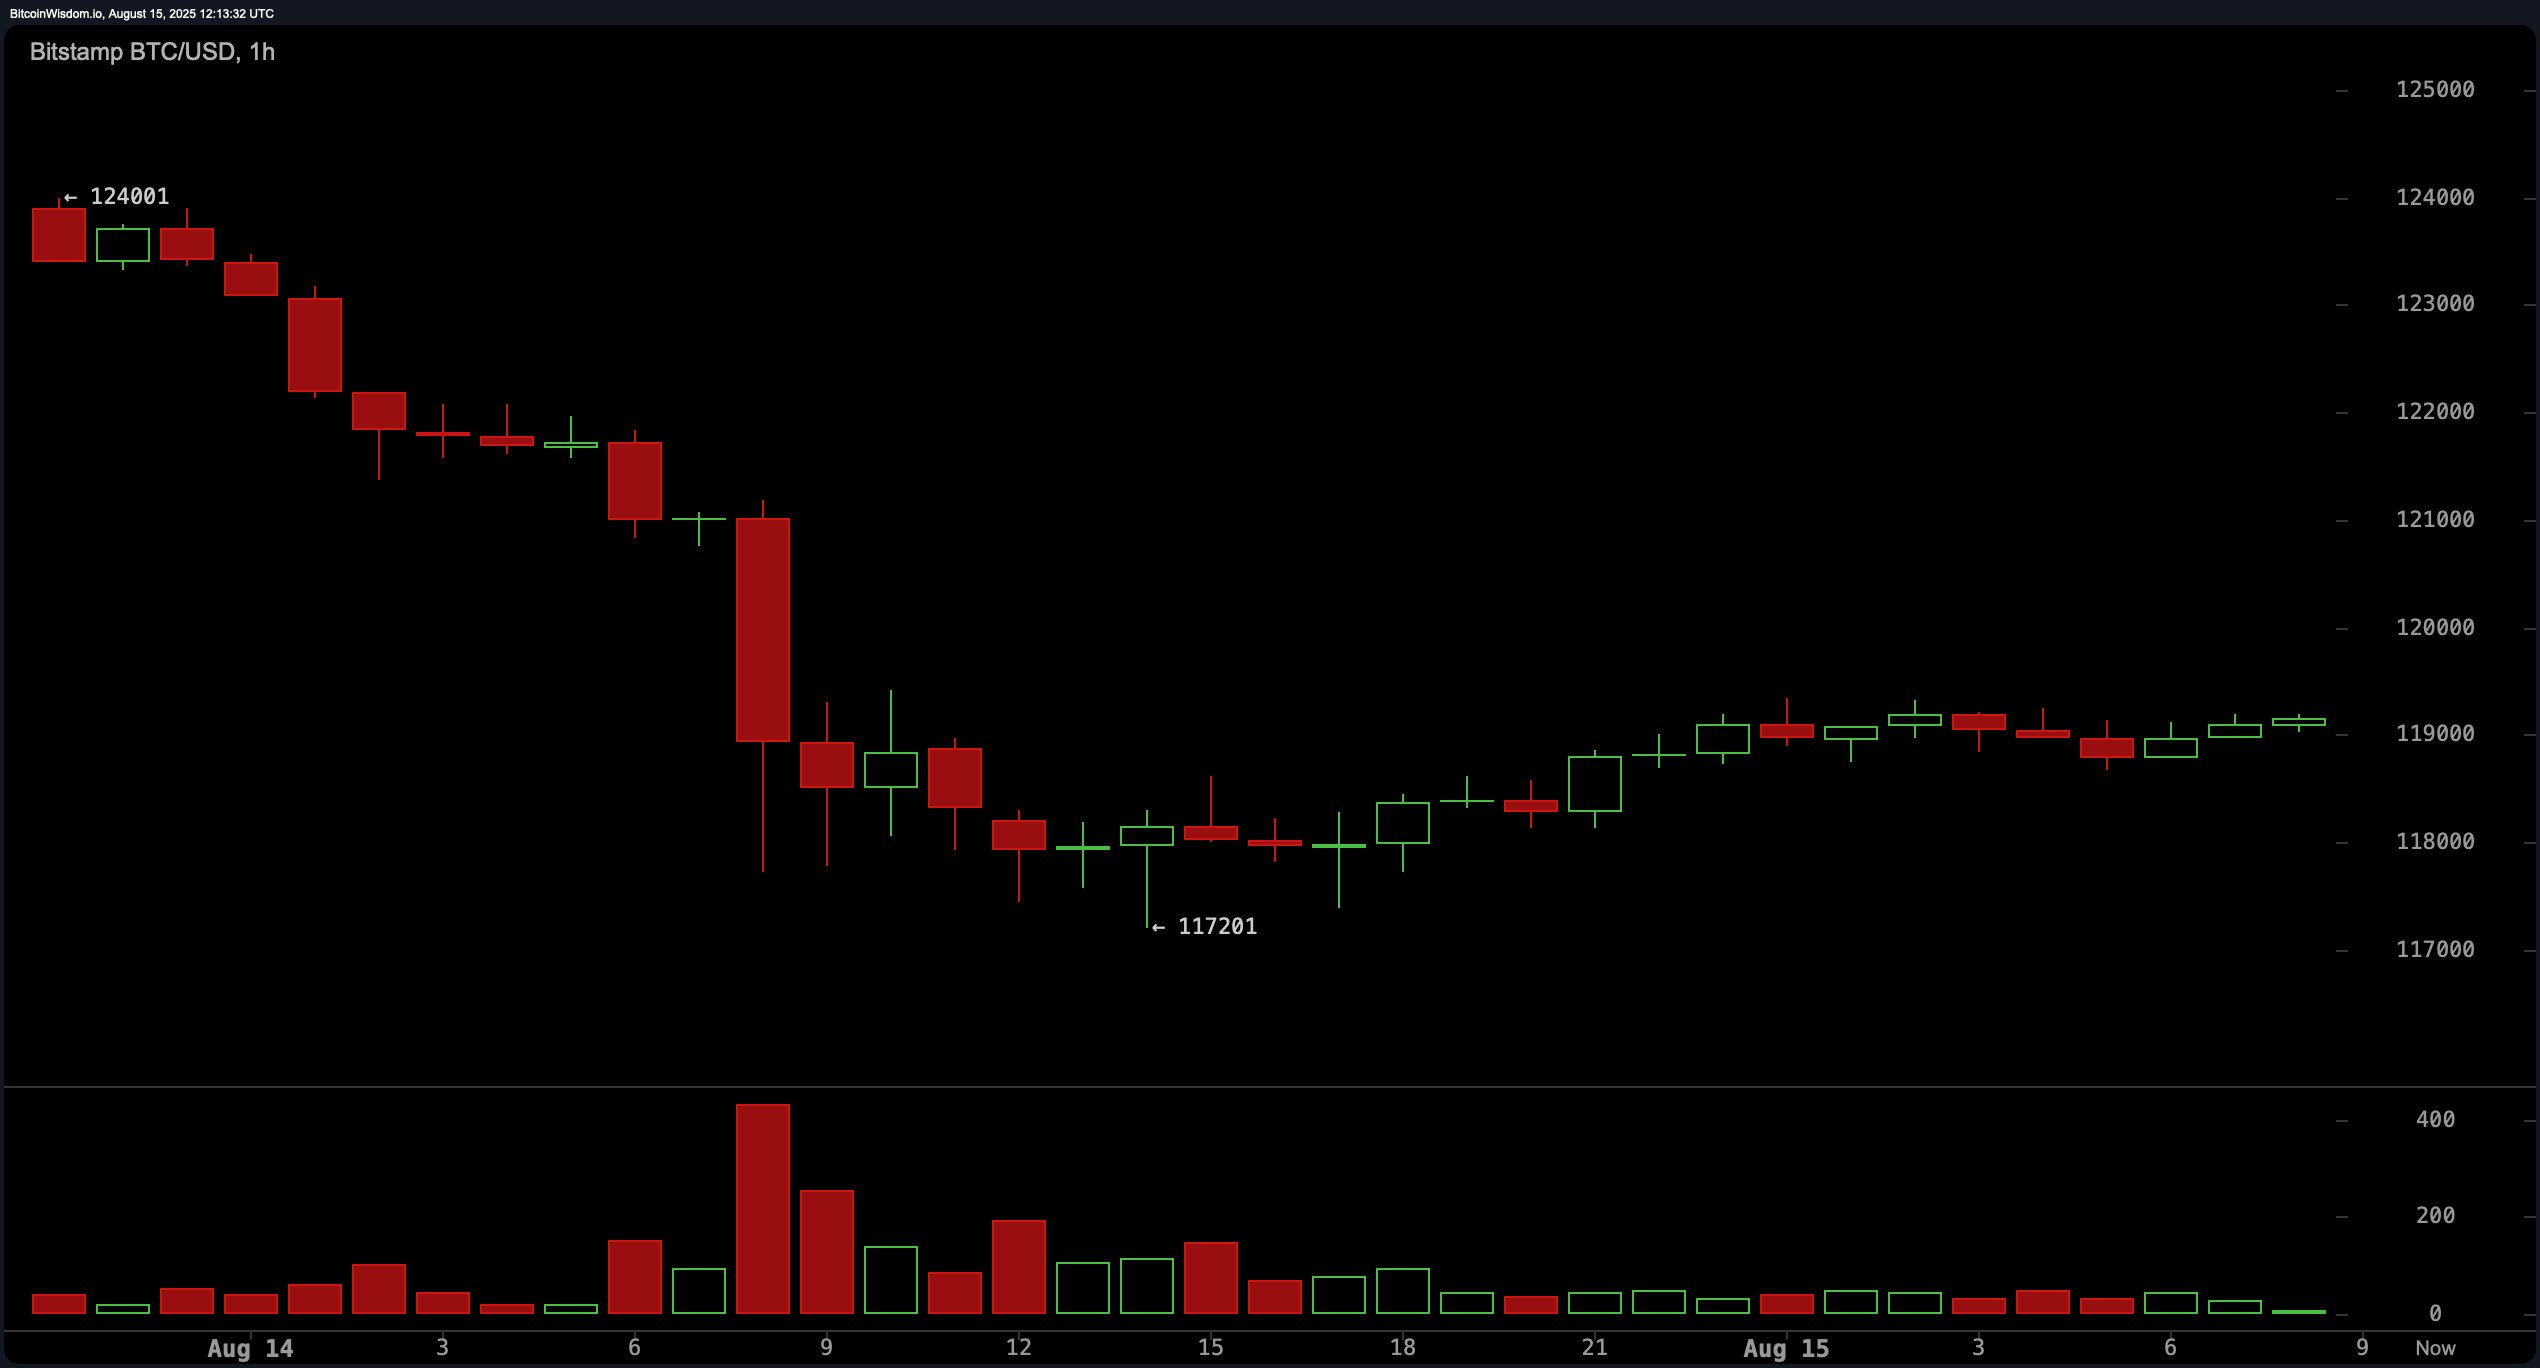
Hourly chart? Bitcoin’s in a chop zone between $117,800 and $119,300, like it’s stuck in traffic. Volume? Subdued. The momentum indicator at 5,055.0 is like, “Let’s go!” but the Awesome oscillator at 2,431.5 is just chilling. Scalp traders are either long near $117,800-$118,000 or short from $119,300, depending on their mood. 🤔
Moving averages? Still bullish across all timeframes. The EMAs and SMAs are like, “We got this,” but short-term traders are side-eyeing a potential breakdown. It’s like a group project where everyone’s bullish, but one person’s like, “I’m not doing the work.” 📈🤦♀️
Overall, Bitcoin’s at a crossroads-consolidation or breakout? Oscillators are shrugging, moving averages are cheering, and traders are biting their nails. Watch $119,500-$120,000 for a breakout or $117,000 for a nosedive. Until then, range trading is the name of the game. 🎢
Bull Verdict: 🚀
If Bitcoin reclaims $120,000 like a champ, it’s off to $122,000-$124,000. The MACD and momentum are like, “Let’s do this!” But it needs to break resistance like it’s breaking up with a bad habit. 💔
Bear Verdict: 🐻
If it can’t hold $119,500 and dips below $117,000, it’s headed for $113,000-$115,000. Volume’s declining, and bulls are like, “I’m tired.” 😴
Read More
- Silver Rate Forecast
- Gold Rate Forecast
- 22 Films Where the White Protagonist Is Canonically the Sidekick to a Black Lead
- Brent Oil Forecast
- 15 Films That Were Shot Entirely on Phones
- Unveiling the Schwab U.S. Dividend Equity ETF: A Portent of Financial Growth
- Games That Faced Bans in Countries Over Political Themes
- How to Do Sculptor Without a Future in KCD2 – Get 3 Sculptor’s Things
- 14 Movies Where the Black Character Refuses to Save the White Protagonist
- 20 Movies Where the Black Villain Was Secretly the Most Popular Character
2025-08-15 16:30