As a seasoned researcher with extensive experience in the cryptocurrency market, I find the current Bitcoin (BTC) price action against the US Dollar (USD) on Bitstamp fascinating. The chart presented displays a robust uptrend with occasional corrections, indicating strong bullish momentum and resilience in the market.
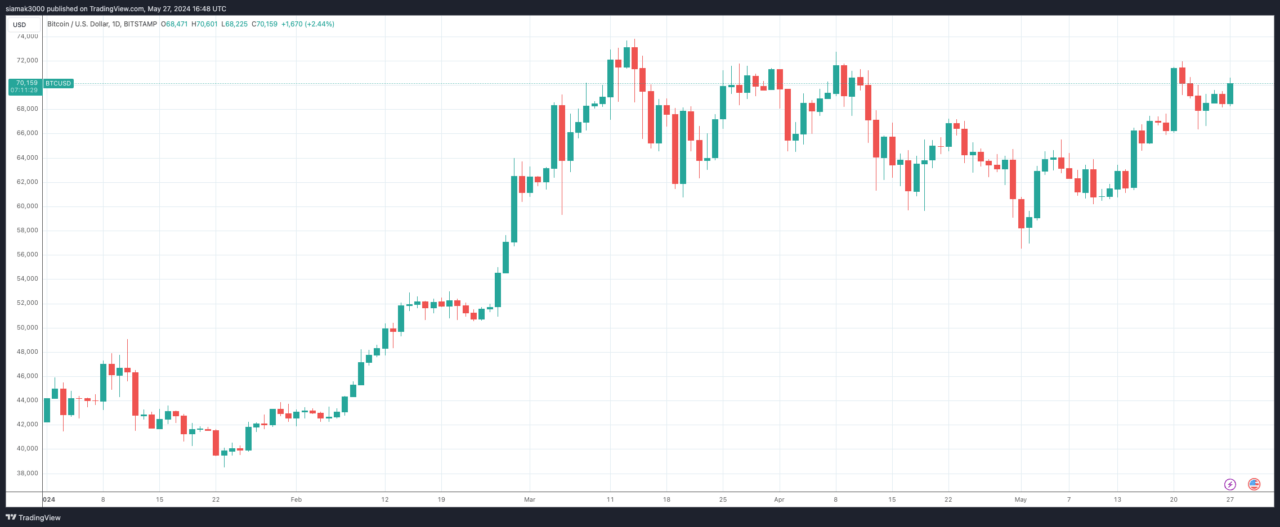
On May 27, 2024, I observe Bitcoin (BTC) trading against the US Dollar (USD) on Bitstamp at around $70,159. This represents a noteworthy daily gain of approximately $1,670 or 2.44%. In this technical analysis, I delve into Bitcoin’s price trends, pinpoint crucial support and resistance levels, and ponder potential future developments.
Overview of Current Market Conditions
The TradingView chart I’m referring to presents a daily perspective, showcasing Bitcoin’s price evolution from the beginning of 2024 up until now. This visualization highlights a persistent uptrend interspersed with periodic pullbacks, implying a solid bullish trend in the cryptocurrency market.
Key Observations
Trend Analysis:
- Uptrend: Since the start of 2024, Bitcoin has shown a significant uptrend. The price surged from around $40,000 to over $70,000, highlighting persistent buying interest and strong bullish momentum.
- Corrections: Several corrections are visible on the chart, characterized by sharp declines. However, these corrections were followed by swift recoveries, indicating the resilience of the uptrend.
Support and Resistance Levels:
- Support Levels: The chart identifies key support levels around $60,000 and $52,000. These levels have acted as strong buy zones, where the price rebounded after facing corrections.
- Resistance Levels: The primary resistance level is currently at $70,000. Bitcoin’s ability to break and sustain above this level will be crucial for continued bullish momentum.
Candlestick Patterns:
- Bullish Candles: The chart displays several large bullish candles, signifying strong buying interest, especially during phases of the uptrend.
- Bearish Candles: Bearish candles appear during corrections but are relatively smaller compared to bullish ones, suggesting that sell-offs were not as intense.
Moving Averages:
- Short-Term Moving Averages: While not explicitly shown on the chart, it is likely that short-term moving averages are below the current price, indicating a strong uptrend.
- Long-Term Moving Averages: Similarly, long-term moving averages are expected to be below the current price, reinforcing the bullish trend.
Volume Analysis:
- Volume Spikes: Although volume data is not visible on the chart, significant price movements usually align with volume spikes, confirming the strength of those moves.
Potential Scenarios
Bullish Scenario:
- Breakout Above $70,000: If Bitcoin breaks and sustains above the $70,000 resistance level, it could signal further upward movement. The next target might be around $75,000 or higher, based on previous patterns of price behavior after breaking significant resistance levels. This scenario would indicate strong continued interest from buyers and could set the stage for new all-time highs.
Bearish Scenario:
- Failure to Break $70,000: If Bitcoin fails to break above $70,000, it could result in a pullback to the nearest support levels around $68,000 or $60,000.
- Extended Correction: A more significant correction could drive the price back to around $52,000, the next major support level.
Conclusion
In simpler terms, the chart indicates a positive outlook for Bitcoin’s price, with the cryptocurrency attempting to break through the $70,000 barrier. The bullish trend is reinforced by several underlying support levels that help minimize any potential declines. Keep a keen eye on Bitcoin’s movements near $70,000 to gauge future price fluctuations.
Should Bitcoin surmount and maintain its position above the notable resistance level, this achievement could open the door for additional gains, possibly reaching towards $75,000 or even beyond. Conversely, if Bitcoin fails to breach the $70,000 mark, it may trigger a reversal, with $68,000 and $60,000 emerging as significant support thresholds to keep an eye on.
Read More
- Apothecary Diaries Ch.81: Maomao vs Shenmei!
- 30 Best Couple/Wife Swap Movies You Need to See
- Gachiakuta Chapter 139: Rudo And Enjin Team Up Against Mymo—Recap, Release Date, Where To Read And More
- Every Minecraft update ranked from worst to best
- Ncuti Gatwa Exits Doctor Who Amidst Controversy and Ratings Crisis!
- Summoners War Tier List – The Best Monsters to Recruit in 2025
- USD ILS PREDICTION
- 9 Kings Early Access review: Blood for the Blood King
- DC: Dark Legion The Bleed & Hypertime Tracker Schedule
- Netflix’s ‘You’ Season 5 Release Update Has Fans Worried
2024-05-27 20:12