Author: Denis Avetisyan
A novel objective function, the GT-Score, offers a powerful method for reducing overfitting and improving the real-world performance of data-driven trading systems.
This paper introduces the GT-Score, demonstrating its ability to enhance out-of-sample generalization through a robust optimization process applicable to quantitative finance.
Despite the increasing sophistication of data-driven techniques in quantitative finance, overfitting remains a persistent challenge, leading to strategies that perform well in backtests but fail in live deployment. This paper introduces the GT-Score, a novel objective function for optimizing trading strategies-detailed in ‘The GT-Score: A Robust Objective Function for Reducing Overfitting in Data-Driven Trading Strategies’. Empirical results, using historical stock data and rigorous validation techniques including walk-forward analysis, demonstrate that the GT-Score substantially improves out-of-sample generalization compared to conventional optimization methods. Could incorporating robustness directly into the optimization process represent a fundamental shift in the development of reliable quantitative trading strategies?
The Illusion of Edge: Why Past Performance is a Phantom
Data-driven trading systems, while holding the potential for significant returns, are fundamentally susceptible to a phenomenon known as overfitting. This occurs when a strategy doesn’t genuinely learn the underlying, predictive relationships within financial markets, but instead memorizes random fluctuations – the ‘noise’ – present in historical data. Consequently, the system performs remarkably well when tested on the data it was trained with, creating a false sense of security. However, this performance fails to translate to live trading because the memorized noise isn’t consistent in the future; the strategy essentially chases ghosts, mistaking chance occurrences for actionable signals. This distinction between learning true patterns and memorizing noise is critical, as a system optimized for past randomness will inevitably disappoint when faced with the unpredictable reality of market dynamics.
A common pitfall in developing data-driven trading strategies is the phenomenon of overfitting, where a model performs exceptionally well on historical data but subsequently falters when deployed in live markets. This discrepancy arises because the model has effectively memorized the random fluctuations – the ‘noise’ – present in the training data, rather than identifying the underlying, generalizable patterns. Consequently, the model’s apparent predictive power is illusory; it capitalizes on historical coincidences that are unlikely to repeat, leading to robust backtesting results that do not translate into sustained profitability. This disconnect between historical performance and real-world outcomes represents a significant challenge for quantitative traders, demanding rigorous validation techniques and a focus on model generalization to ensure reliable and consistent results.
The pursuit of profitable trading strategies frequently involves optimizing a multitude of parameters – from moving average lengths to risk tolerance levels. However, standard statistical techniques often underestimate the probability of discovering seemingly robust patterns purely by chance when subjected to this extensive parameter exploration. This is known as the multiple testing problem: with each additional parameter adjusted, the likelihood of finding a spurious correlation that appears significant increases dramatically. Consequently, a strategy might exhibit impressive performance on historical data, not because it’s capturing genuine market dynamics, but because it has effectively memorized random fluctuations specific to that dataset. Failing to account for this inflates the perceived reliability of the strategy and almost guarantees disappointing results when deployed in live trading environments where those specific fluctuations are absent.
Mitigating the Noise: Tools for a More Robust Foundation
Regularization techniques address overfitting by introducing a penalty term to the loss function, discouraging excessively complex models. Ridge Regression, or L2 regularization, adds a penalty proportional to the sum of the squared magnitudes of the coefficients \lambda \sum_{i=1}^{p} \beta_i^2, shrinking coefficients towards zero but rarely eliminating them entirely. Lasso Regression, or L1 regularization, utilizes the sum of the absolute values of the coefficients \lambda \sum_{i=1}^{p} |\beta_i| as the penalty, which can drive some coefficients to exactly zero, effectively performing feature selection and simplifying the model. The parameter λ controls the strength of the penalty; higher values increase the penalty and promote simpler models, while lower values allow for more complex models that may better fit the training data but risk overfitting.
Cross-validation is a resampling technique used to evaluate machine learning models and assess their ability to generalize to independent datasets. The process involves partitioning the available data into multiple subsets, or ‘folds’. The model is then trained on a subset of these folds and evaluated on the remaining, unseen fold. This process is repeated iteratively, with each fold serving as the validation set once. The performance metric, such as accuracy or R^2, is then averaged across all iterations, providing a more robust and less biased estimate of the model’s true performance than a single train-test split. This is crucial because models can easily overfit to the training data, yielding deceptively high performance on that specific dataset but failing to generalize well to new, unseen data; cross-validation helps detect and mitigate this issue by providing a more realistic evaluation.
Dropout is a regularization technique employed during neural network training where randomly selected neurons are ignored during each training iteration. This “dropout” process prevents neurons from co-adapting and becoming overly reliant on specific other neurons, forcing the network to learn more robust and generalized features. Effectively, dropout trains an ensemble of sub-networks, each with a different architecture, and averages their predictions at test time. The probability of dropping a neuron is a hyperparameter, typically set between 0.2 and 0.5. During inference, the activations of the remaining neurons are often scaled by the dropout probability to maintain expected activation levels.
Beyond Simple Metrics: The GT-Score and a More Holistic View
The Sharpe Ratio, a common metric for evaluating risk-adjusted returns, calculates the excess return per unit of total risk, typically measured by standard deviation. However, this metric proves inadequate for complex trading strategies due to its reliance on normally distributed returns-an assumption often violated in financial markets. Furthermore, the Sharpe Ratio doesn’t penalize strategies that achieve high returns through infrequent, large gains coupled with significant drawdowns. This can lead to an overestimation of a strategy’s true robustness. Complex strategies, often incorporating multiple factors and non-linear relationships, require evaluation frameworks that account for statistical significance, consistency of performance, and downside risk beyond simple volatility measures, limitations the GT-Score aims to address.
The GT-Score utilizes a composite objective function designed to provide a more holistic evaluation of trading strategy performance than traditional metrics. This score is calculated by combining four key components: R-squared, measuring the proportion of variance explained by the strategy; the Z-Score, indicating the statistical significance of the returns; consistency, which quantifies the stability of performance over time; and Downside Deviation, assessing the risk of negative returns. These components are weighted and combined to generate a single score, allowing for a comprehensive assessment of a strategy’s ability to generate consistent, statistically significant returns while managing downside risk. The resulting GT-Score provides a normalized metric for comparing different strategies, irrespective of their absolute return levels.
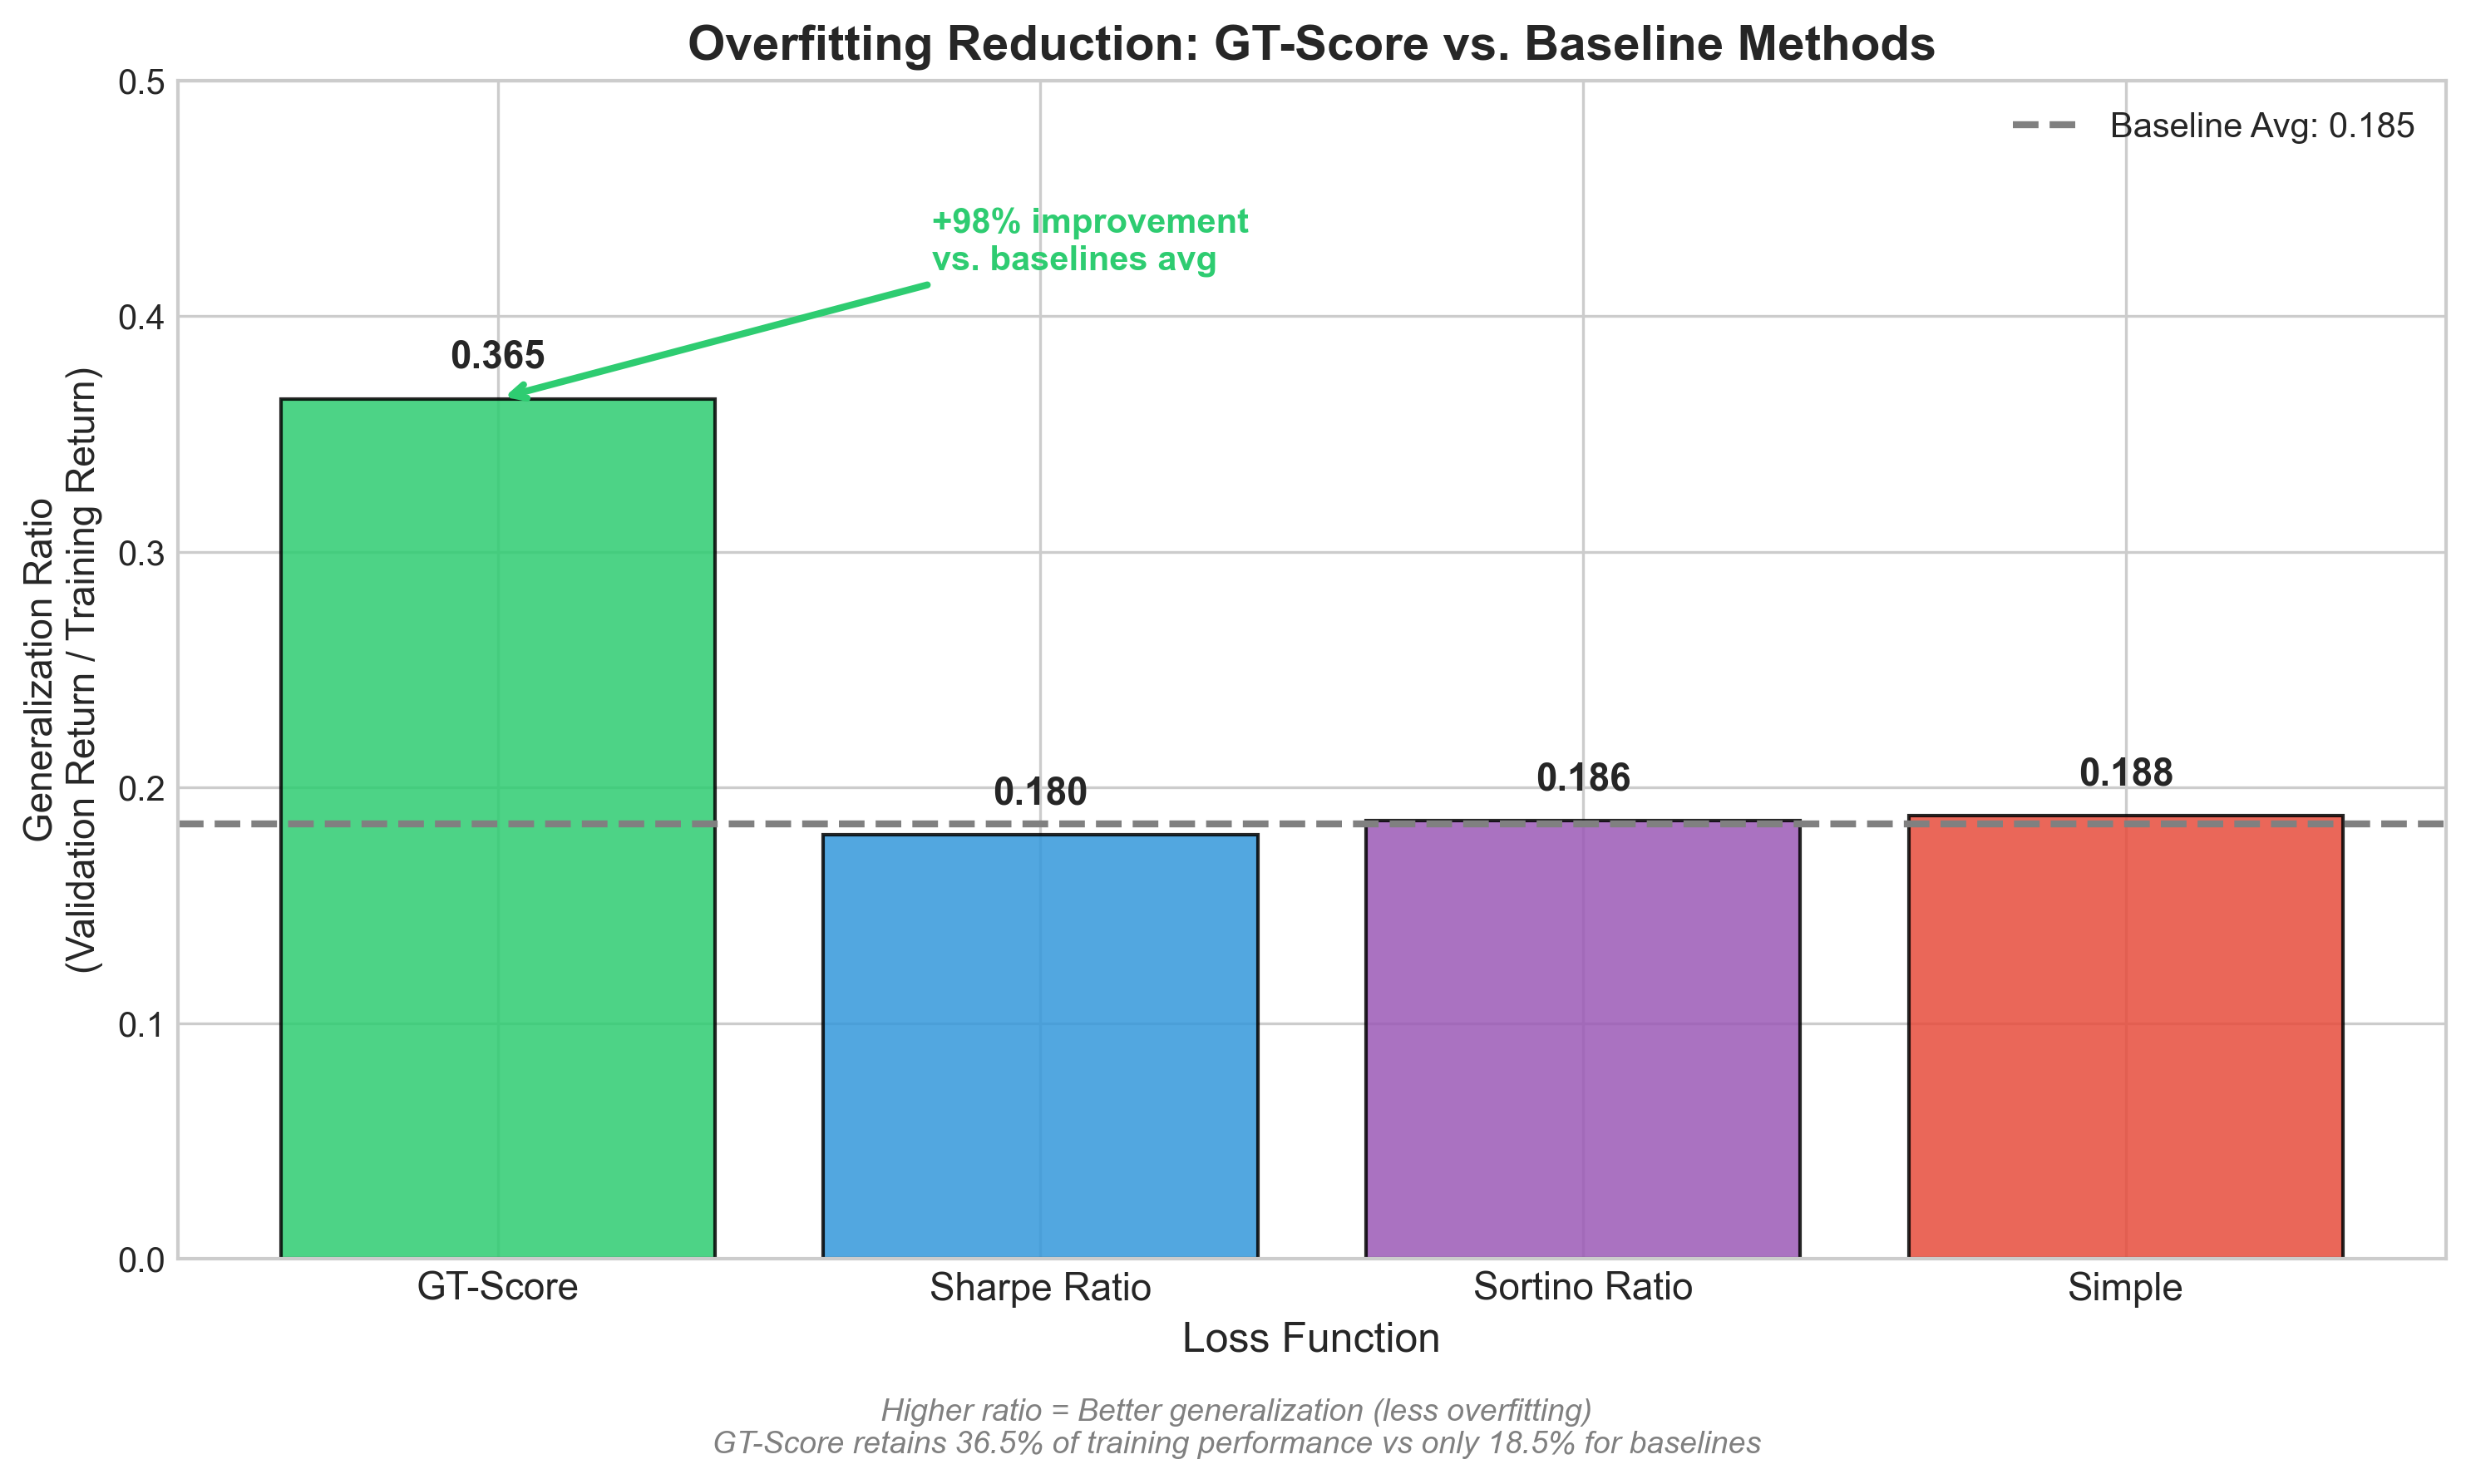
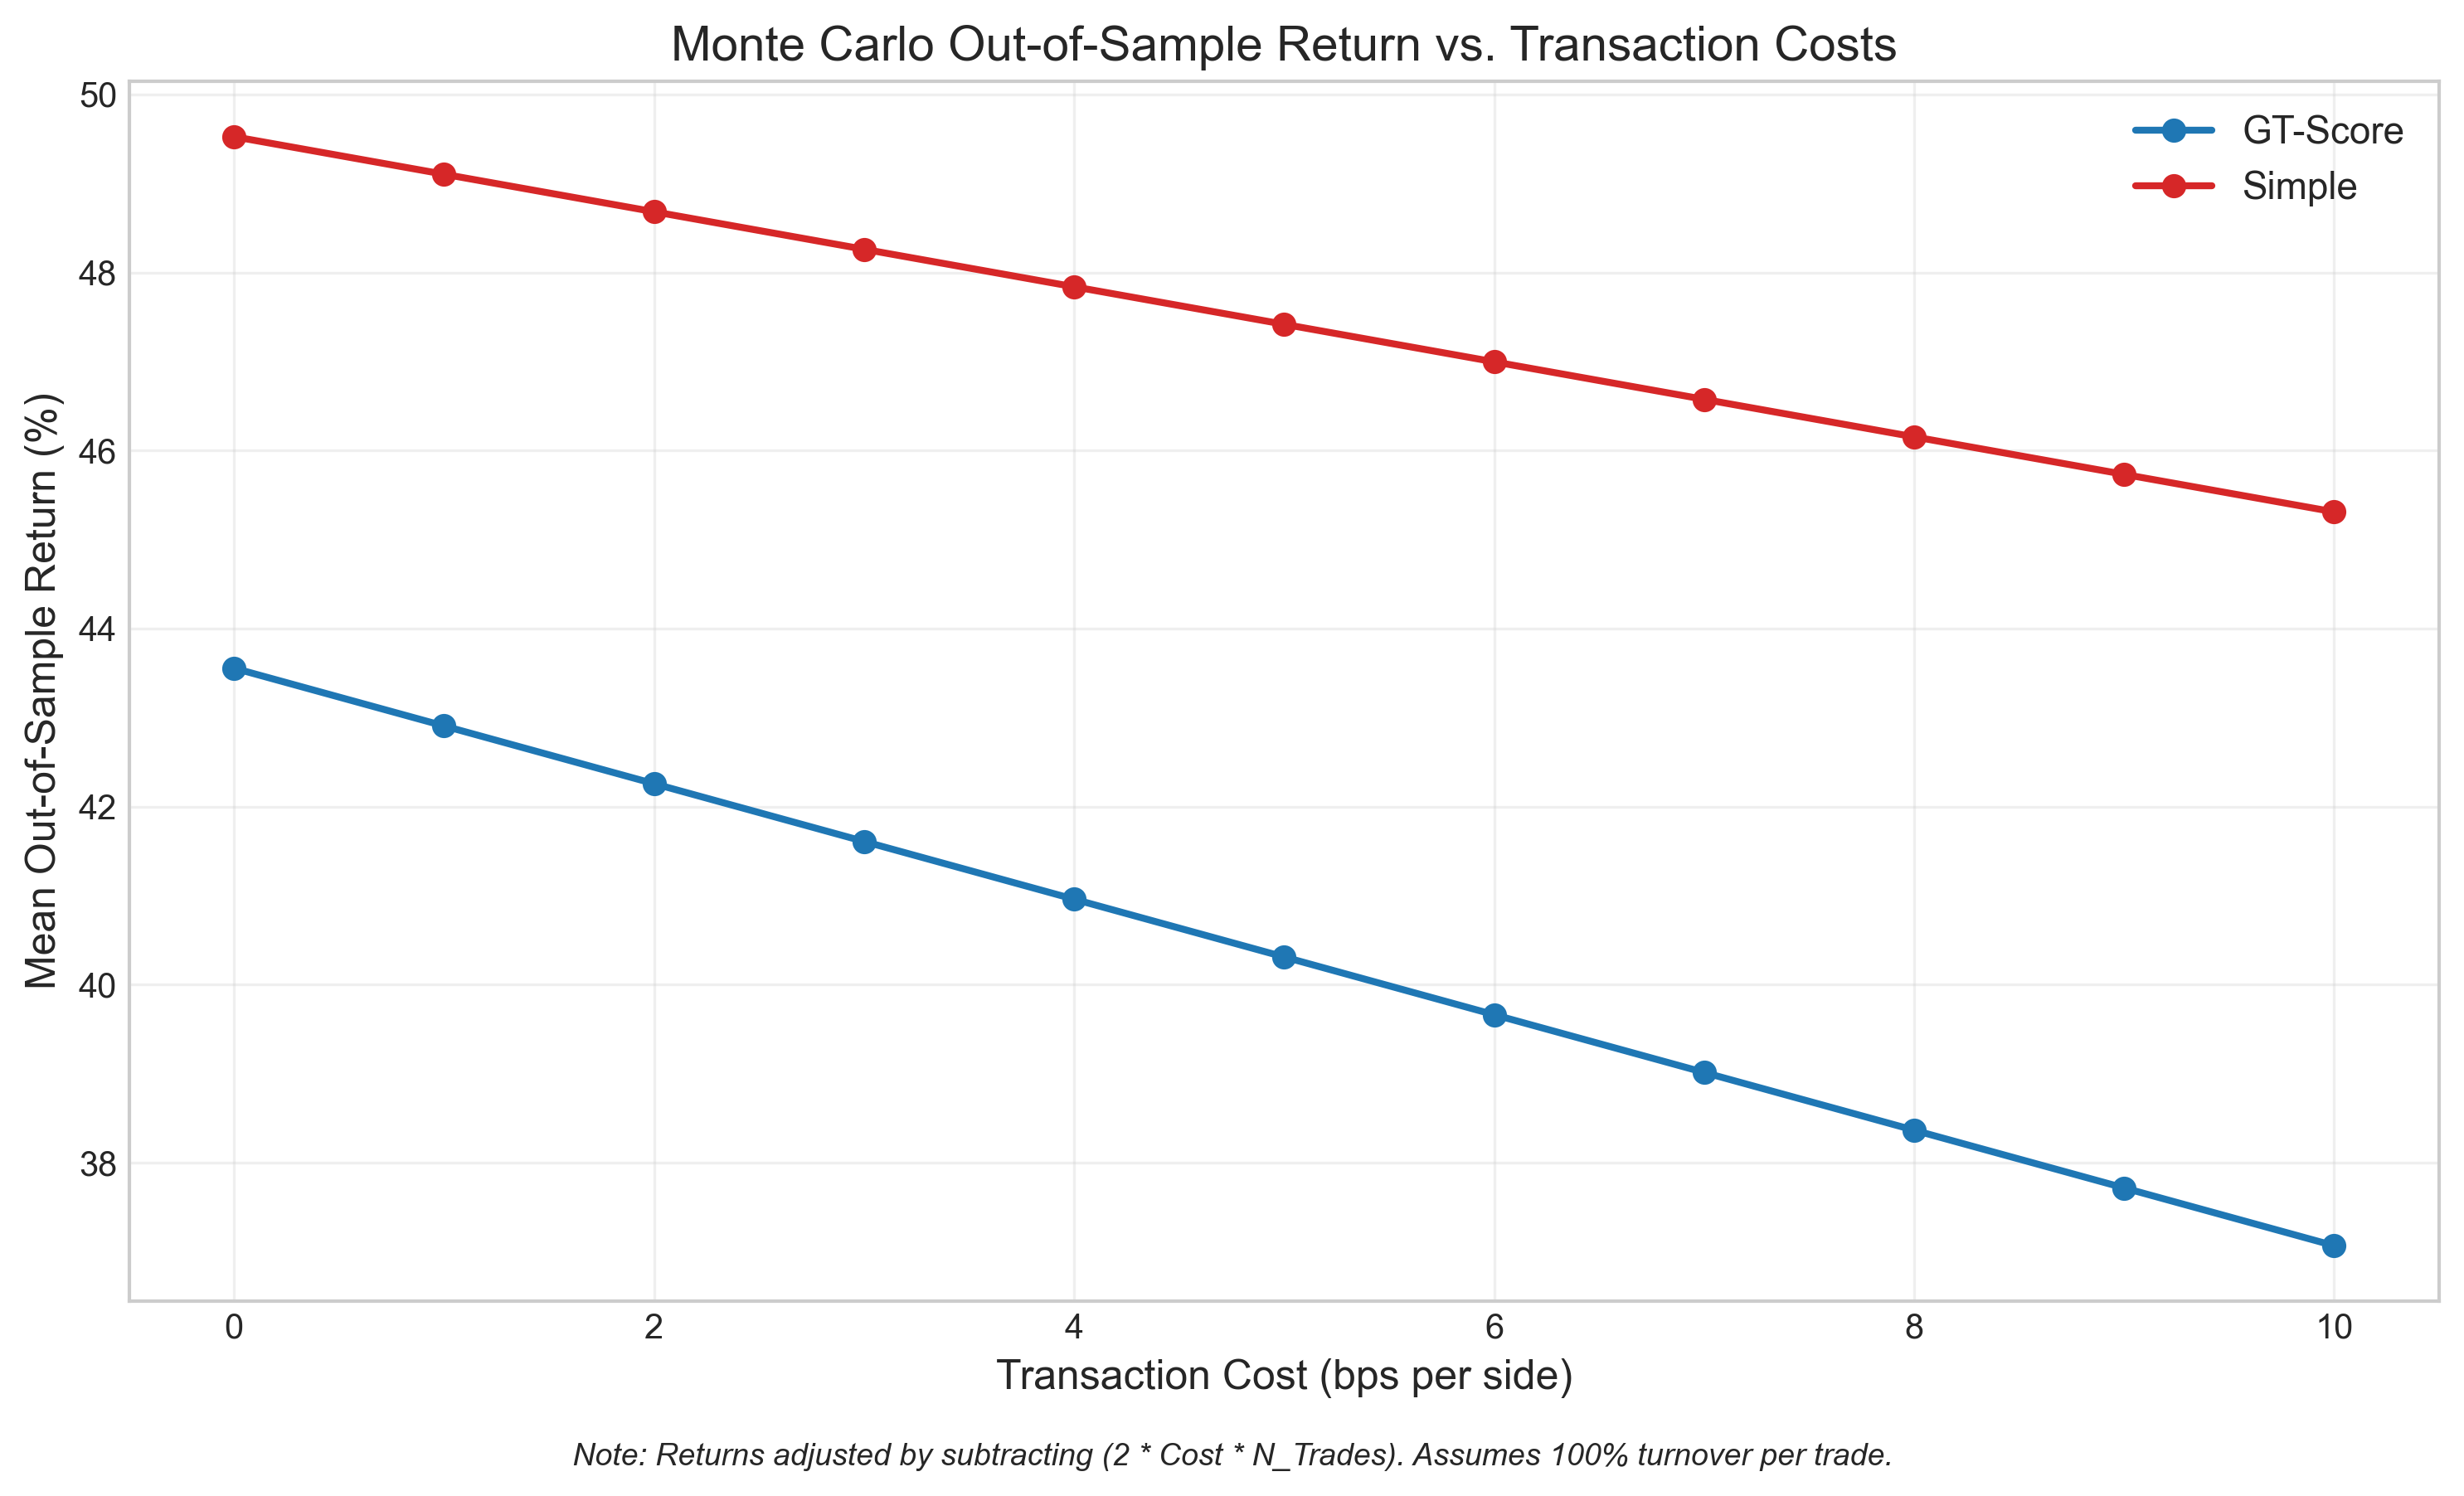
The GT-Score enhances trading strategy evaluation by directly incorporating transaction costs into its objective function, providing a more realistic assessment of viability than methods relying solely on returns. Empirical analysis demonstrates a 98% improvement in generalization ratio – increasing from 0.185 with conventional objective functions to 0.365 with the GT-Score – indicating a substantial reduction in overfitting and improved out-of-sample performance. This improvement suggests the GT-Score is more effective at identifying strategies that consistently perform well across different datasets and market conditions, leading to more robust and reliable optimization results.
Validating Resilience: From Backtesting to Real-World Application
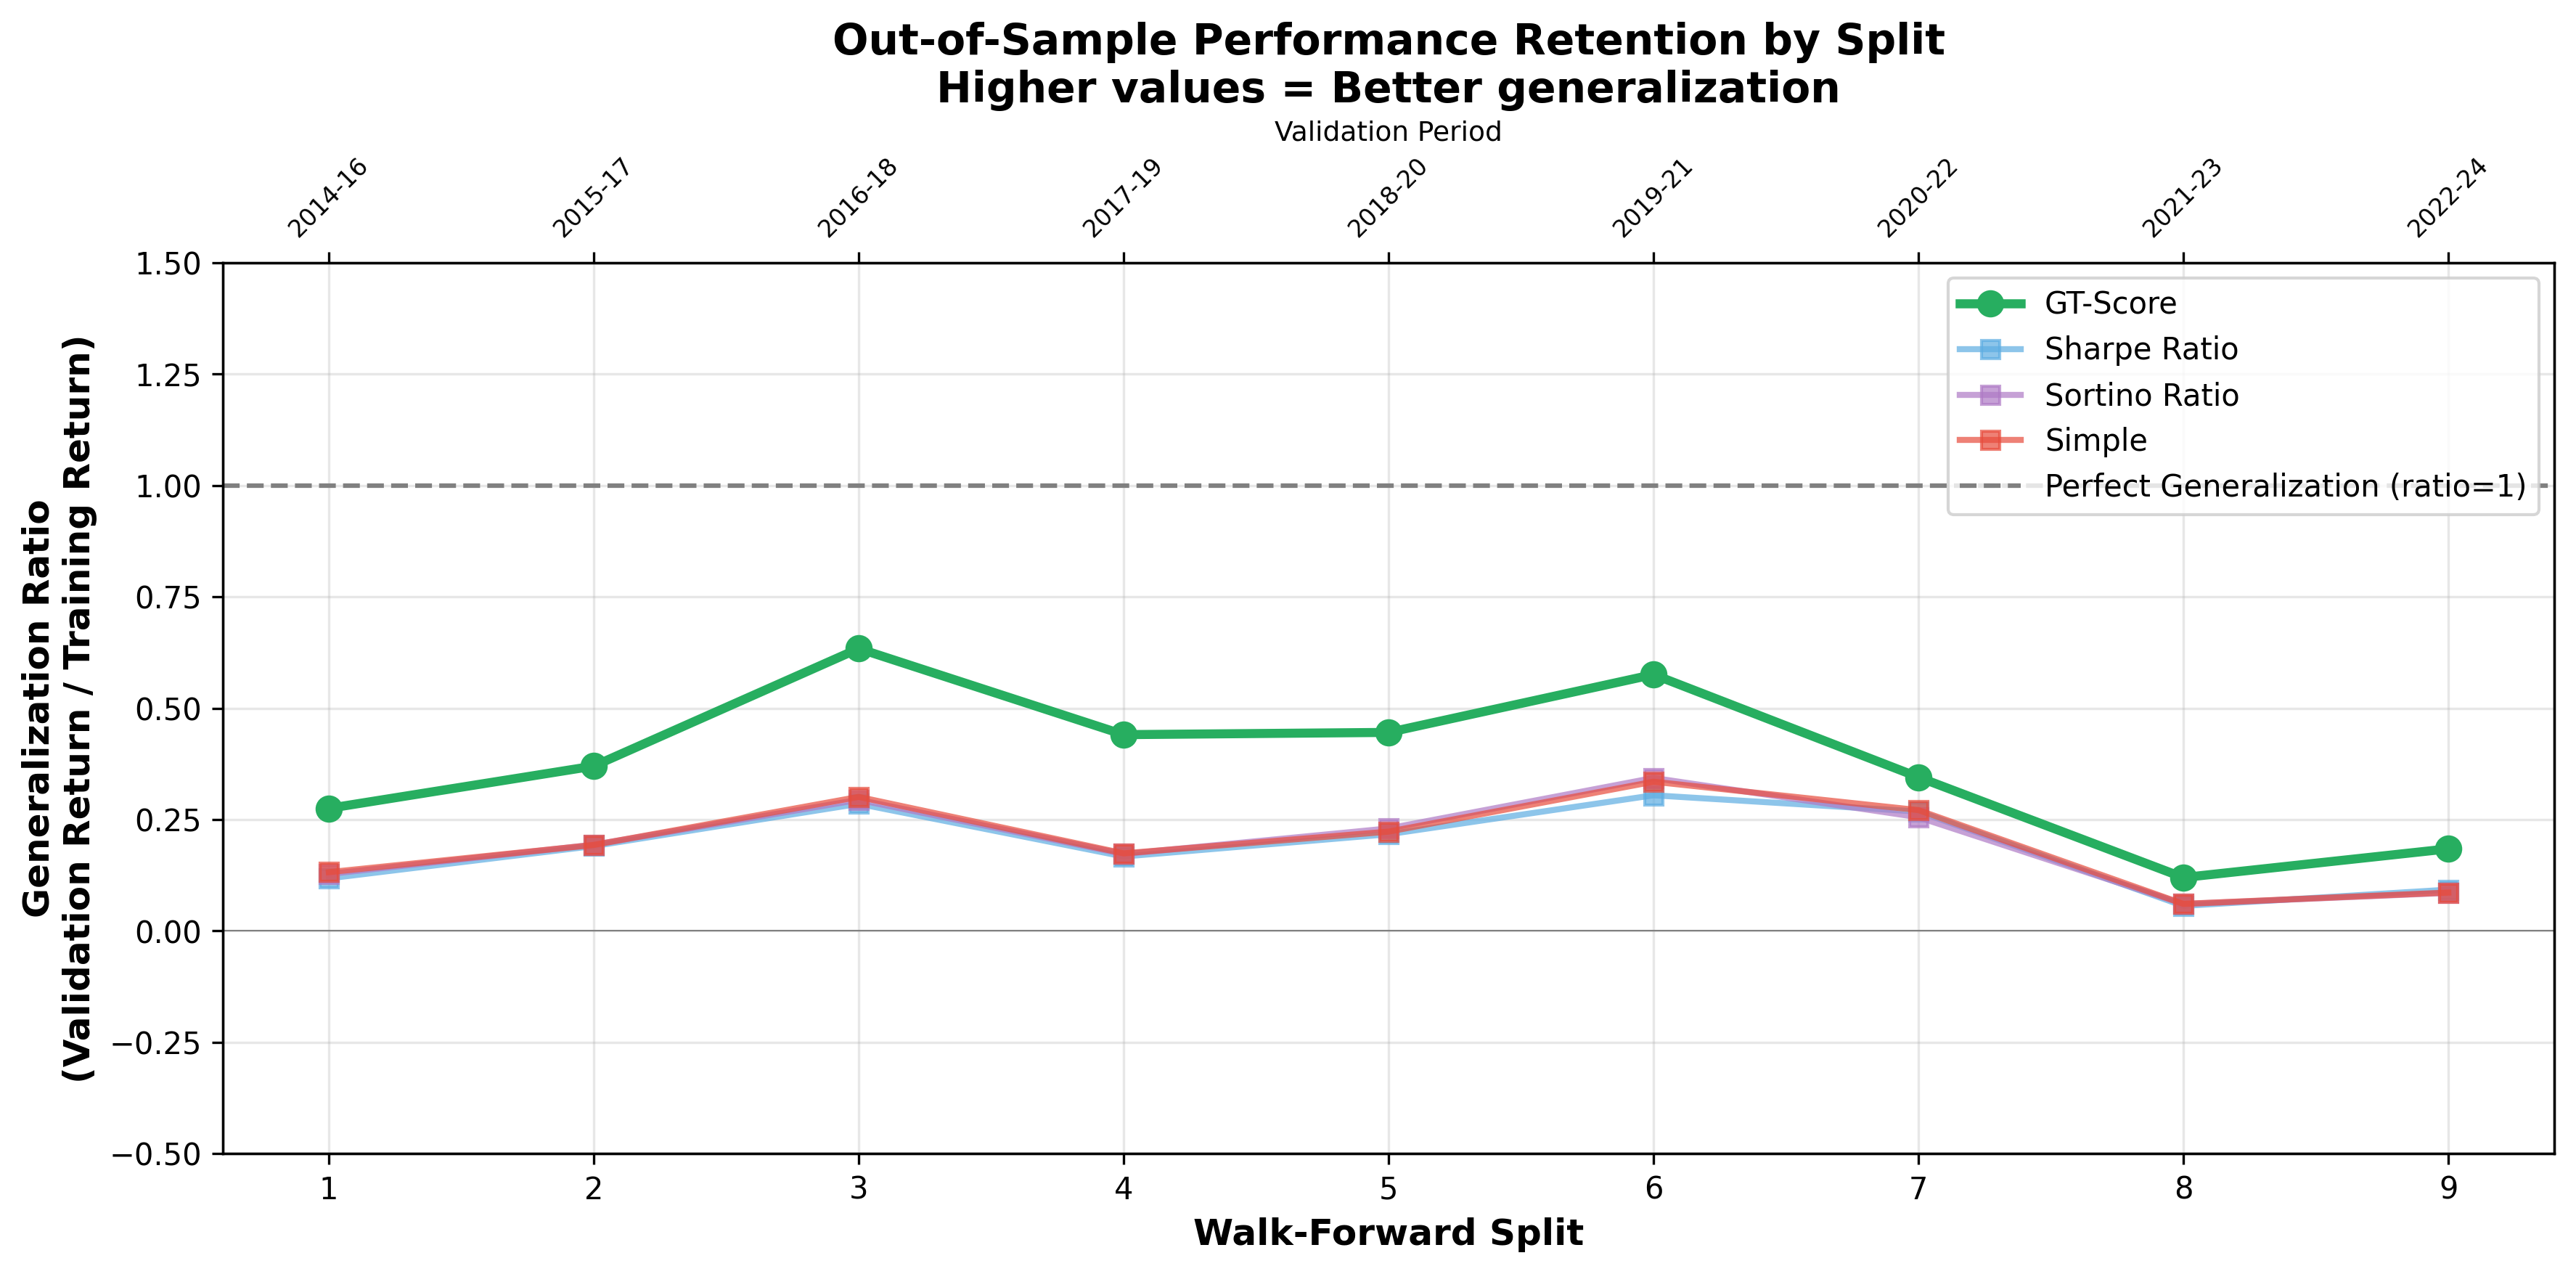
Determining a trading strategy’s true efficacy demands more than simply optimizing it to historical data; robust validation is paramount. Walk-forward validation addresses this by simulating real-world application, sequentially training a strategy on a historical window, testing it on an out-of-sample period, and then rolling this process forward in time. This method rigorously assesses how well a strategy, optimized using metrics like the GT-Score, adapts to evolving market conditions, identifying potential overfitting and ensuring consistent performance beyond the initial training dataset. Unlike backtesting which can present an overly optimistic view, walk-forward validation provides a more realistic appraisal of a strategy’s likely behavior when deployed in live trading, enabling informed decisions about implementation and risk management.
Efficiently identifying optimal trading strategy configurations demands navigating a complex parameter space, a task ideally suited to methods like Random Search and Monte Carlo Analysis. These computational techniques systematically explore numerous parameter combinations, unlike grid searches which can become computationally prohibitive with increasing dimensionality. Random Search operates on the principle that, given enough trials, even randomly selected parameters have a reasonable chance of yielding satisfactory results, while Monte Carlo Analysis employs repeated random sampling to obtain numerical results, allowing for probabilistic assessments of strategy performance under various market conditions. By simulating countless scenarios, these analyses provide a robust means of discovering parameter sets that maximize a strategy’s potential, enhancing its resilience and profitability without requiring exhaustive, and often impractical, manual testing.
The GT-Score provides a systematic approach to identifying potentially successful trading strategies, effectively evaluating common techniques like the Relative Strength Index (RSI), Moving Average Convergence Divergence (MACD), and Bollinger Bands based on a defined set of robust criteria. Recent Monte Carlo simulations, employing out-of-sample returns, demonstrated statistically significant differences in performance between various objectives considered within the scoring system; however, the magnitude of these differences, indicated by small effect sizes, suggests that while the GT-Score can discern between strategies, the practical advantage of any single approach may be modest and requires careful consideration alongside other factors. This rigorous evaluation process aims to move beyond simple backtesting, offering a more comprehensive assessment of strategy viability and enabling informed selection based on quantifiable metrics.
Toward Systems That Endure: Adaptability as the Ultimate Metric
The development of the GT-Score represents a significant step towards creating trading systems capable of dynamically adjusting to evolving market dynamics. This metric, derived from rigorous backtesting and performance analysis, doesn’t offer a static prediction, but rather a quantifiable measure of a strategy’s inherent adaptability. A higher GT-Score indicates a greater likelihood of sustained profitability across a range of conditions, not simply optimal performance in a specific historical period. Consequently, traders and financial institutions can leverage the GT-Score as a foundational element in constructing portfolios that automatically rebalance and modify their approaches as market regimes shift – moving beyond pre-programmed rules to embrace a truly responsive and resilient trading framework. The score facilitates a move toward systems that learn from data and proactively mitigate risks associated with unforeseen events, ultimately bolstering stability and long-term returns.
The future of data-driven trading hinges on sophisticated advancements in both optimization and risk management. Current research explores techniques beyond traditional methods, including Bayesian optimization and reinforcement learning, to dynamically adjust trading strategies in real-time and navigate complex market landscapes. Simultaneously, investigations into robust risk metrics – extending beyond Value at Risk to incorporate measures of tail risk and liquidity – are crucial for safeguarding against unforeseen events. These combined efforts aim to create systems capable of not merely reacting to market changes, but proactively anticipating and mitigating potential losses, ultimately fostering greater stability and resilience within financial markets. The development of these strategies will require increasingly powerful computational resources and the integration of alternative data sources to refine predictive models and enhance their ability to identify and capitalize on subtle market signals.
The pursuit of truly resilient data-driven trading systems hinges on a commitment to thorough evaluation and the acknowledgement of real-world limitations. Simply optimizing for historical performance can yield fragile strategies susceptible to unforeseen market shifts; therefore, robust systems require testing against a diverse array of scenarios, including those deliberately designed to expose vulnerabilities. Crucially, this evaluation must incorporate realistic constraints – transaction costs, liquidity limitations, and regulatory hurdles – often glossed over in idealized simulations. By embracing these complexities, researchers and practitioners can move beyond superficial gains and cultivate adaptive algorithms capable of navigating the inherent uncertainties of financial markets, ultimately fostering stability and unlocking the full potential of data-driven approaches.
The pursuit of optimization, as detailed in this study concerning the GT-Score, inevitably courts the specter of unforeseen consequences. The GT-Score attempts to navigate the treacherous waters of overfitting, acknowledging that any system designed to impose order is, at its core, a temporary reprieve from inherent chaos. This echoes Nietzsche’s observation: “There are no facts, only interpretations.” The GT-Score isn’t a perfect solution, but a framework for interpreting data, a means of delaying the inevitable decay of predictive power. The article’s emphasis on walk-forward validation isn’t about achieving flawless foresight, but rather about building a resilient system – one that acknowledges the transient nature of order and prepares for its eventual unraveling.
What’s Next?
The pursuit of objective functions in quantitative finance continues to resemble a search for a stable point in a chaotic system. The GT-Score offers a demonstrable refinement, a localized decrease in the probability of spurious correlations. However, it does not eliminate that probability. To assume it does is merely to trade one set of unknowns for another, and a guarantee remains a contract with probability. The inherent non-stationarity of markets ensures that any optimization, however sophisticated, is perpetually chasing a receding horizon.
Future work will inevitably focus on adaptive objective functions-systems that evolve with the market, rather than attempting to impose static criteria. But even then, the core problem persists: any model of reality is, by definition, a simplification, and simplification invites failure. The challenge isn’t to build a perfect predictor, but to design systems that gracefully degrade in the face of inevitable error.
Perhaps the most fruitful avenue lies not in refining optimization algorithms, but in accepting that stability is merely an illusion that caches well. The focus should shift toward robust portfolio construction-strategies that prioritize resilience over raw return, and acknowledge that chaos isn’t failure-it’s nature’s syntax. The GT-Score is a step, but the landscape remains largely unexplored.
Original article: https://arxiv.org/pdf/2602.00080.pdf
Contact the author: https://www.linkedin.com/in/avetisyan/
See also:
- Invincible Season 4 Gender Swaps Tech Jacket As Fans Question Major Comic Change
- Building Agents That Learn and Improve Themselves
- Gold Rate Forecast
- Superman Flops Financially: $350M Budget, Still No Profit (Scoop Confirmed)
- Silver Rate Forecast
- Games That Faced Bans in Countries Over Political Themes
- 15 Films That Were Shot Entirely on Phones
- Trading Crypto with AI: A New Approach to Portfolio Management
- Unveiling the Schwab U.S. Dividend Equity ETF: A Portent of Financial Growth
- 22 Films Where the White Protagonist Is Canonically the Sidekick to a Black Lead
2026-02-04 05:07