
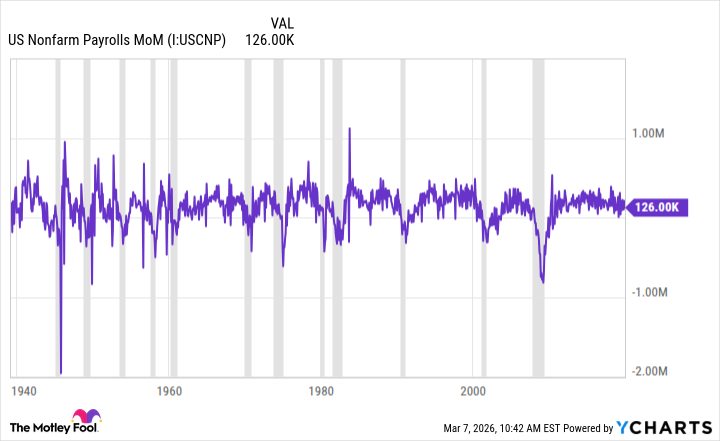
Now, I reckon I’ve seen a good many booms and busts in my time, and let me tell you, this here situation smells a bit like a coming thunderstorm. The numbers from the Bureau of Labor Statistics, they’re tellin’ a tale, and it ain’t a pretty one. February’s report, well, it showed a loss of 92,000 jobs. Not a landslide, mind you, but enough to give a sensible man pause. And that unemployment rate, stayin’ at a low 4.4%, don’t you go thinkin’ that means all’s well. That’s just a maskin’ of the trouble brewin’ underneath.
They revised the January numbers down by 4,000, and December’s by a whopping 65,000! Why, that’s like claimin’ you struck gold, then findin’ out it was just fool’s gold all along. Over the last twelve months, we’ve only added 156,000 jobs. Now, back in 2023, they were churnin’ out that many in a single month! It’s like watchin’ a fine racehorse slow to a limp. A fella ought to be concerned.
| Month | Nonfarm Payroll Monthly Job Change |
|---|---|
| March 2025 | +67,000 |
| April 2025 | +108,000 |
| May 2025 | +13,000 |
| June 2025 | -20,000 |
| July 2025 | +64,000 |
| August 2025 | -70,000 |
| September 2025 | +76,000 |
| October 2025 | -140,000 |
| November 2025 | +41,000 |
| December 2025 | -17,000 |
| January 2026 | +126,000 |
| February 2026 | -92,000 |
| Total | +156,000 |
Now, stagnant job growth, that’s a red flag bigger than a barn. It suggests companies ain’t seein’ much sunshine ahead. They’re either holdin’ tight to their pennies, or preparin’ for a lean spell. And when companies tighten their belts, the folks who feel it first are the workers. Less spendin’ means a slower economy, and that, my friends, is a slippery slope.
This ain’t some abstract notion, mind you. It’s a pattern. Over the last nine months, jobs have been negative five times. Now, the Bureau of Labor Statistics has been keepin’ these records since 1939, and this “5 in 9” business has only happened thirteen times. And each time, it’s been followed by a spell of trouble – recessions, bear markets, the whole shebang. The S&P 500, well, it tends to take a tumble of 20% or more. It’s like clockwork, I tell ya.
- 2026
- 2008-2010
- 2001-2003
- 1990-1991
- 1982-1983
- 1975
- 1970
- 1960-1961
- 1957-1958
- 1954
- 1952
- 1949
- 1944-1945
Look at the chart, if you please. Almost every one of those “5 in 9” periods lines up with a recession. It’s almost… predictable. Now, some folks are sayin’ the economy is still strong, with earnings growin’ at a clip of 11.5%. And GDP grew at 1.4% in the last quarter. But I reckon that’s just a lot of hot air. All this investment in artificial intelligence might be coverin’ up some deep cracks. It’s like paintin’ over a rotten fence.
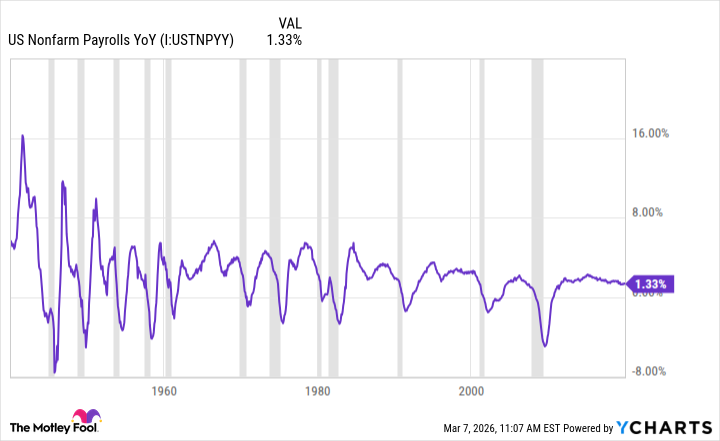
The jobs market, though, it’s tellin’ a different story. Year-over-year nonfarm payrolls have been negative for ten months now. And two of the biggest gains are about to roll off the twelve-month average. So, it’s likely we’ll see a negative number soon. This is a clear signal, and a savvy investor would be a fool to ignore it. I’m not sayin’ a crash is comin’, but I am sayin’ it’s time to batten down the hatches.
This ain’t a game, folks. It’s about protectin’ what you’ve worked for. I’m just a simple man, but I’ve seen enough cycles to know when the wind is about to shift. And right now, I smell a storm brewin’.
Read More
- Top 20 Dinosaur Movies, Ranked
- 20 Movies Where the Black Villain Was Secretly the Most Popular Character
- Celebs Who Narrowly Escaped The 9/11 Attacks
- 25 “Woke” Films That Used Black Trauma to Humanize White Leads
- The 10 Most Underrated Jim Carrey Movies, Ranked (From Least to Most Underrated)
- Transformers Under the Microscope: What Graph Neural Networks Reveal
- The Best Directors of 2025
- Every Notable ‘Star Trek: The Original Series’ Actor Who Died
- 22 Films Where the White Protagonist Is Canonically the Sidekick to a Black Lead
- Trading on Thin Air: AI Agents Conquer Crypto Volatility
2026-03-11 15:53