In the dusty corners of the trading world, where numbers dance like shadows in the twilight, the whispers of change flutter through the air. The WIF token, a creature of both promise and peril, stands at a crossroads, its fate hanging by a thread as indicators flicker like fireflies in the night. Will it soar past the looming resistance, or will it be tethered to the ground by the weight of caution? The trading behavior, a tapestry woven with threads of optimism, hints at a cautious hope, buoyed by rising volumes and the sweet scent of improving technical indicators.
Short-Term Chart Highlights: A Tale of Consolidation and Open Interest Dynamics
On the 1-hour chart of WIF/USDT, the token embarked on a journey in early June, lifting itself from the depths of despair below $0.90 to a dizzying height just above $1.05. This ascent followed a local bottom on June 6, where bullish momentum briefly unfurled its wings. Yet, as the price climbed, it met the cold, hard ceiling of resistance at $1.05, a barrier that now looms like a stubborn mule refusing to budge.
Now, WIF finds itself in a tight consolidation range, hovering around $1.006, a place where the air is thick with anticipation. This phase, dear reader, may very well be the calm before the storm, as price movements near psychological levels attract the attention of both eager traders and the ever-watchful algorithms, creating a delightful chaos of range-bound conditions.
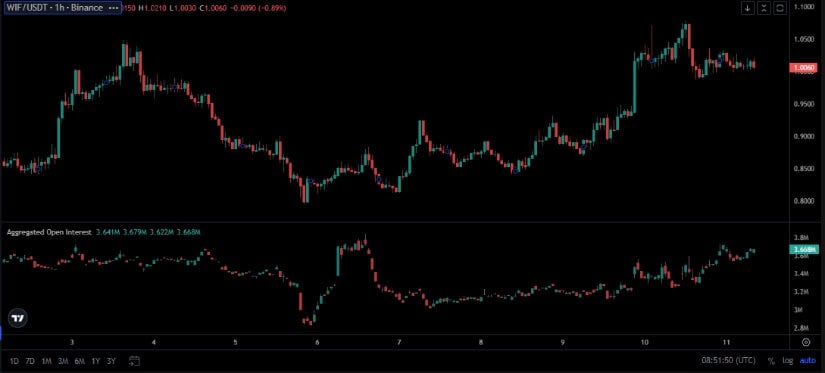
Supporting this short-term trend is the rise in Aggregated Open Interest, which has swelled from below 3.2 million to a robust 3.66 million contracts as the price danced upward. This synchronized growth, a duet of price and open interest, signals a burgeoning participation among traders, their bullish convictions swelling like a tide.
But hold your horses! With the price stalling near recent highs, a note of caution rings clear. If open interest continues to rise without a corresponding price breakout, it may suggest that leveraged long positions are being built at dizzying heights, setting the stage for a potential short-term correction if the momentum falters. Oh, the irony!
Dogwifhat Price Prediction: Daily Metrics Reflect High Participation Amid Intraday Volatility
In the span of a single day, ending June 10, Dogwifhat’s price prediction recorded a cacophony of trading volume and notable price volatility. The token reached an intraday high near $1.08 before succumbing to a gradual selloff, dragging the price down to a low of just under $0.98. A classic tale of rise and fall, reminiscent of the greats.
The rebound that followed placed WIF in a tighter range between $1.00 and $1.03, reinforcing the consolidation structure noted on the hourly timeframe. This compression in price movement, dear friends, typically indicates a market in balance, waiting for a spark to ignite the next move.

Daily volume reached a staggering $496 million, with peak activity aligning with the early price surge. This spike suggests that traders were as excited as kids in a candy store during periods of upward volatility. However, as the day wore on, the volume gradually declined, indicating that market participation cooled like a warm cup of coffee left out too long.
Despite a slight daily decline of 1.15%, Dogwifhat maintains a solid market capitalization of over $1.007 billion, ranking 98th by total market cap. This reflects continued engagement from market participants, with nearly 999 million tokens in circulation, ensuring that the asset’s liquidity profile remains supportive of both short-term speculation and longer-term positioning. Quite the balancing act!
Weekly Indicators Signal Potential Momentum Shift
Additionally, the weekly chart of WIF/USDT shows early signs of a recovery trend. After a prolonged drawdown from highs near $4.01, the asset recently posted a green weekly candle with a gain of 13.16%, closing at $1.006. A glimmer of hope, perhaps?
This upward movement marks the first notable weekly increase in several sessions, a sign that the tides may be turning. However, overhead resistance remains a key obstacle, and a firm break above these zones would be necessary to establish sustained bullish momentum. The road ahead is fraught with challenges, my friends.

The Chaikin Money Flow (CMF) remains negative at -0.15, suggesting that capital outflows still outweigh inflows on a broader scale. Yet, the upward trajectory of the CMF line hints at reduced selling pressure and a possible beginning of accumulation. For confirmation of a trend shift, a move into positive territory would be a critical signal, implying stronger demand-side interest. Fingers crossed!
The MACD indicator reinforces a cautious bullish perspective. A crossover is forming, with the MACD line rising above the signal line and the histogram flipping positive at 0.118. These signals typically reflect an improving momentum profile. However, further confirmation will depend on the price sustaining above key levels with support from rising volume and strengthening CMF. Until those conditions are met, the potential for false breakouts or short-lived rallies remains present. A classic case of “wait and see.”
As WIF continues to stabilize near the $1.00 mark, its ability to maintain and extend gains will depend on broader market sentiment, continued volume support, and validation from longer-term indicators. A breakout above $1.05 with increasing participation would serve as a strong indication of renewed bullish interest. The stage is set, and the audience awaits!
Read More
2025-06-12 00:54