Oh, Bitcoin. That magical internet money that just can’t seem to decide if it wants to be a hero or take a nap. Last week, it took a lovely 3% tumble, dragging the whole crypto crew down like a bad Tinder date. Now, it’s flirting above the $104,000 mark, which, considering its all-time high was a staggering $111,970, feels more like a hiccup than a heartbreak. The macroeconomic pressures are probably busy throwing shade, but don’t worry—market analyst Daan Crypto has a plan. He’s spotted a support zone that might just stop Bitcoin from nose-diving into the abyss. Or not. Who knows? It’s crypto, darling. Nothing is certain, except that we’re all a little poorer and a lot confused.
$97,000-$99,000: The Support Zone or Just a Dream?
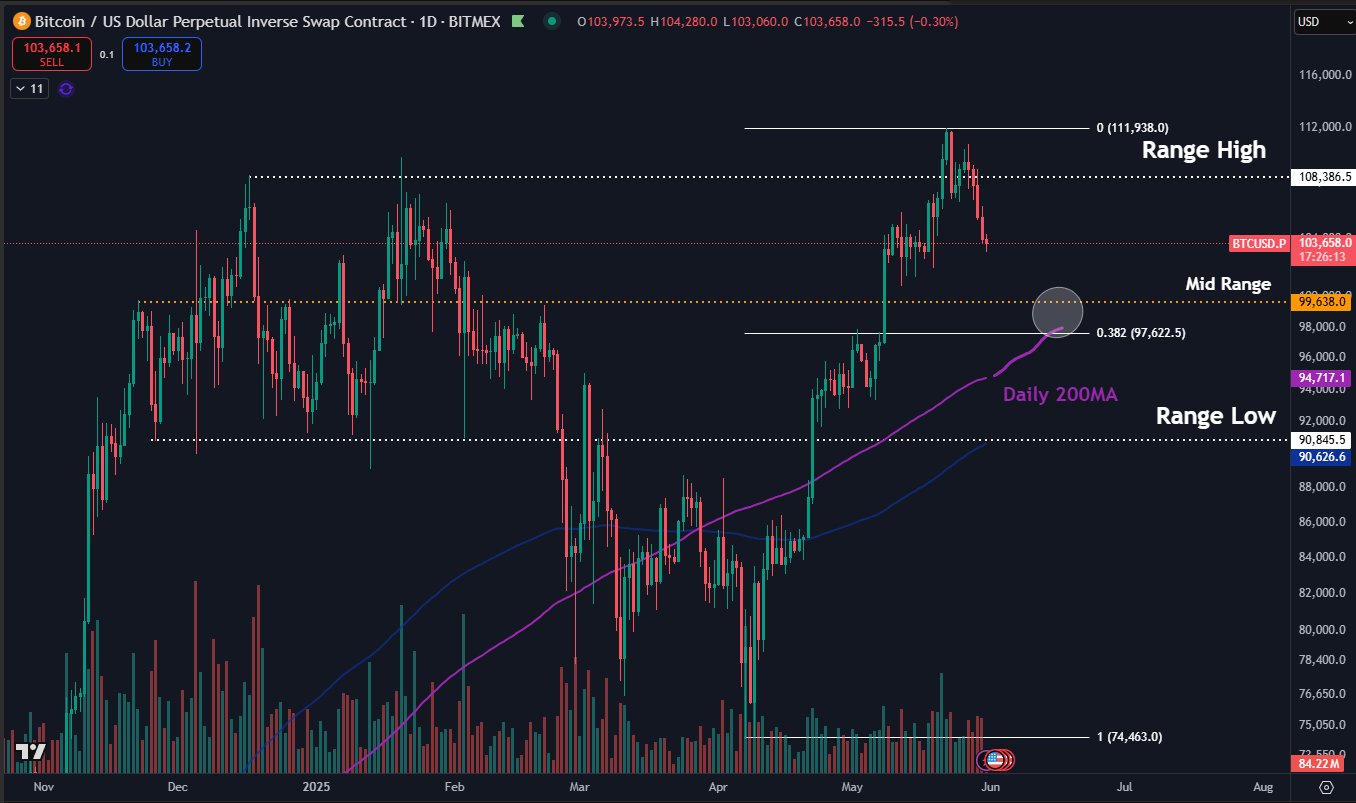
On a charming little platform called X (formerly Twitter), Daan Crypto casually dropped a truth bomb on May 31. His crystal ball suggests that if the price keeps playing hard to get into June, Bitcoin might waltz down to the $97,000-$99,000 range—where it might find a knight in shining armor (or at least a decent resistance). This isn’t just whimsy; it’s backed by some fancy technical indicators. The chart below reveals that this mid-range, located between $90,845 and $108,386, is like the ‘Goldilocks zone’ of Bitcoin trading — not too hot, not too cold, just right for a potential rebound. Plus, it’s got the 200-day moving average and the 0.382 Fibonacci retracement level, which sound like wizardry but are really just fancy tools investors use to predict support (or impending doom). If Bitcoin seriously breaks that support, it might be heading south to a not-so-fun $94,000, and nobody wants that. Well, maybe a few short-sellers sitting smugly in their leather chairs.
In plain speak: the mid-range acts as the crypto equivalent of an OK Corral showdown. Cross that $97,000-$99,000 line, and we’re looking at a potential bearish trend—cue dramatic music. The Fibonacci retracement suggests prices want to “pull back” like a toddler who just had too much sugar before resuming their misadventures. Meanwhile, the 200-day moving average is like grandma’s knitting—steady, patient, and ready to support you when you’re feeling weak. All this mumbo jumbo implies that if Bitcoin dips below this support zone, we might all need to invest in more popcorn for watching it crash. Or, maybe, just maybe, it’ll hold. Fingers crossed.
Bitcoin Now: Up, Down, or Just Confused?
As of the latest update, Bitcoin is strutting at around $104,650, up a tiny 0.14% since yesterday—like a plucky little kitten chasing a laser pointer. Over the last month, it’s up by 7.21%, proving that hodlers (those brave souls who still believe) are, at least, in the green. However, a 2.86% drop this week reminds us that crypto is basically a rollercoaster designed by a caffeinated squirrel. Clearly, we need some market demand to surge and save us from a prolonged bearish hangover. Or we can just sit back, clutch our coins, and hope for the best—because in crypto, that’s basically the plan.

Read More
- Apothecary Diaries Ch.81: Maomao vs Shenmei!
- 30 Best Couple/Wife Swap Movies You Need to See
- Gachiakuta Chapter 139: Rudo And Enjin Team Up Against Mymo—Recap, Release Date, Where To Read And More
- Netflix’s ‘You’ Season 5 Release Update Has Fans Worried
- Every Minecraft update ranked from worst to best
- Ncuti Gatwa Exits Doctor Who Amidst Controversy and Ratings Crisis!
- Zenless Zone Zero 2.0 – release date, events, features, and anniversary rewards
- All 6 ‘Final Destination’ Movies in Order
- DC: Dark Legion The Bleed & Hypertime Tracker Schedule
- How Much Time Does It Take To Beat Tainted Grail The Fall of Avalon?
2025-06-02 01:12