On May 10, 2025, Bitcoin was flip-flopping like a politician in an election year. Bulls and bears were locked in a standoff so tense, you could cut it with a gefilte knife. With $2.057 trillion in market cap and $26.69 billion shuffled around like poker chips at a Vegas table, Bitcoin wobbled between $102,526 and $103,938 before closing at $103,559. In other words: it’s taking a breath, eating a brisket, and deciding where to go next.
Bitcoin
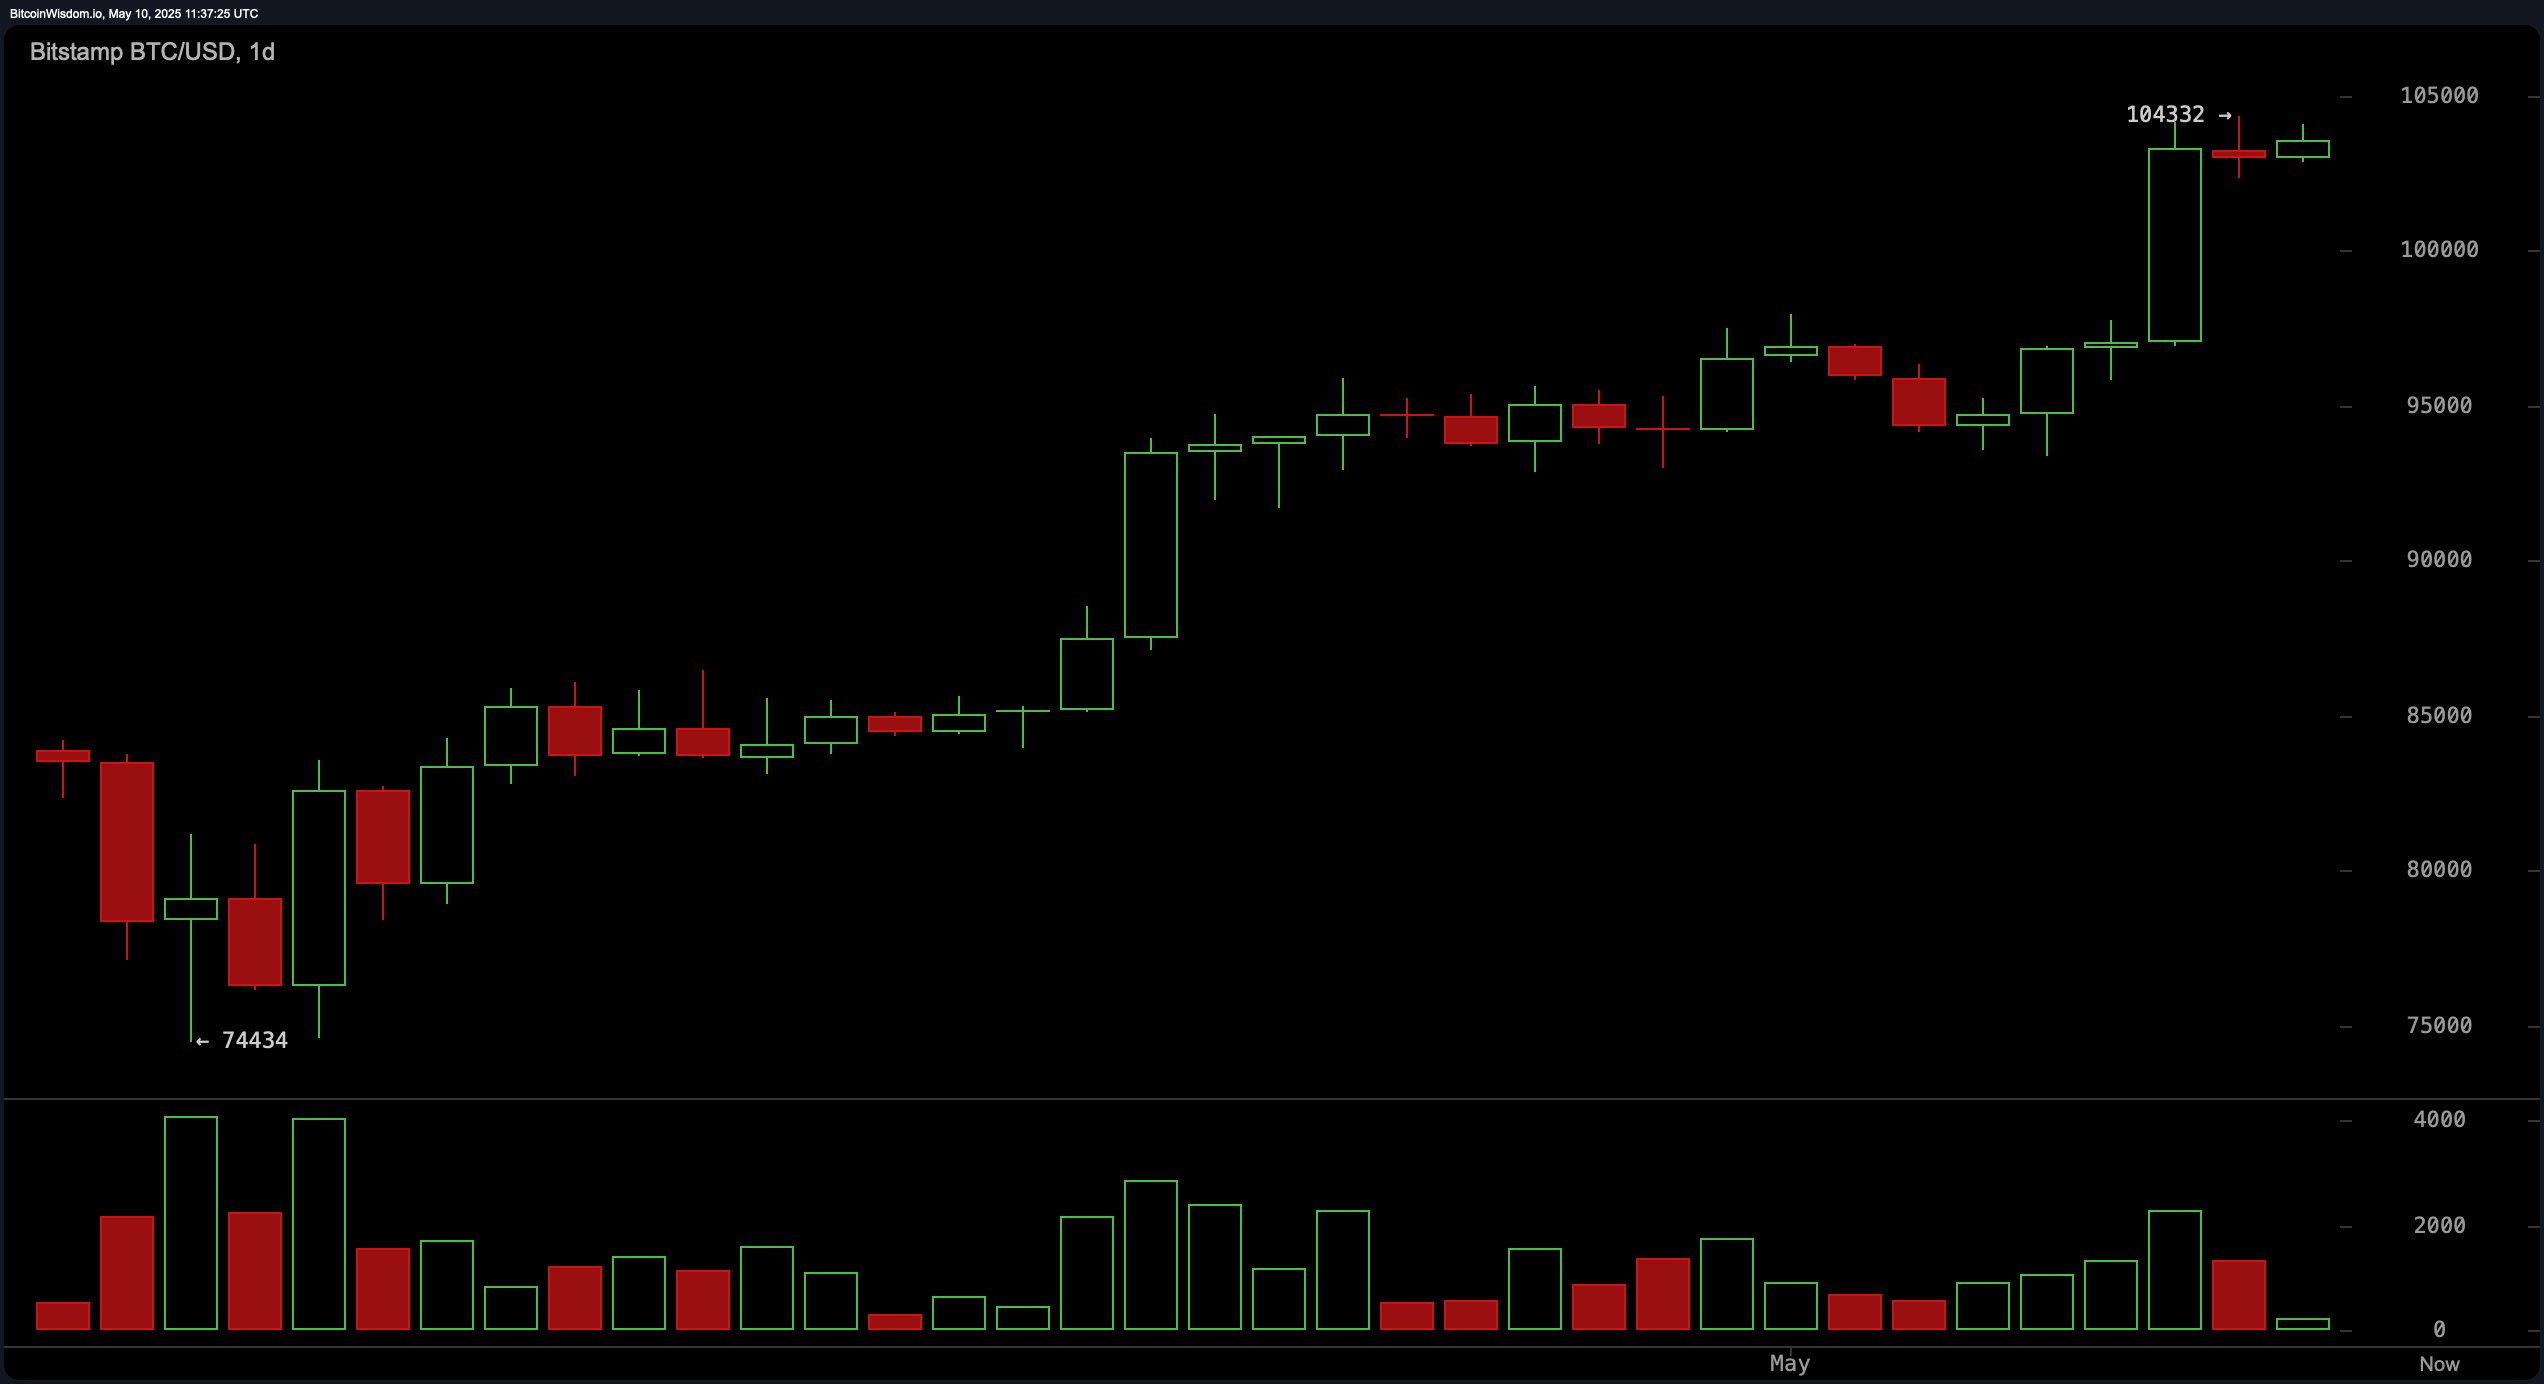
Looking at the daily chart, bitcoin (BTC) is still climbing like it’s got a rocket strapped to its back—and a mother yelling “Higher, already?!” After putting down roots at $74,434, it zoomed to $104,332, which is apparently where everyone gets nosebleeds. Daily candlestick bodies are now tiny – it’s like they’re watching their weight while waiting for the next big feast. Volume went up during the last surge, which means this party might not be over. Buy in around $97,000–$98,000 and hope for the heavens above $105,000. But remember: past $104,000, anything can happen—except sanity.
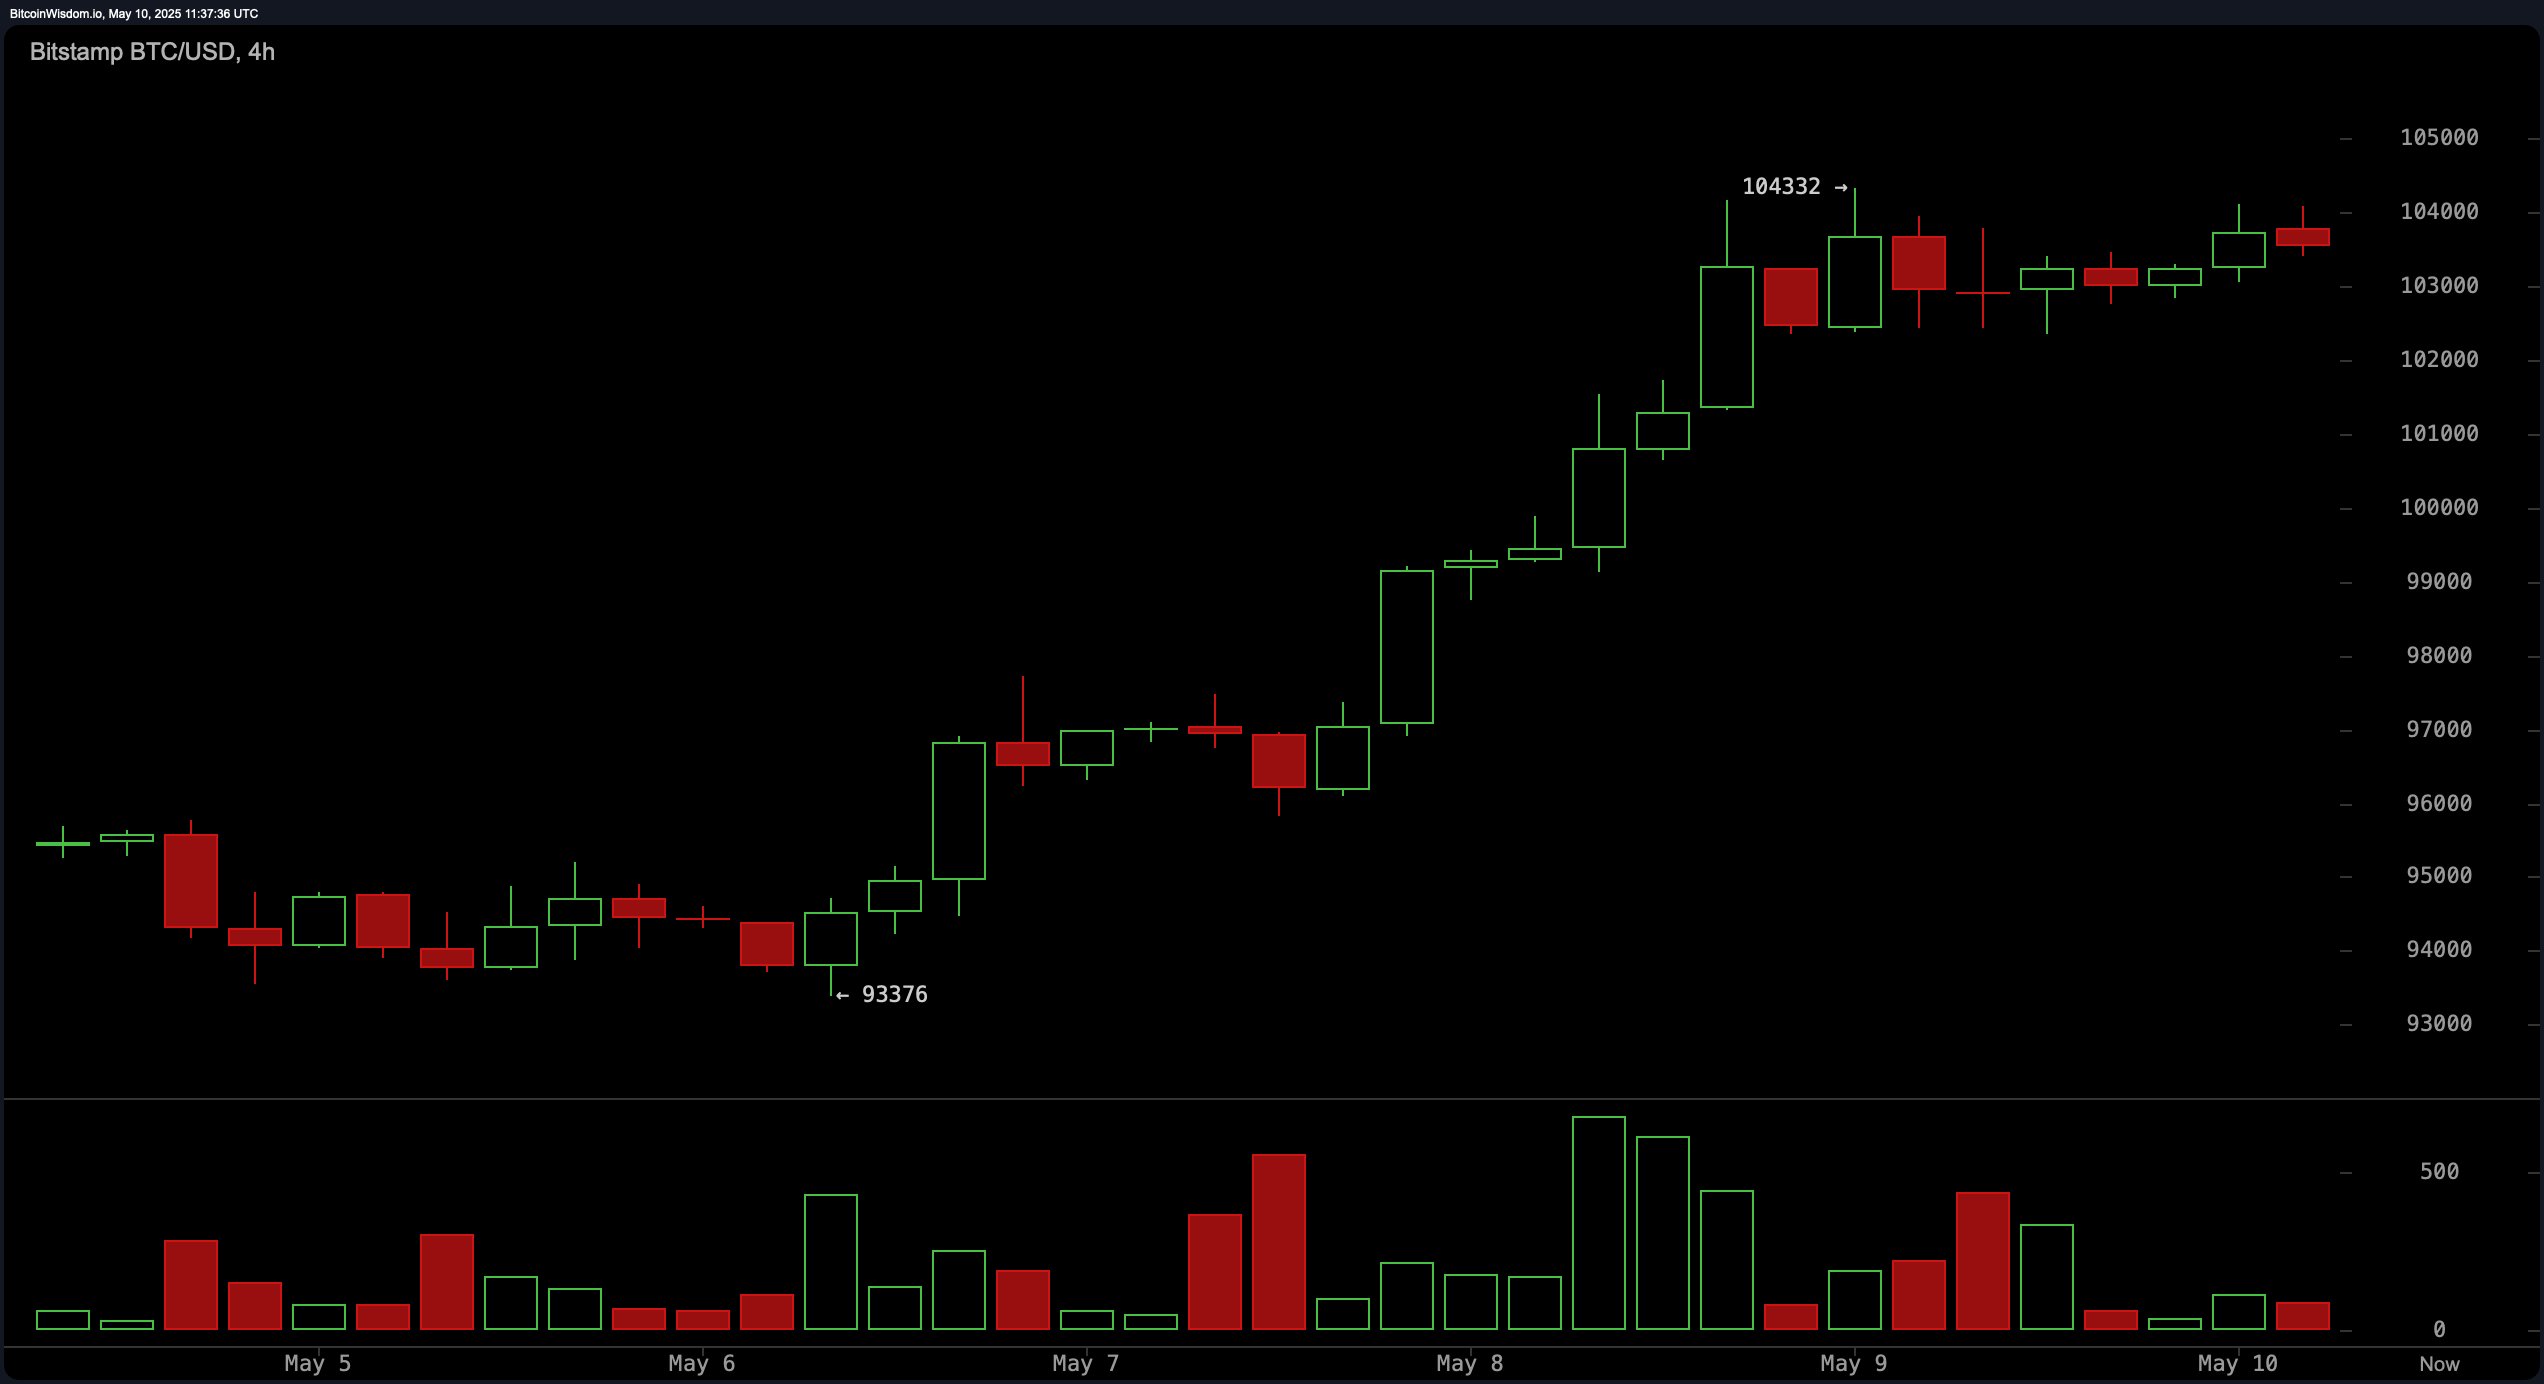
The 4-hour chart says, “Hey, I can do the cha-cha!” Bitcoin did a little dip to $93,376 and then started making higher highs and higher lows, like a Broadway dancer trying to impress the critics. The latest candles whisper, “Maybe let’s take some profits, nu?” because the volume is falling faster than my hopes at a singles mixer. If the price does the shimmy and stays above $103,000–$103,200—mazel tov! Could see another run at $104,332. But a slip below $102,000? That’s your cue for a dramatic pause and a possible sad trombone down to $99,000.
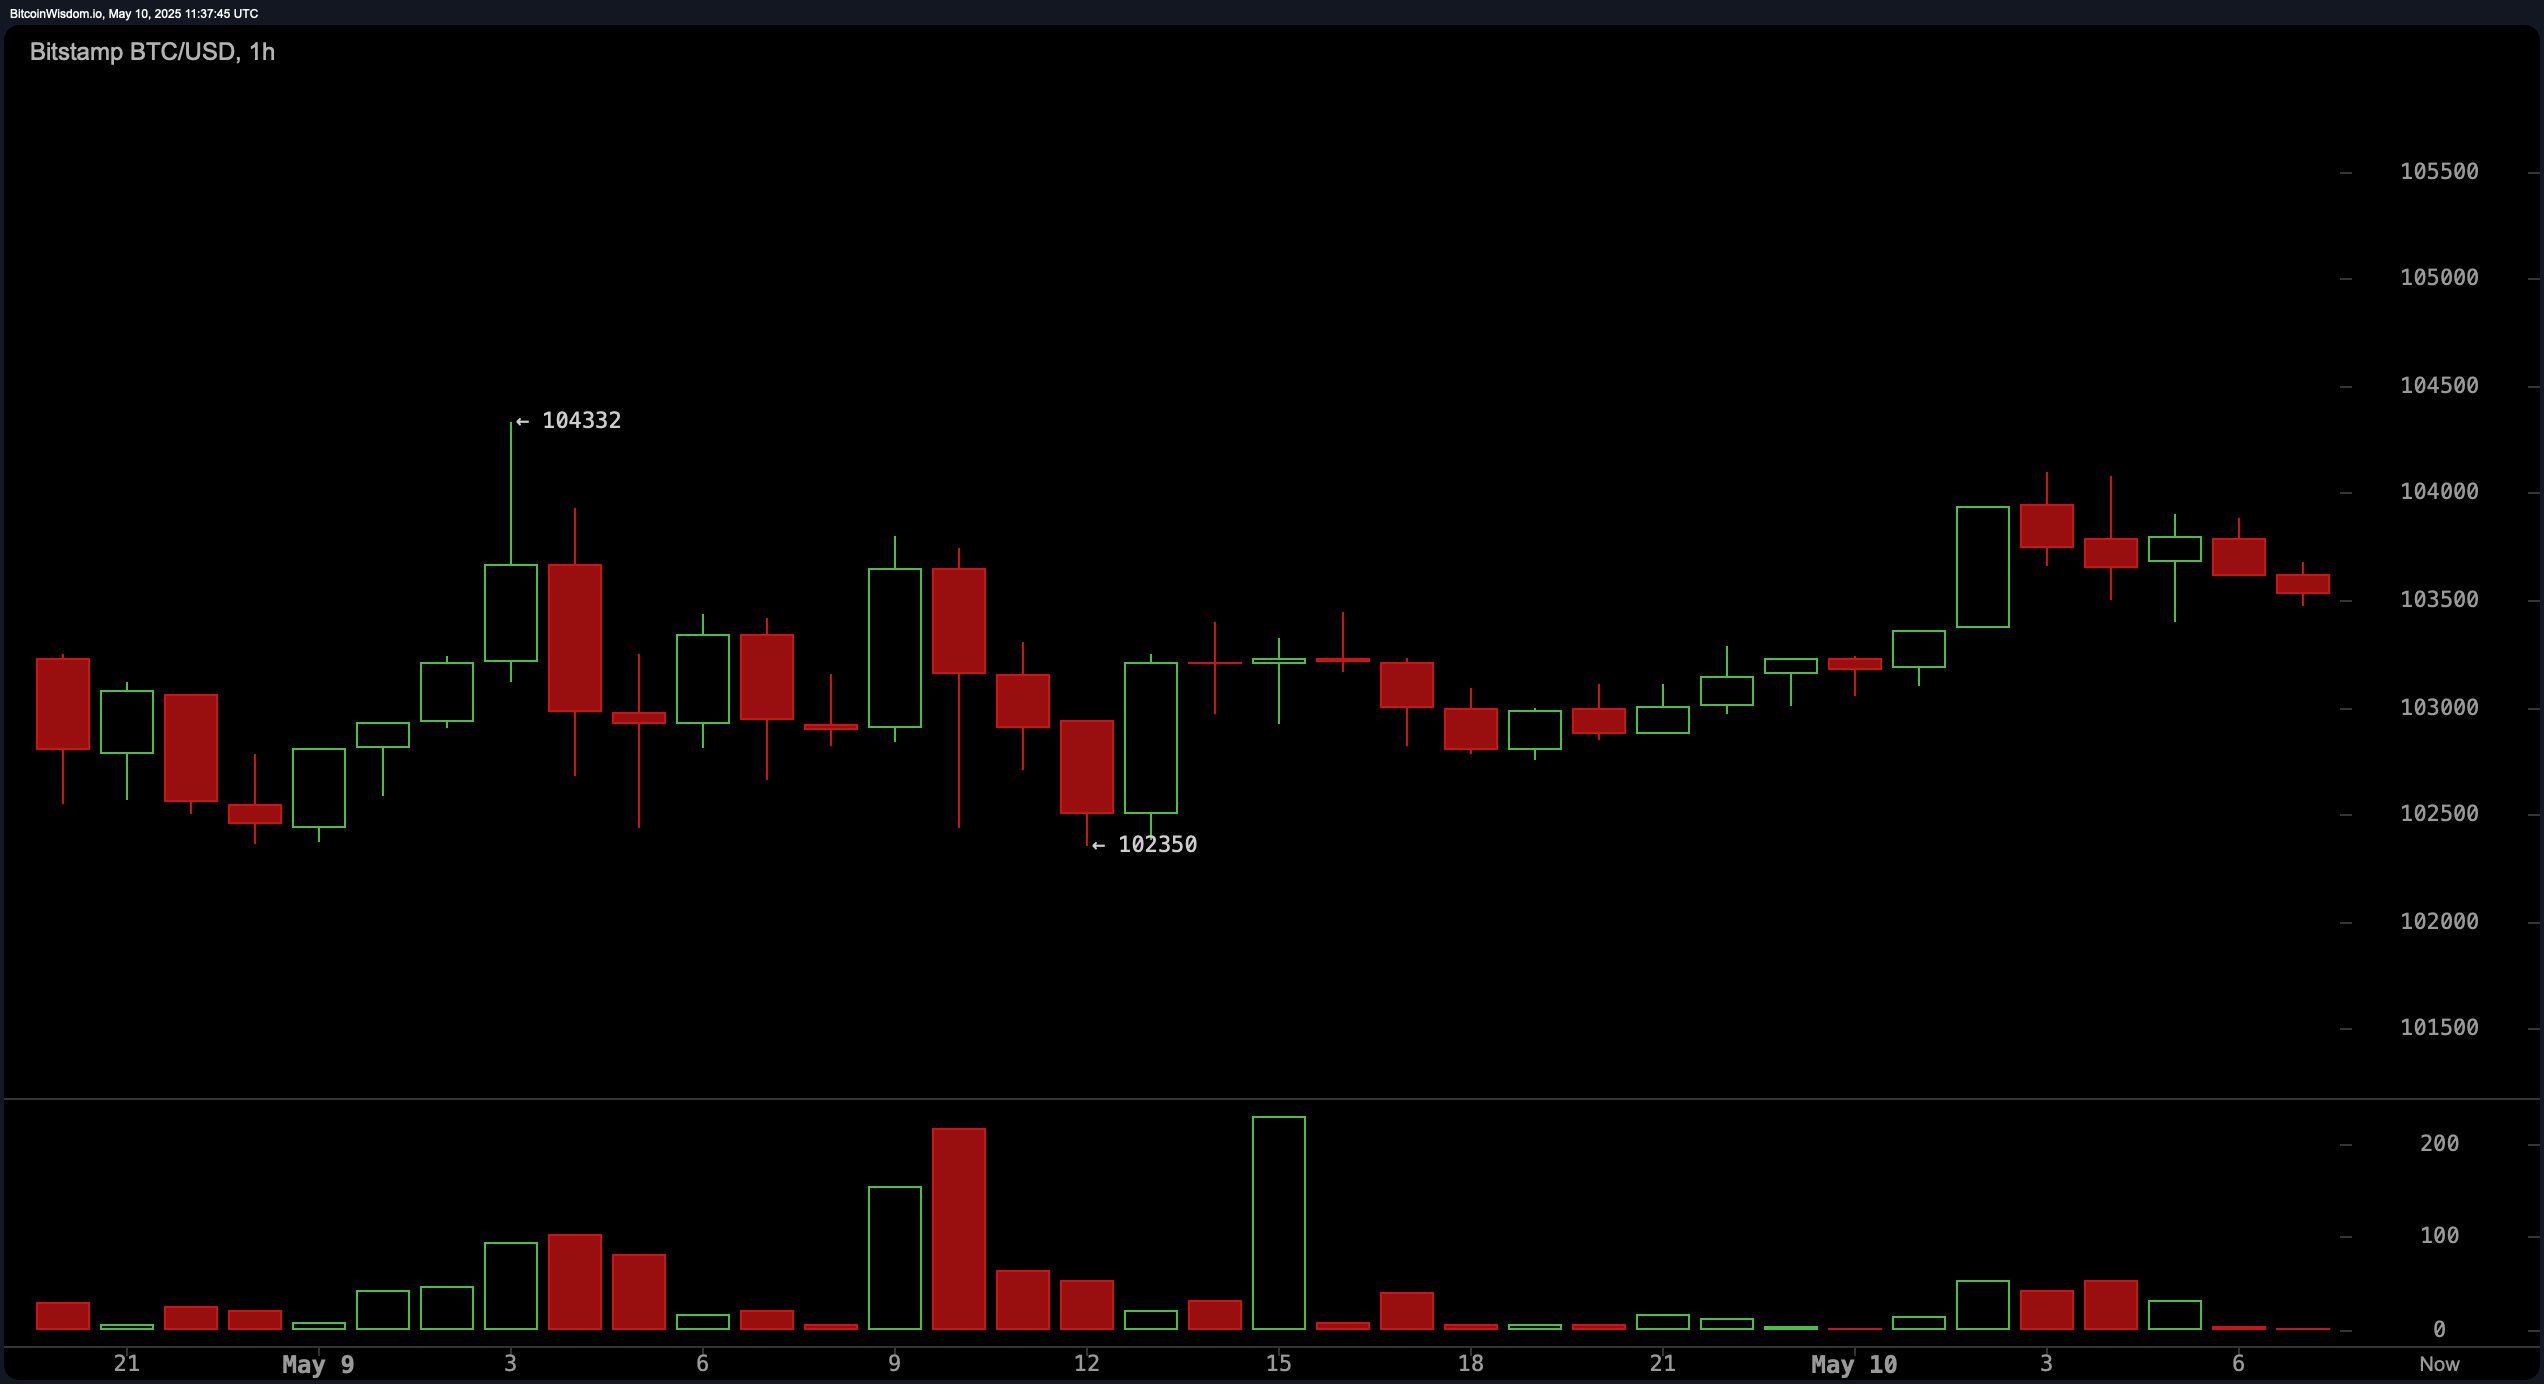
Over on the 1-hour chart, it’s so range-bound you’d think it was on house arrest. Bitcoin tapped $104,332 and schlepped itself back to $102,350. Lots of red candles recently—someone call a lifeguard! The volume’s so light, it’s practically on a diet. The market’s more indecisive than my cousin picking a deli sandwich. Scalpers: go nuts between $102,300 and $104,300. For everyone else, wait for a heroic leap above $104,400—and check for a pulse in the volume first. Otherwise, prepare for a sideways nap.
Oscillators—fancy technical things, don’t worry, Ma, I’ll explain—are all having an argument in the other room. RSI at 75 and Stochastic at 91 both say, “It’s overbought!” But are they worried? Nah. The CCI at 206 shouts “SELL!” while momentum and MACD mumble, “Buy, schlemiel!” The Awesome Oscillator and ADX shrug and go, “Eh, we’re neutral.” Basically, nobody can agree—a typical family dinner. The market’s waiting for a sign…or a therapist.
Moving averages? They’re cheering like it’s opening night on Broadway. Every EMA and SMA in sight—10, 20, 30, 50, 100, 200—you name it, it’s all bullish. The 10- and 20-period are waving banners at $98,883 and $98,201. Long-term average? Upward as far as the eye can see. Unless a black swan flies through the window, the outlook’s as sunny as a Miami retirement community.
Bull Verdict:
Technically, the bulls are dancing the Hora. Every moving average is in line, the structure is strong, and unless the floor falls out or someone pulls a rug (again!), we could retest $104,332 and maybe even get a standing ovation. 🕺💰
Bear Verdict:
But—there’s always a but—there’s some tsuris on the short-term charts. Weak oscillators, low volume, red candles… If Bitcoin trips below $102,000 and the selling snowballs, expect a quick kvetch down to $99,000 while the crowd boos from the balcony. 🐻😭
Read More
- Margaret Qualley Set to Transform as Rogue in Marvel’s X-Men Reboot?
- Does Oblivion Remastered have mod support?
- Thunderbolts: Marvel’s Next Box Office Disaster?
- To Be Hero X: Everything You Need To Know About The Upcoming Anime
- Clair Obscur: Expedition 33 ending explained – Who should you side with?
- 30 Best Couple/Wife Swap Movies You Need to See
- DC: Dark Legion The Bleed & Hypertime Tracker Schedule
- Everything We Know About DOCTOR WHO Season 2
- Demon Slayer: All 6 infinity Castle Fights EXPLORED
- DODO PREDICTION. DODO cryptocurrency
2025-05-10 15:48