It seems Ethereum, once the shining beacon of hope in the cryptocurrency world, is spiraling downward with such grace that even the most pessimistic trader couldn’t have predicted. A rare chart pattern is flashing a red alert, screaming, “Brace yourselves!”
Ethereum (ETH) recently plummeted to 0.01890 – its lowest point since January 2020 – and it’s now a staggering 80% below its 2021 high. The once mighty cryptocurrency seems to be taking a well-deserved nap at the bottom of the price chart. A true underdog story… except it’s a story of failure, not triumph. 👀
But wait, the plot thickens! As Ethereum falls into a pit of despair, it is losing market share across nearly every sector of the crypto industry. A dramatic drop in its DeFi market share tells us everything we need to know. According to DeFi Llama, Ethereum processed a mere $56 billion in April – pitiful when compared to Solana’s (SOL) $72 billion. Oh, the irony. Ethereum, once the hero of decentralized finance, is now in a race to avoid last place. 🏃♂️💨
Even worse, layer-2 networks are swooping in like a pack of wolves circling a wounded deer. These networks, designed to improve scalability and speed, are steadily eating Ethereum’s lunch. Base, created by Coinbase, processed a whopping $20 billion in April, while Arbitrum handled $14.3 billion. In theory, Ethereum would have handled those transactions… but, well, here we are. 😅
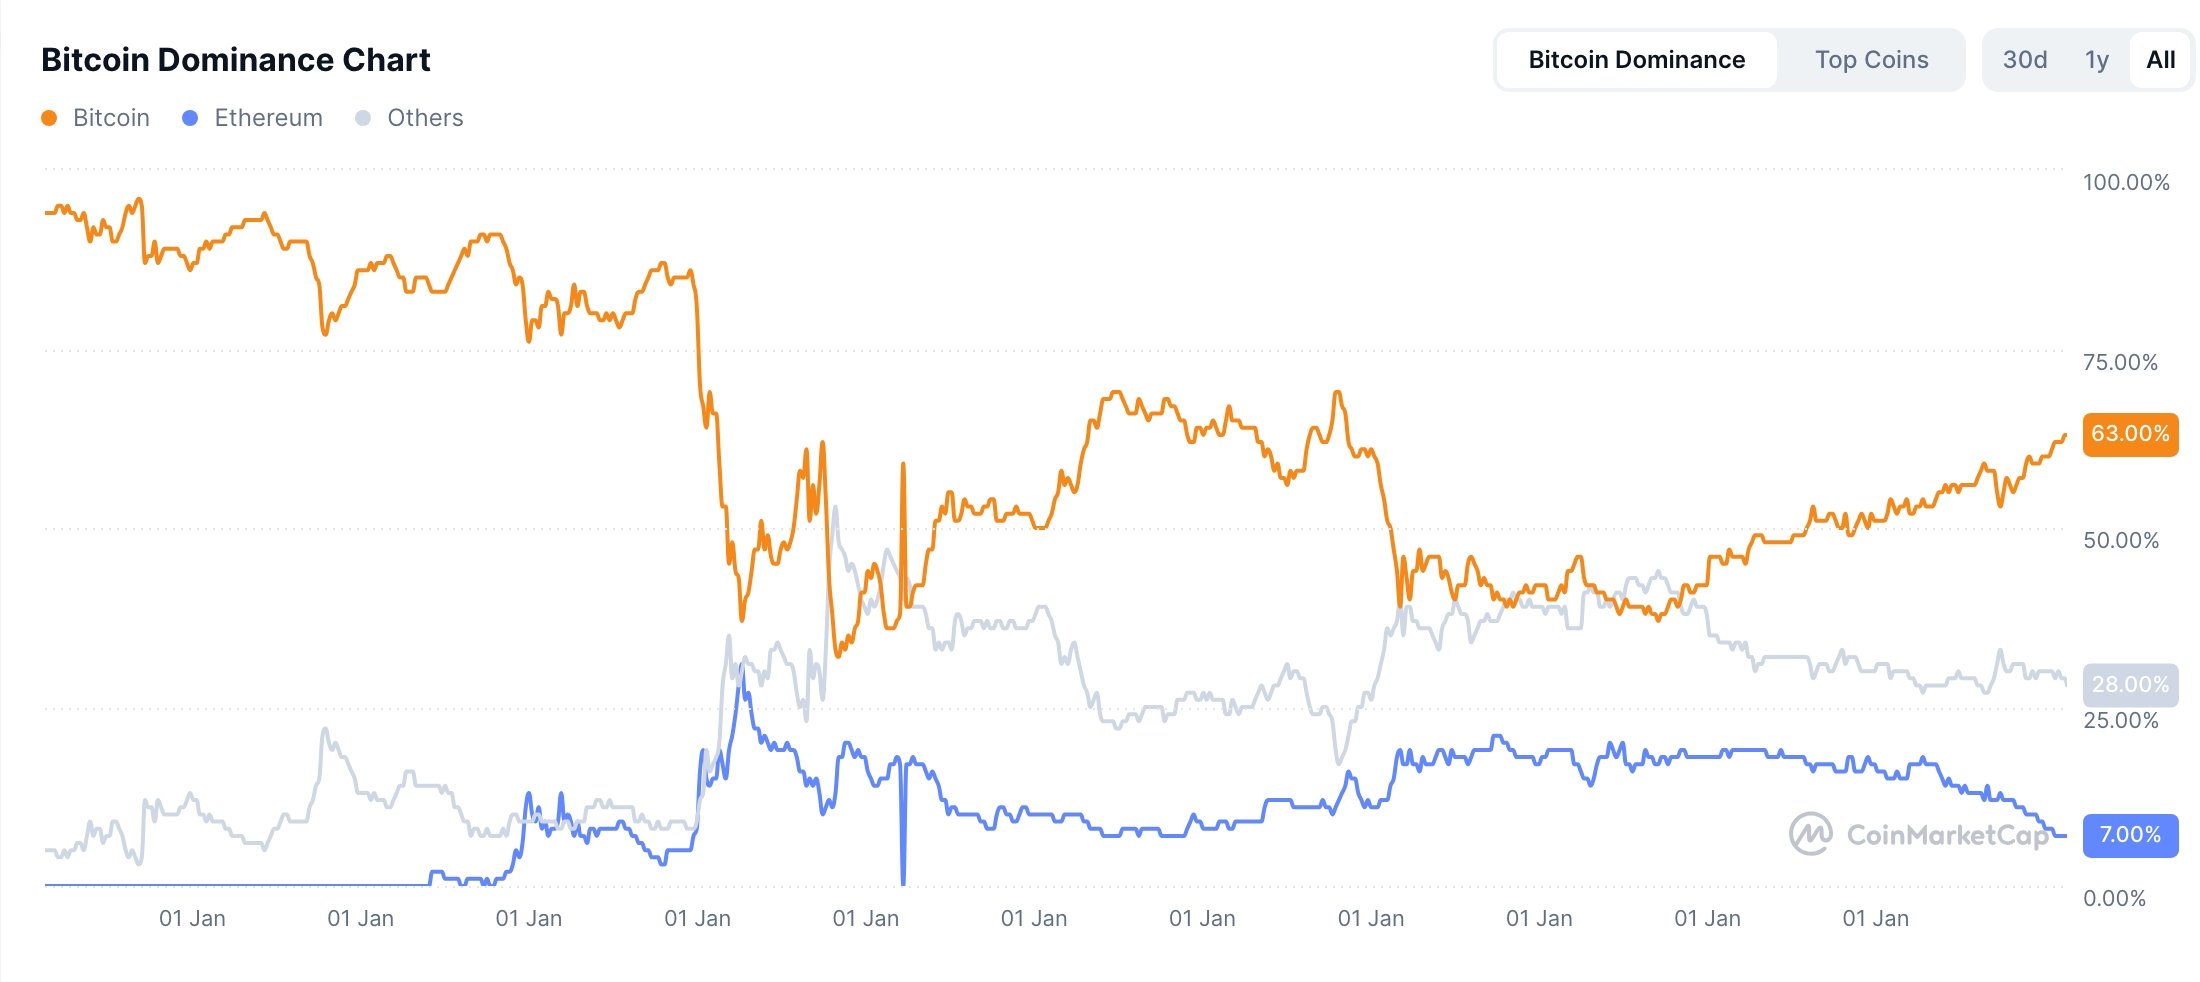
Meanwhile, Bitcoin has seized the crypto throne once again. With dominance soaring to 63% (a staggering increase from a meager 18% earlier this year), Bitcoin’s market power is reminiscent of a heavyweight champion throwing punches left and right. Ethereum, on the other hand, is barely standing, with a market share of just 7%. That’s right, 7%. It’s almost nostalgic – reminiscent of the good old days in April 2018. 🥊
Ethereum Price Technical Analysis
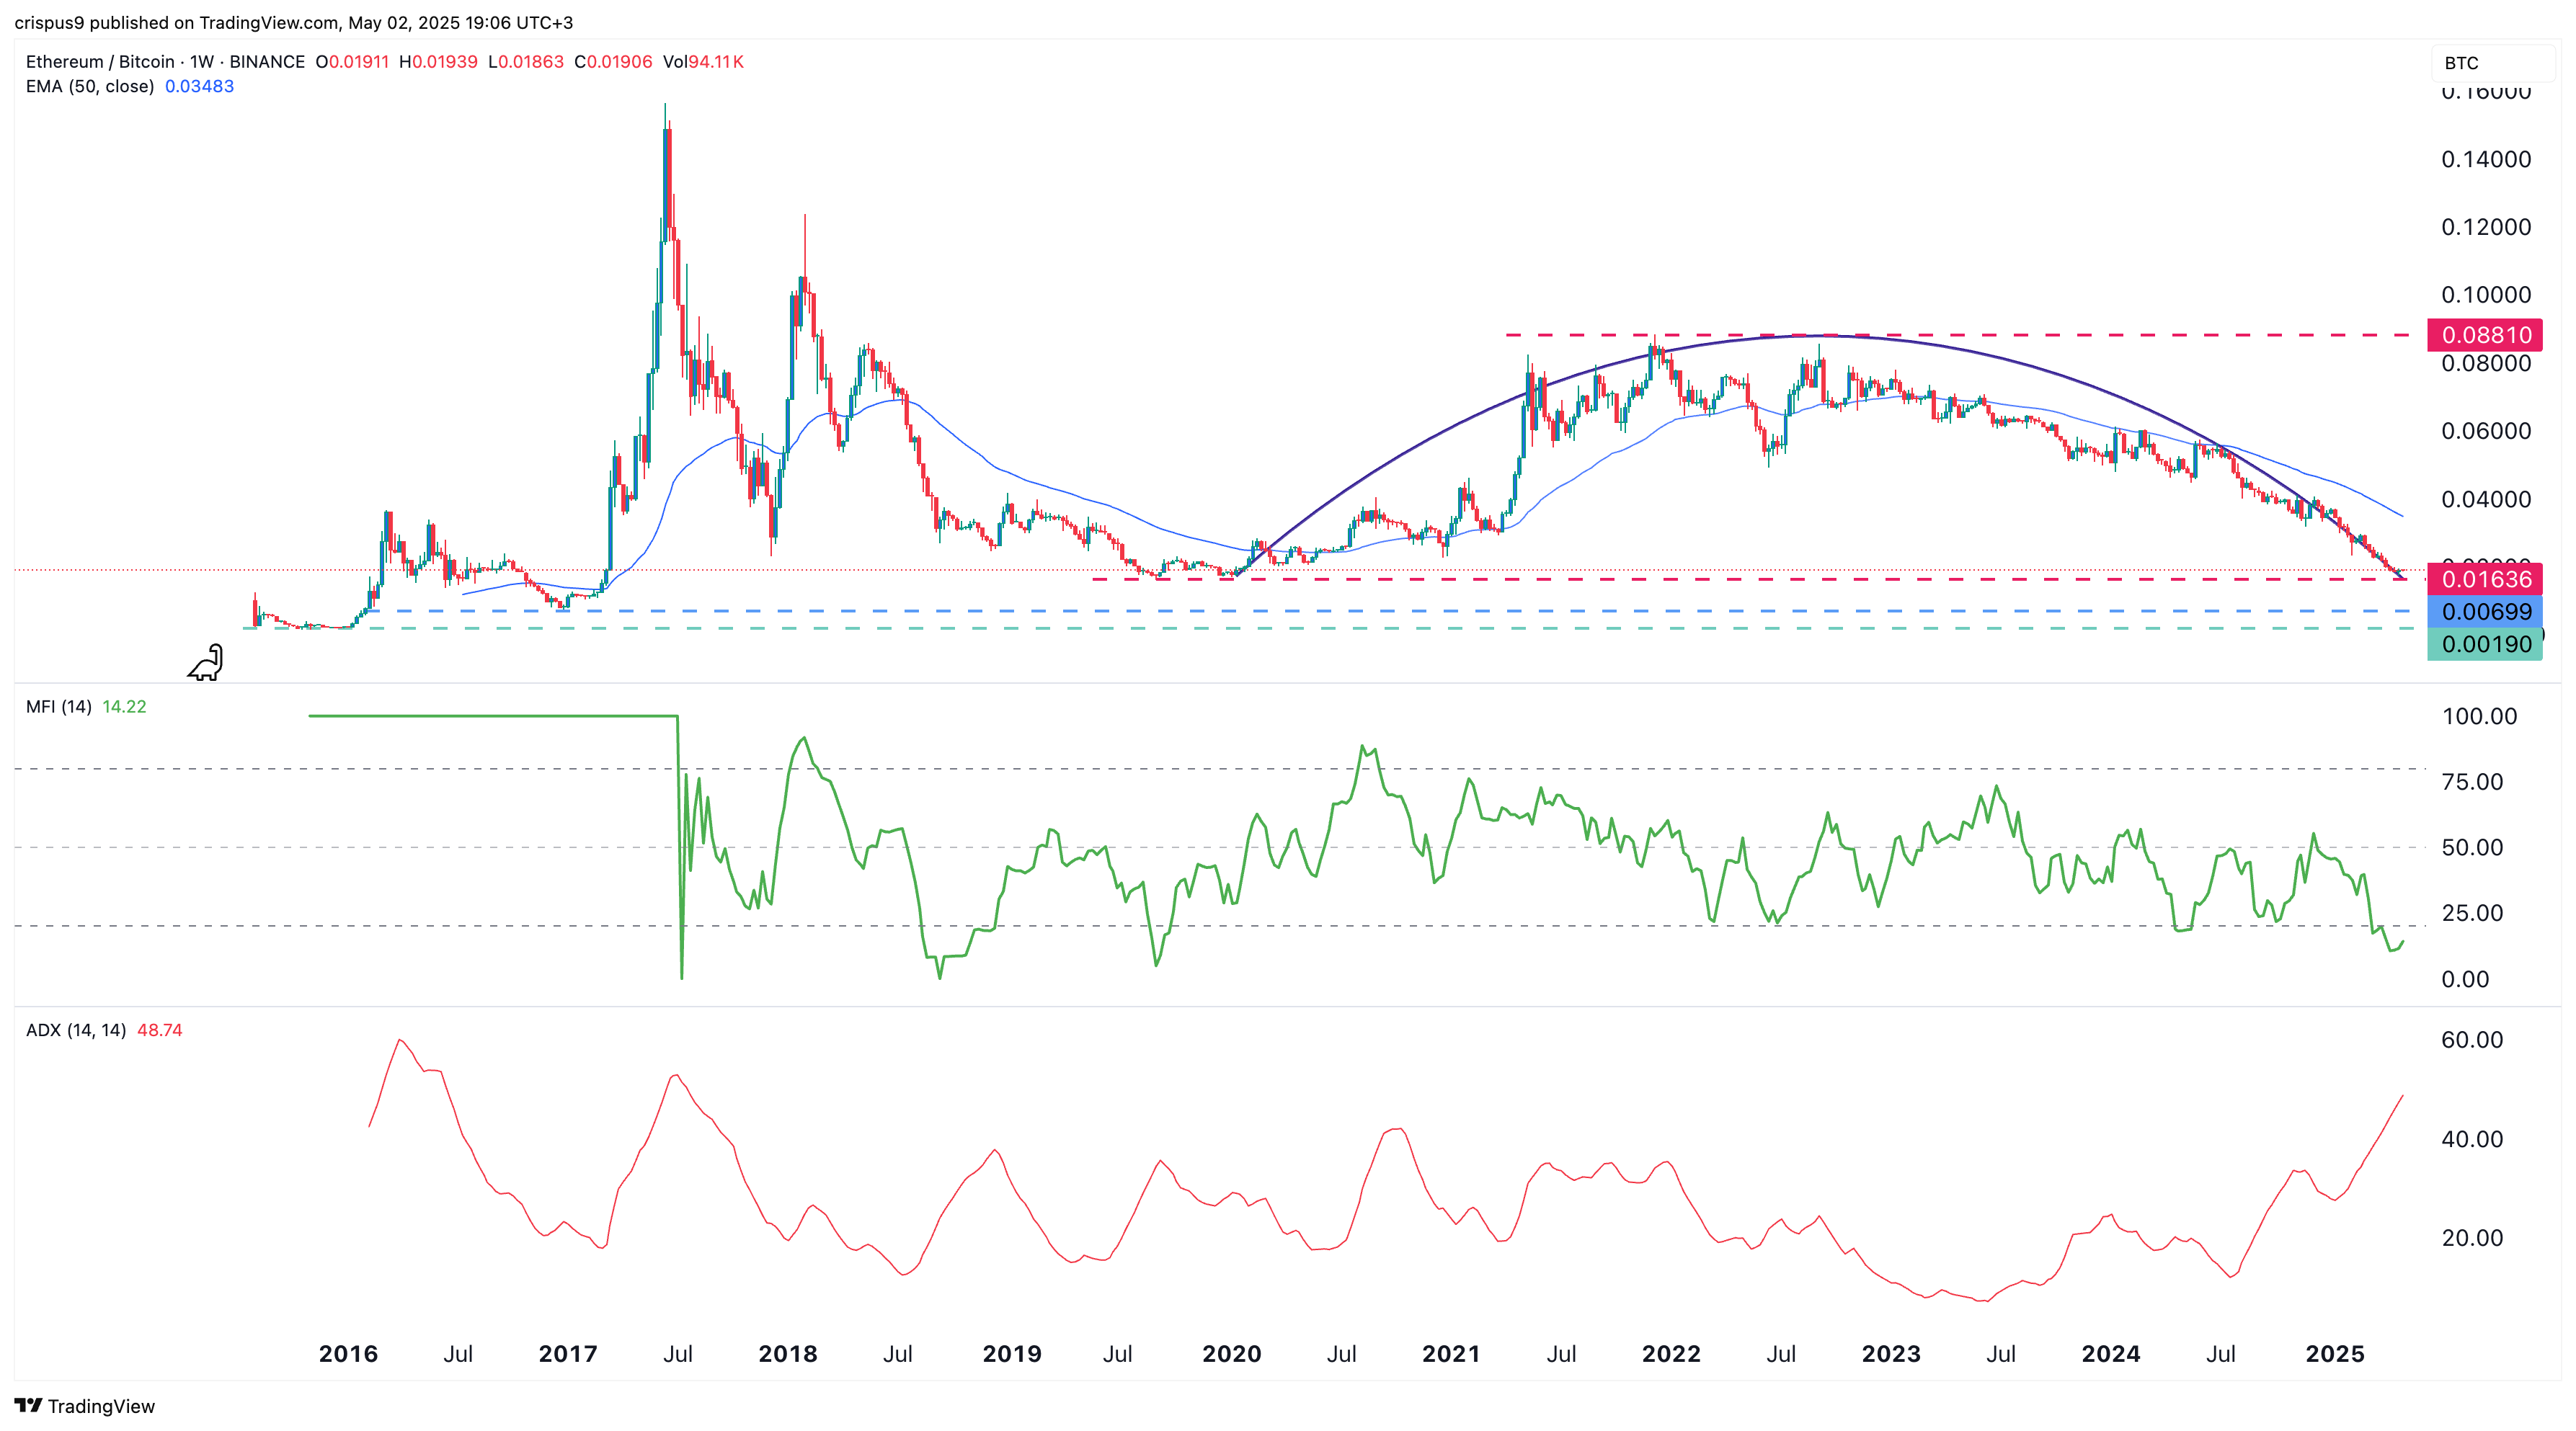
Now, if you thought this was bad, let’s talk numbers. The weekly chart reveals that the ETH/BTC pair reached a majestic peak of 0.08810 in December 2021, before crashing with all the grace of a brick in freefall to its current value of 0.01890. Ouch.
Ethereum is now lingering below both the 50-week and 100-week moving averages. Oh, and did we mention the Money Flow Index? It’s a ghost town, sitting at a truly “oversold” level of 14. Even the index is thinking, “Why bother?” 😔
The Average Directional Index is currently at 48.75, indicating that bearish momentum is stronger than a triple espresso shot on a Monday morning. You’d think the momentum would be enough to send Ethereum straight into the ground, but nope, it’s hanging in there, probably questioning its life choices.
Oh, and the pièce de résistance: the infamous inverse cup and handle pattern has made its appearance. It’s like the chart is telling us, “Hey, this is a bearish continuation signal. Get ready for more doom and gloom.” If this pattern follows through, we could be heading to a new low of 0.0070 – remember December 2016? – and if that fails, we might even see the all-time low of 0.0019. Hold onto your hats, folks, it’s about to get bumpy. 🎢
Read More
- Does Oblivion Remastered have mod support?
- Thunderbolts: Marvel’s Next Box Office Disaster?
- DC: Dark Legion The Bleed & Hypertime Tracker Schedule
- Clair Obscur: Expedition 33 – All Act 3 optional bosses and where to find them
- Elder Scrolls Oblivion: Best Bow Build
- 30 Best Couple/Wife Swap Movies You Need to See
- Elder Scrolls Oblivion: Best Healer Build
- Everything We Know About DOCTOR WHO Season 2
- Elder Scrolls Oblivion Remastered: Best Paladin Build
- To Be Hero X: Everything You Need To Know About The Upcoming Anime
2025-05-02 20:58