Okay, folks, gather ’round. Dogwifhat (WIF) is at it again. After a wild ride earlier this month, the token’s taken a bit of a breather, but don’t let that fool you – it’s still poised to make some big moves 🤯.
Despite some modest price shifts, the underlying metrics are screaming, “Hey, pay attention!” The total volume just exceeded $236 million over the past 24 hours, which is like, a lot of money 💸. This rise in trading activity could be the spark that sets off a larger directional move, if momentum aligns with technical confirmation, that is 🤞.
Dogwifhat (WIF) Price: A Short-Term Pullback Meets Support Near $0.84
Let’s take a gander at the WIF/USD 1-hour chart on Open Interest. It’s like a rollercoaster ride between July 2 and July 3, when the token surged from under $0.78 to slightly above $0.95 🎠. The sharp rally showed some serious bullish pressure, with minimal retracement, suggesting heavy accumulation during the breakout 💪. However, this steep ascent was followed by a notable retracement, as traders began to unwind positions, and the price reverted to a range between $0.82 and $0.84 🤦♀️.
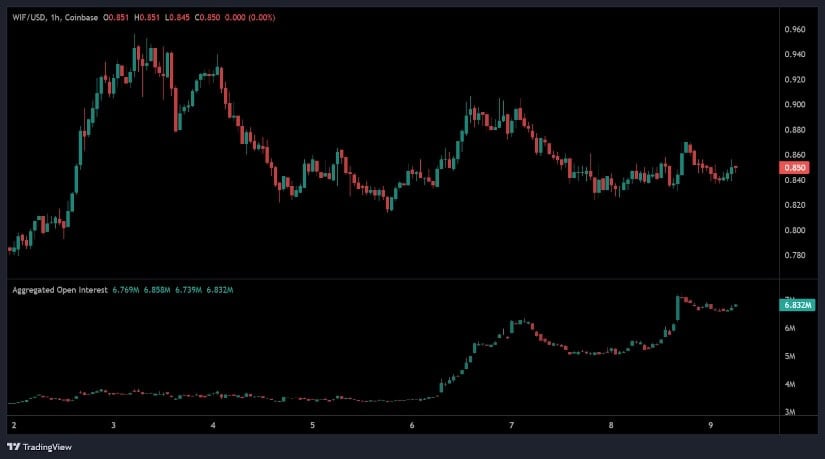
Over the following days, the chart reflected a declining structure, with lower highs and lower lows forming into July 7 📉. Despite the downtrend, support at $0.84 held firm, resulting in a consolidation pattern supported by reduced volatility and smaller candlestick bodies 🕯️.
During this period, aggregated open interest rose from around 3 million to over 6.83 million by July 9 🚀. This increase in open interest signals heightened participation, possibly from traders preparing for another breakout 🎉. Price movement above the $0.87–$0.89 resistance range would be required to initiate another push toward the previous $0.95 high, while a breakdown below $0.84 could confirm a deeper correction 😬.
Daily Volume Surge Reflects Renewed Market Activity
Between July 8 and July 9, WIF recorded volatile intraday action, opening near $0.84 and reaching a local high of approximately $0.856 📊. Despite multiple bullish impulses during the early session, the price failed to sustain the upward momentum and fell back toward support levels 🤦♀️. The formation of lower highs and eventual price stabilization near $0.84 signaled a temporary consolidative phase rather than a reversal 🔄.
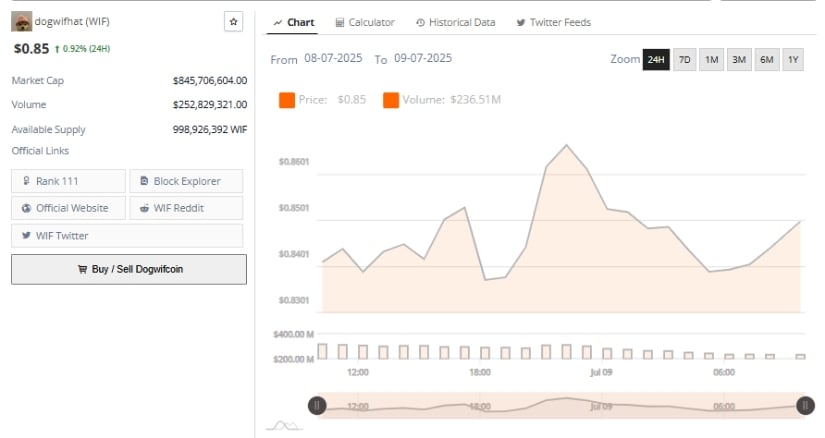
Trading volume for the 24 hours totaled $236.51 million, underlining increased market participation 📈. This level of volume, combined with the token’s recovery toward the $0.85 region by the session close, indicates that buyers were active during dips, possibly defending the $0.84 base 💪.
A sustained push above $0.86 could set the stage for a short-term rally, provided volume continues to support the move 🚀. The steady volume bars also suggest that participants are awaiting a trigger event or a technical breakout to confirm the next directional leg 🔜.
WIF currently holds a mid-tier market capitalization, with price movement influenced by sentiment shifts and liquidity conditions 🤝. If accumulation persists above $0.84 and the resistance band at $0.87 is tested with rising volume, WIF could attempt a recovery toward its early July highs 🌟. However, failure to clear the consolidation range may expose the token to renewed pressure from profit-taking or macro-level risk-off events 😬.
Indicators Point to Balanced Momentum and Weak Breakout Signals
As of July 9, the daily WIF/USDT chart from TradingView shows price action hovering at $0.852, with the token trading within a narrow range for several sessions 📊. The Relative Strength Index (RSI) is currently at 50.34, aligned with the RSI-based moving average of 50.12, indicating a neutral market stance 🤔.
These levels reflect consolidation, with neither bullish nor bearish extremes in control 🤝. Movement above 60 could indicate a trend shift, while a drop below 45 might validate downside continuation 📉.
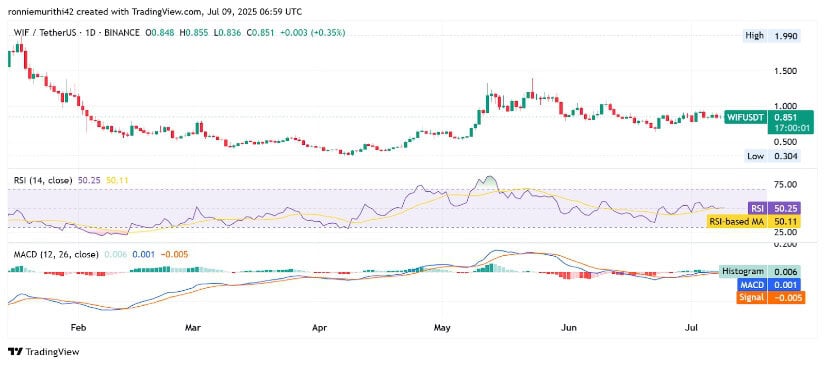
MACD readings suggest an early-stage bullish crossover 🌈. The MACD line (0.001) has crossed just above the signal line (-0.005), with the histogram posting a small positive reading of 0.006 📈. While these values are near neutral, the crossover may signal a possible shift in short-term momentum 🔜.
A breakout above $0.87 with accompanying MACD histogram expansion would provide firmer confirmation of a bullish trend reversal 🎉. Until then, WIF remains in a technical equilibrium, with volume and breakout direction likely to dictate its near-term trajectory 🤔.
Read More
- Top 20 Dinosaur Movies, Ranked
- 20 Movies Where the Black Villain Was Secretly the Most Popular Character
- 25 “Woke” Films That Used Black Trauma to Humanize White Leads
- Celebs Who Narrowly Escaped The 9/11 Attacks
- Gold Rate Forecast
- Spotting the Loops in Autonomous Systems
- Silver Rate Forecast
- 22 Films Where the White Protagonist Is Canonically the Sidekick to a Black Lead
- The 10 Most Underrated Jim Carrey Movies, Ranked (From Least to Most Underrated)
- From Bids to Best Policies: Smarter Auto-Bidding with Generative AI
2025-07-09 21:41