At 8:30 a.m. EST on Sunday, bitcoin dawdled around $71,754 on March 15, 2026, consolidating within a narrow $70,540 to $71,893 intraday range while the broader technical picture leaned mildly constructive. With a market cap of $1.44 trillion and 24-hour trading volume above $22.5 billion, the world’s largest cryptocurrency continued to hover inside a well-defined consolidation band visible across multiple timeframes, much like a well-mannered guest at a dinner party who refuses to engage in conversation.
Bitcoin Chart Outlook: Price Coils Near $72K as Momentum Indicators Quietly Warm Up
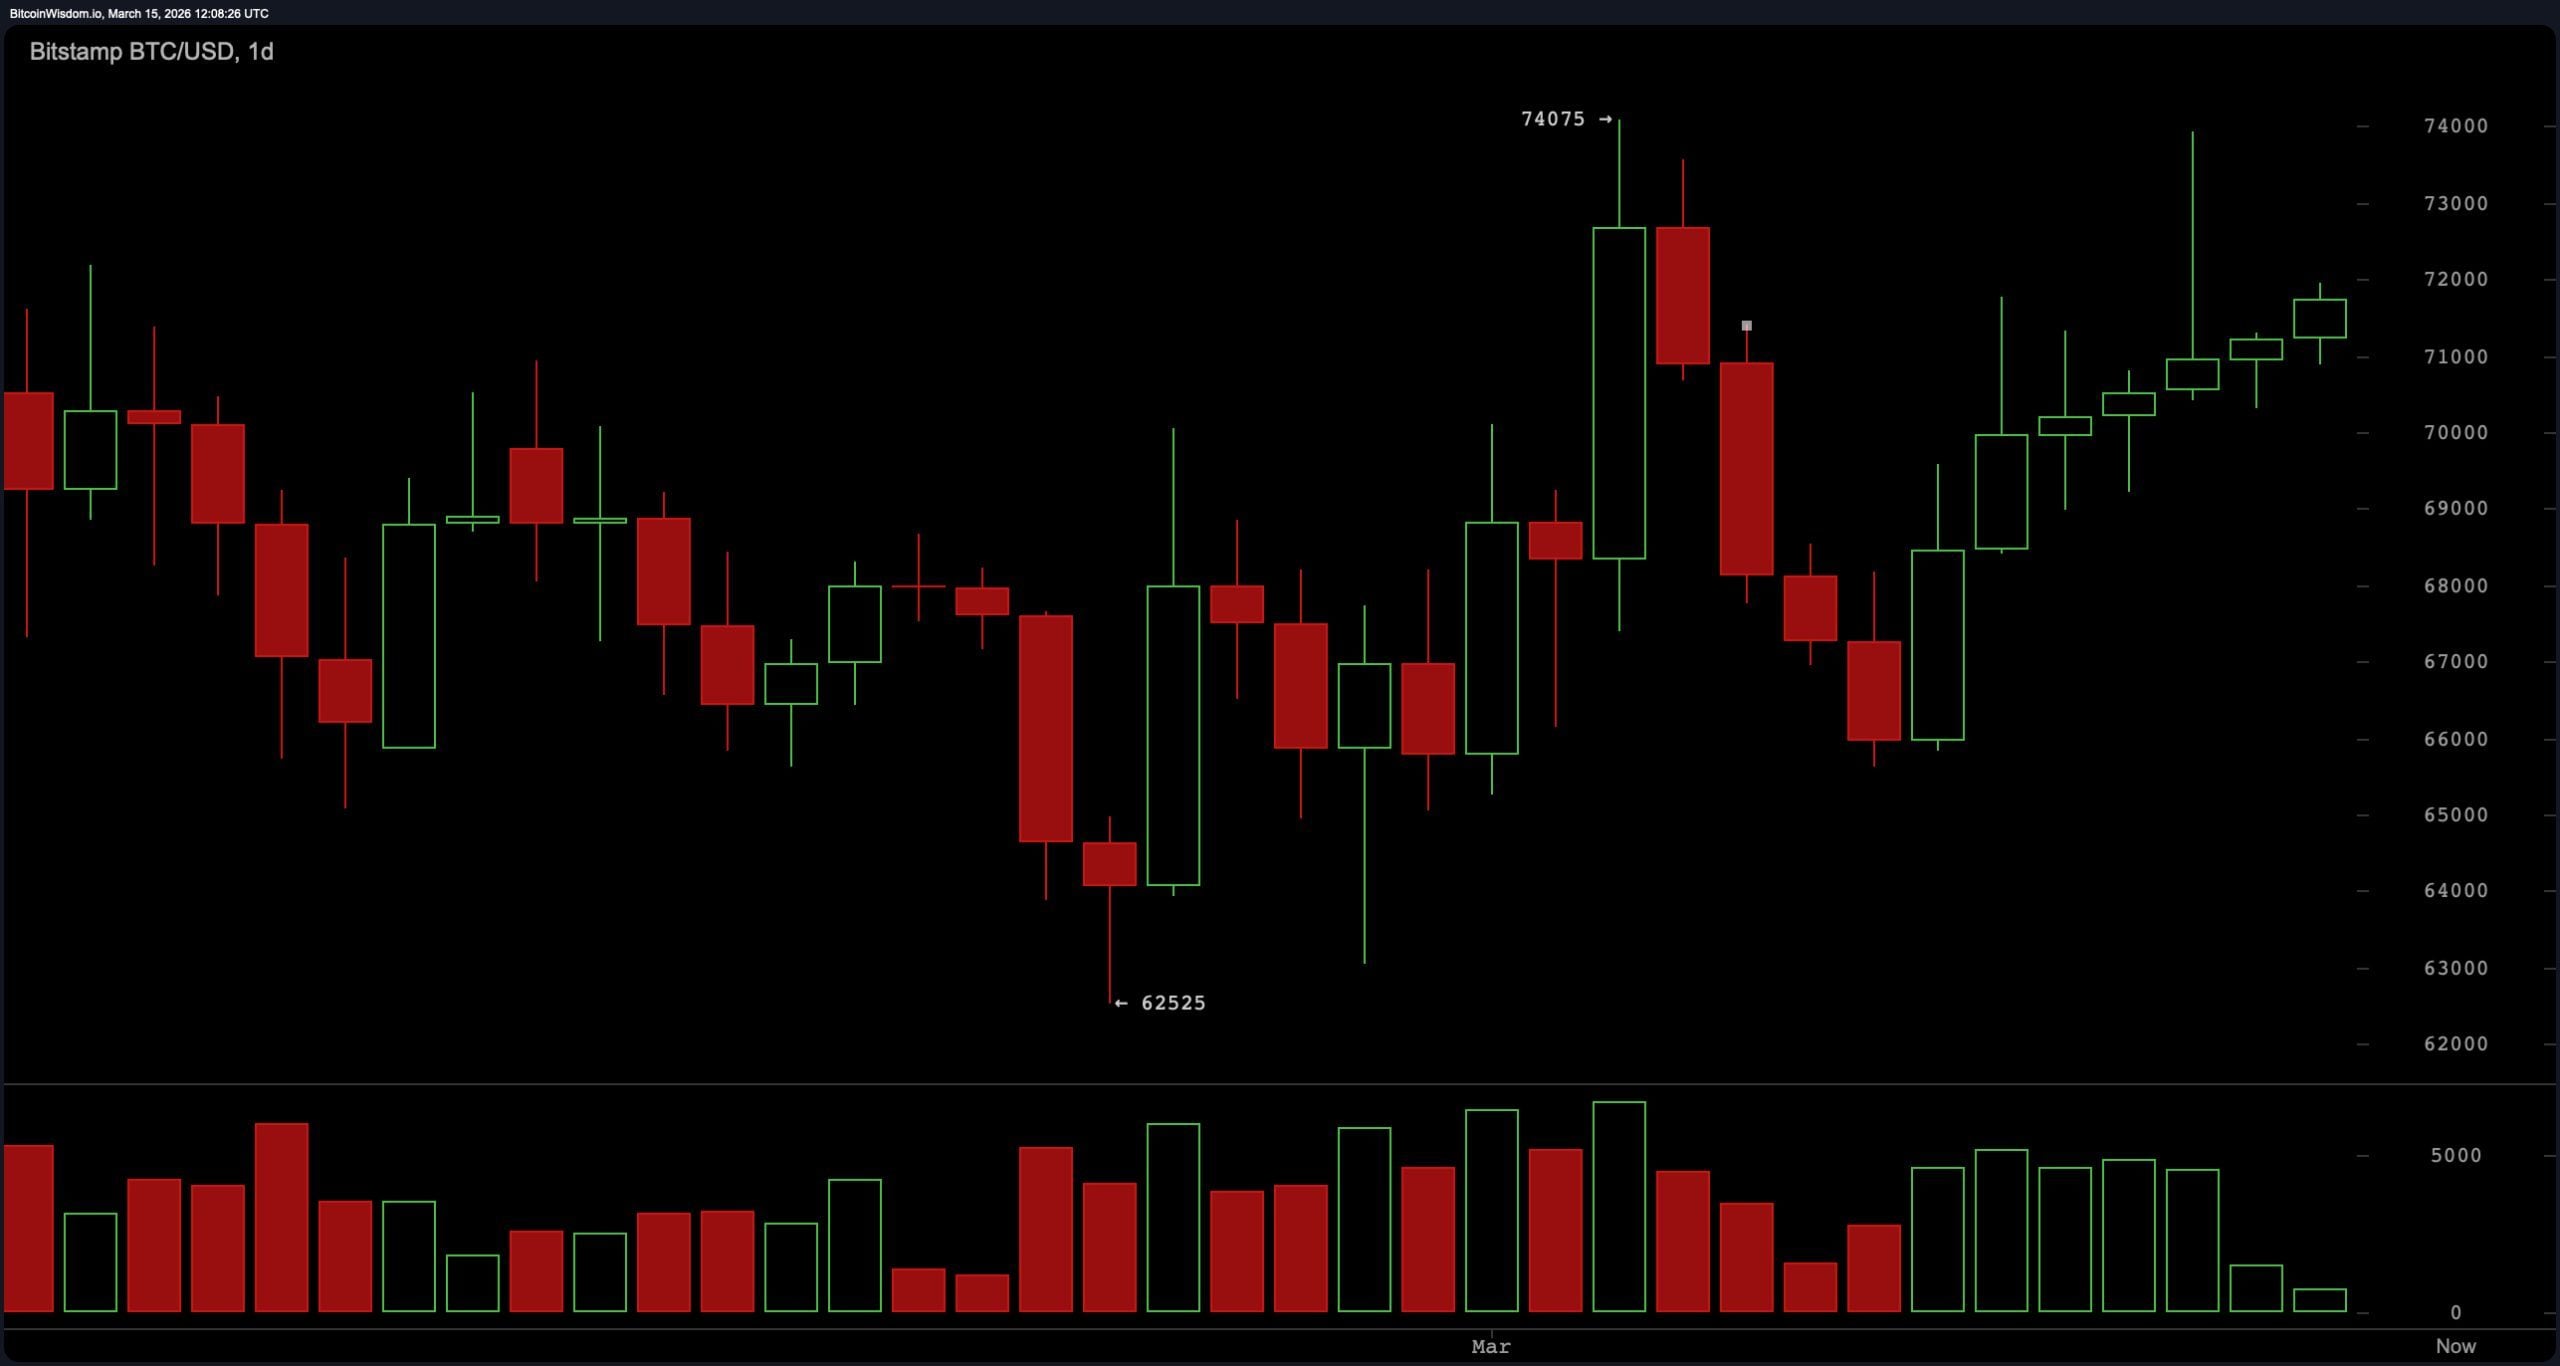
Price action across the daily bitcoin chart suggests bitcoin remains in a classic post-rally digestion phase, which requires a great deal of patience. After carving a swing low near $62,525 and rallying to a recent peak around $74,075, the asset has since retreated into a sideways structure bounded roughly between $70,500 and $72,500. One might say it’s engaged in a game of chess with itself, moving pieces back and forth with the enthusiasm of a man debating whether to wear a tie.
Recent daily candles feature smaller bodies and alternating colors, a visual signal of market indecision following the prior impulsive advance. Volume has tapered off notably since the peak, reinforcing the idea that both bullish enthusiasm and bearish urgency are temporarily on mute while the market searches for direction. It’s as if the market has taken a vow of silence, save for the occasional whisper of a trader hoping to be heard.
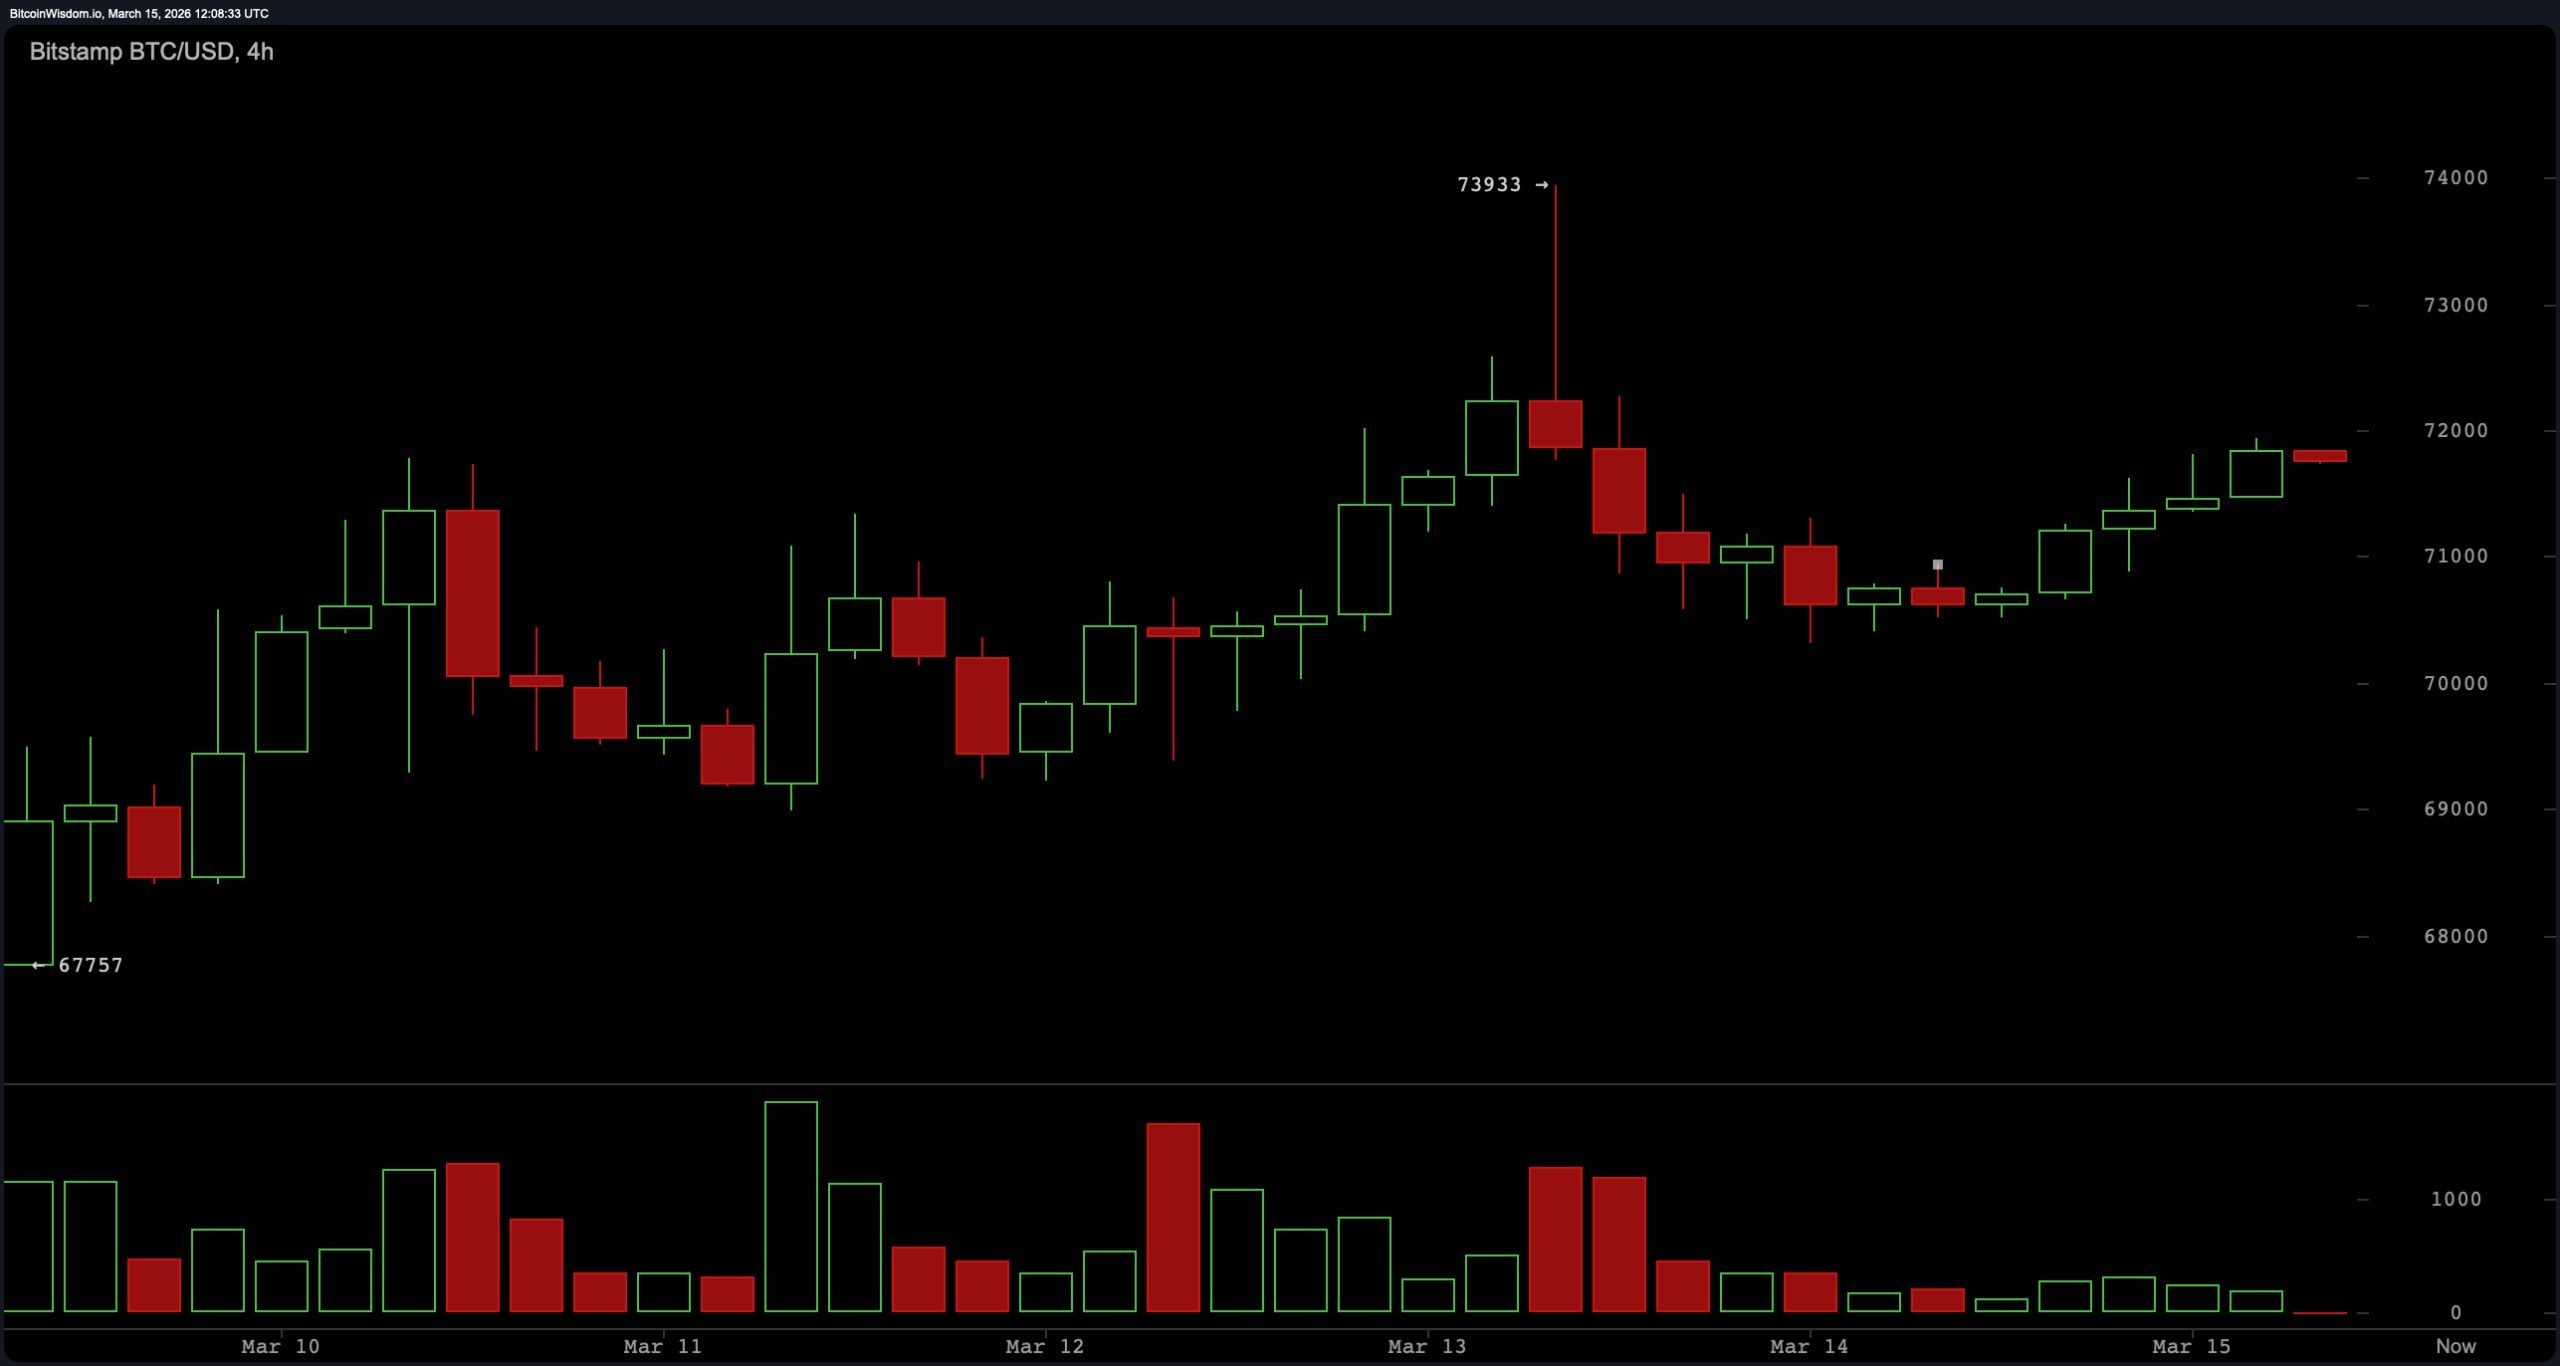
The four-hour chart tells a similar story but adds a little more texture to the short-term narrative. Bitcoin reached roughly $73,933 around March 13 before pulling back sharply into the low-$70,000 range. The decline arrived on heavier volume, while the subsequent rebound toward the $71,900 area occurred on lighter activity. That imbalance hints that the rebound is more corrective than explosive, though price continues to hover above key short-term demand near $70,500 to $71,000. For now, the intermediate trend remains boxed between resistance near $72,500 and support clustered just above $70,000. It’s the financial equivalent of a game of musical chairs, with everyone hoping to find a seat before the music stops.
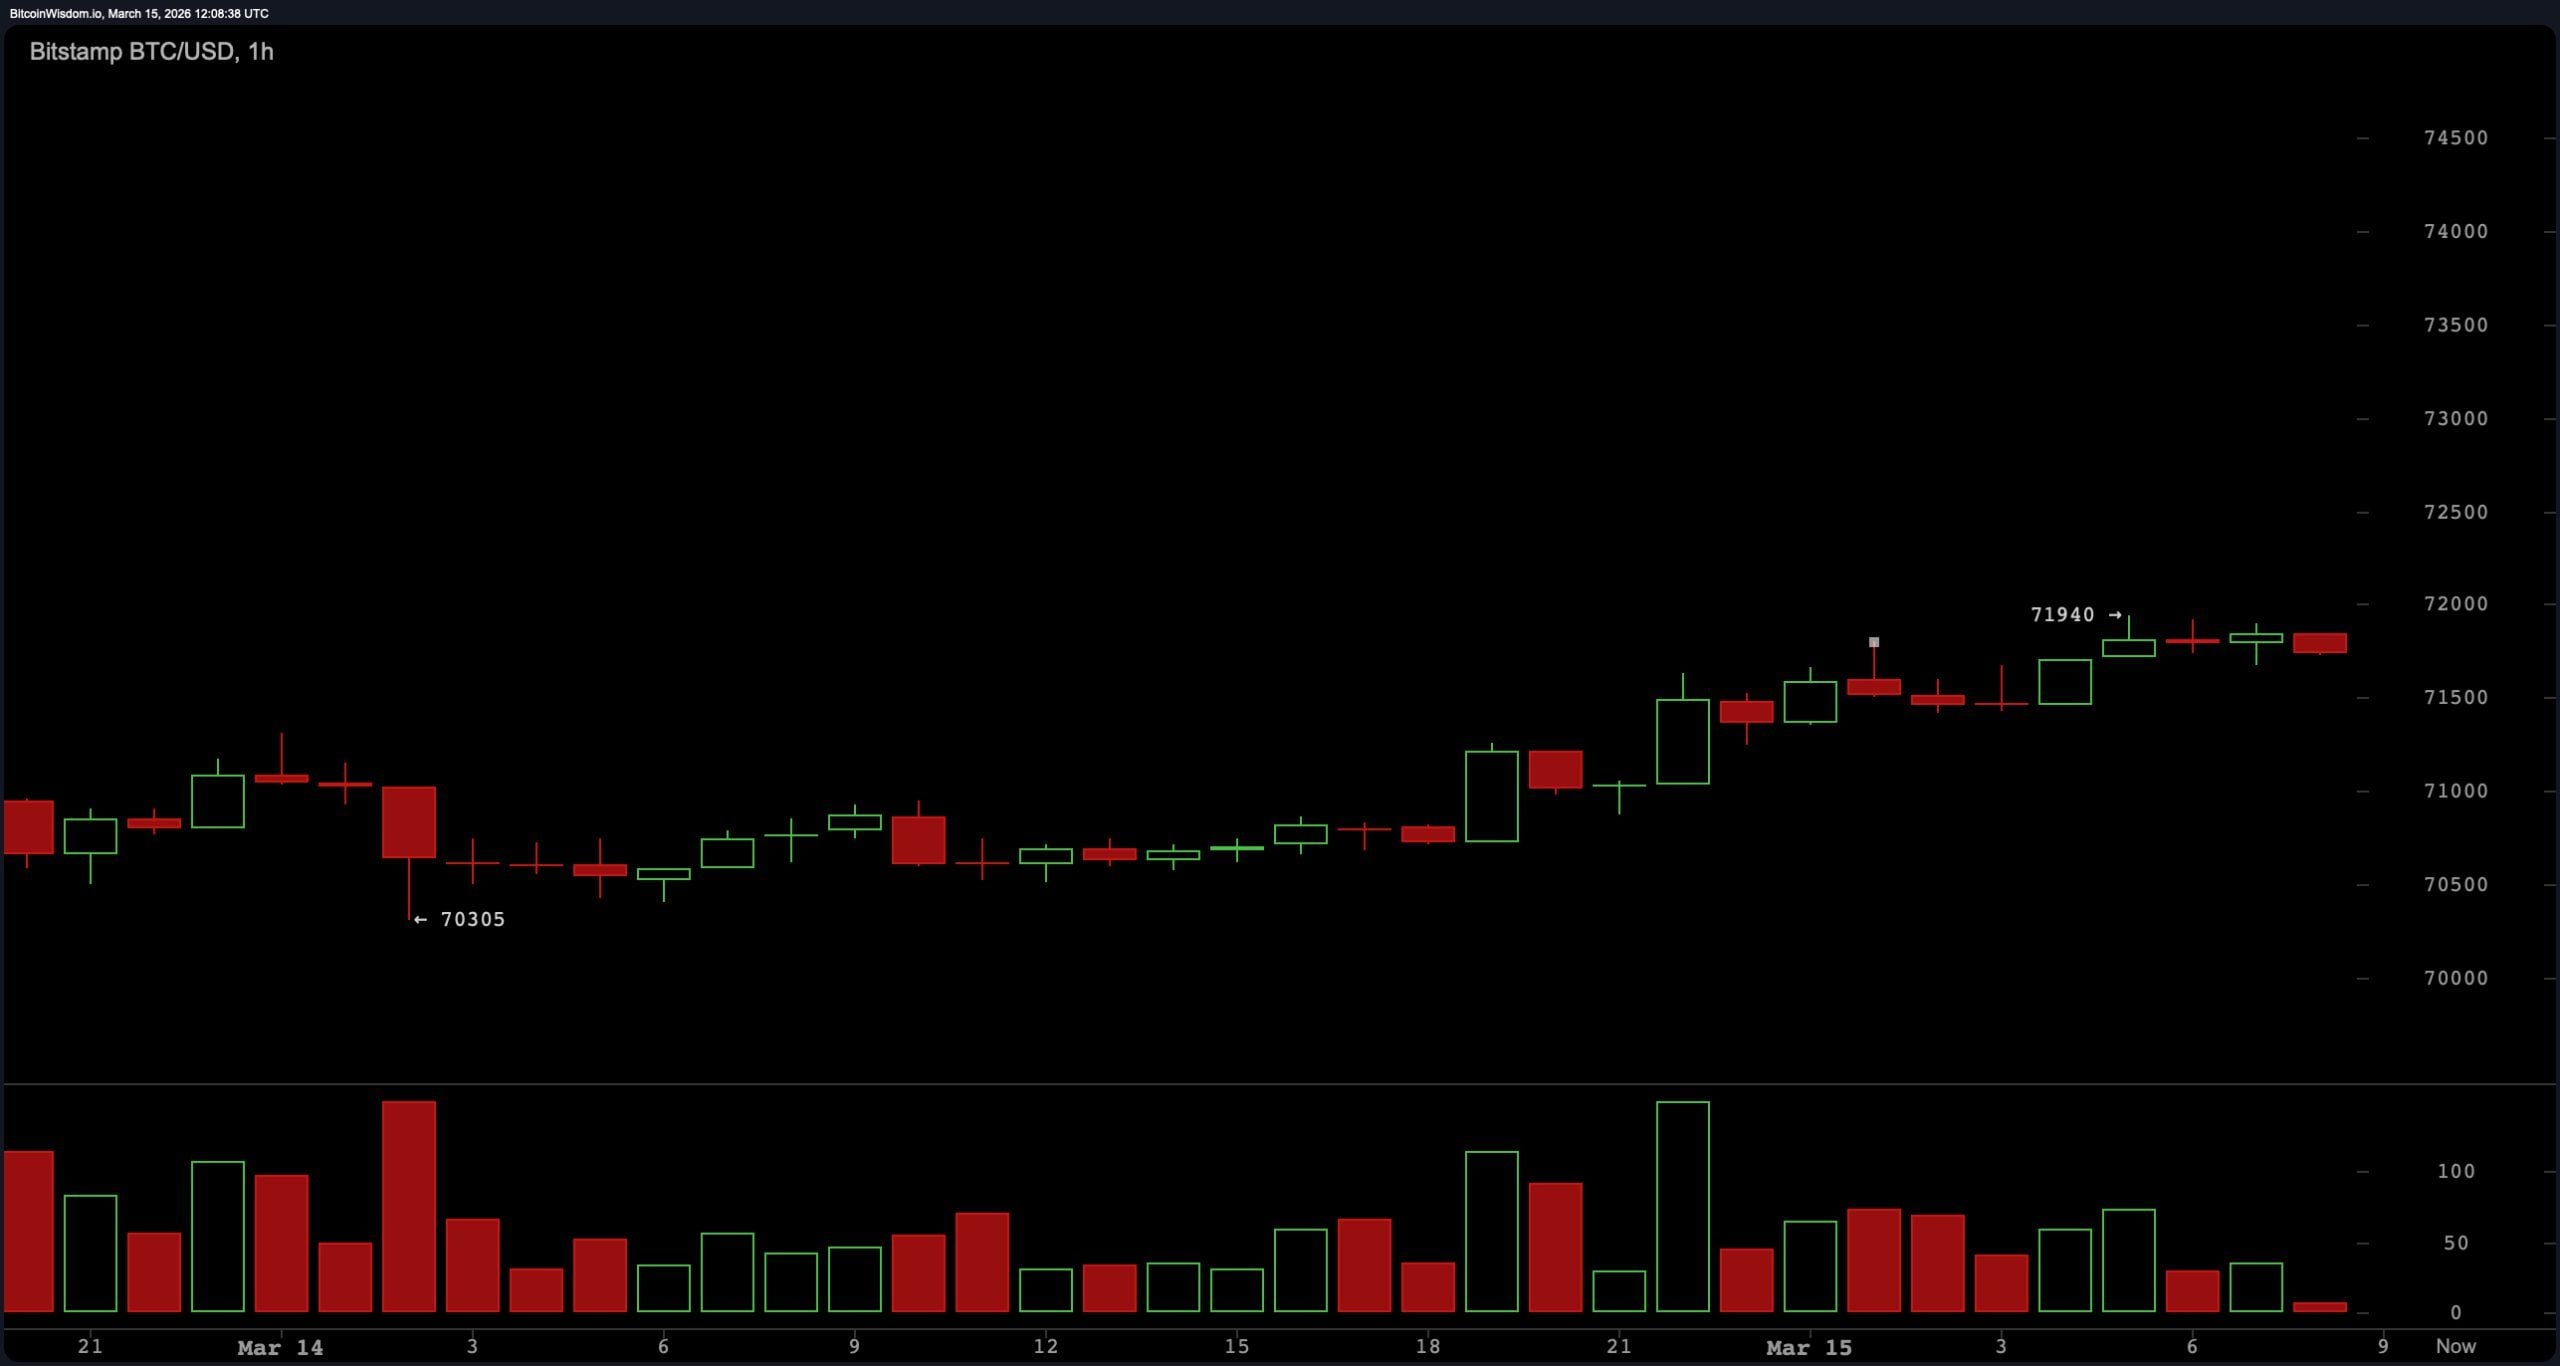
Zooming into the one-hour chart, price behavior resembles a slow staircase higher following a bounce near $70,305 on March 14. Candles are relatively small, and volume remains subdued, a technical signature often associated with consolidation or “coiling” behavior before a directional move. Price has hovered around the $71,268 to $71,940 region with minimal volatility, suggesting traders are watching the same levels: resistance near $72,000 and support around $70,300. In other words, the market appears content to wait for a catalyst rather than manufacture one. A decision, it seems, is being postponed with the grace of a diplomat avoiding a scandal.
Momentum oscillators reinforce the theme of cautious neutrality with a slight upward tilt. The relative strength index ( RSI) stands at 55, squarely in neutral territory but comfortably above the midpoint that often separates bullish and bearish momentum. The Stochastic oscillator sits at 71, indicating upward momentum without yet reaching overbought conditions. One might say it’s the financial equivalent of a man who’s mildly interested in a potential romance but hasn’t yet committed.
The commodity channel index (CCI) reads 101, suggesting modest strength, while the average directional index (ADX) at 25 signals that trend intensity remains relatively mild. Meanwhile, the awesome oscillator prints 2,649 in neutral territory, while momentum (10) and moving average convergence divergence ( MACD) both register positive signals, implying underlying upward pressure is quietly building even if price itself hasn’t gotten the memo yet. It’s as if the market is holding its breath, waiting for a cue to act.
Moving averages (MAs) paint a mixed but slightly supportive picture depending on which timeframe traders prefer to obsess over. Shorter-term averages are generally favorable, with the 10-day exponential moving average at $70,096 and the 10-day simple moving average at $69,439 both positioned below the current price. The 20-day EMA sits at $69,575 and the 20-day SMA at $68,665, reinforcing nearby structural support, while the 30-day EMA at $70,189 and the 30-day SMA at $68,327 also remain below the current price level. It’s a financial tightrope walk, with safety nets in place but no guarantee of a soft landing.
However, longer-term averages still loom overhead, including the 50-day EMA at $72,741 and the 100-day EMA at $79,516, alongside the 200-day EMA at $87,821 and the 200-day SMA at $93,930. The result is a classic technical stalemate: short-term averages are supportive, longer-term averages remain overhead resistance, and price sits awkwardly between them like a trader who showed up early to a party that hasn’t quite started yet. A situation as tense as a man who’s forgotten his wedding anniversary.
Bull Verdict:
If bitcoin maintains support above the $70,300-$70,500 zone, the technical structure favors a gradual push toward overhead resistance near $72,000 and $72,500. Momentum indicators such as the relative strength index ( RSI) holding above the midpoint and positive signals from moving average convergence divergence ( MACD) and the momentum indicator suggest underlying strength remains intact despite the current consolidation. A sustained move above $72,000 with expanding volume would reinforce the broader upward bias and reopen a path toward $75,000 and potentially the recent swing high near $74,075. It’s the financial equivalent of a man who’s finally decided to propose, but only after a few more glasses of wine.
Bear Verdict:
Failure to maintain support near $70,500 would weaken the short-term structure and expose bitcoin to a deeper retracement toward the $70,000 level and possibly the $69,800 region identified as downside protection. The presence of several longer-term moving averages above price – including the 50-day exponential moving average at $72,741 and the 100-day and 200-day averages significantly higher – shows that overhead technical pressure still exists. A decisive break below support, accompanied by rising volume, would likely shift market sentiment from consolidation toward a corrective phase within the broader range. One might say it’s the financial equivalent of a storm gathering on the horizon, with no clear sign of when it will arrive.
FAQ 🔎
- What is bitcoin’s price on March 15, 2026?
Bitcoin traded around $71,754 on March 15, 2026, within a 24-hour range between $70,540 and $71,893. A figure that would make even the most stoic of investors ponder their life choices. - What are bitcoin’s key support and resistance levels right now?
Technical charts show support near $70,000-$70,500 and resistance around $72,000-$72,500. A tightrope walk for the unprepared. - What do bitcoin’s technical indicators currently signal?
Most oscillators are neutral, while momentum and moving average convergence divergence ( MACD) lean positive, indicating mild upward pressure. A whisper of hope in a sea of uncertainty. - Is bitcoin trending up or consolidating?
Across the daily, four-hour, and one-hour charts, bitcoin is consolidating in a tight range following its recent rally toward $74,000. A financial siesta, if you will.
Read More
- Building 3D Worlds from Words: Is Reinforcement Learning the Key?
- Spotting the Loops in Autonomous Systems
- The Best Directors of 2025
- The Glitch in the Machine: Spotting AI-Generated Images Beyond the Obvious
- 2025 Crypto Wallets: Secure, Smart, and Surprisingly Simple!
- Umamusume: Gold Ship build guide
- 20 Best TV Shows Featuring All-White Casts You Should See
- Mel Gibson, 69, and Rosalind Ross, 35, Call It Quits After Nearly a Decade: “It’s Sad To End This Chapter in our Lives”
- Gold Rate Forecast
- Uncovering Hidden Signals in Finance with AI
2026-03-15 16:27