For seven years now, the market has ascended, a relentless climb. The S&P 500, that broad measure of our collective ambition, has known three instances of sustained gain – a rhythm of prosperity, almost… defiant. And twice within that span, a mirroring of that ascent, as if the market remembers its own victories. The Dow Jones, a name that echoes with the weight of industry, has brushed against the 50,000 mark. The Nasdaq, ever the restless spirit, briefly touched 24,000, a fleeting glimpse of the possible.
This growth, of course, is not born of thin air. It is fueled by whispers of innovation—artificial intelligence, a new kind of consciousness taking shape in silicon, and the distant promise of quantum computing. Companies, too, have played their part, returning capital to shareholders, a quiet acknowledgement of shared prosperity. Yet, one learns, after a time, to regard such moments with a certain… caution. The air grows thin at these heights.
The market, for all its seeming invincibility, remains a fragile thing, a construct of hope and calculation. It is a machine, certainly, capable of generating wealth, but a machine built upon shifting sands. And those sands, lately, have felt… unstable.
The Weight of Expectation
Valuation, they say, is a science. But I suspect it is more akin to art—a matter of perception, of feeling. What one investor deems reasonable, another may see as extravagance. Yet, there exists a measure—the Shiller P/E Ratio, or CAPE Ratio—that has proven remarkably consistent in its warnings. It is a slow-moving indicator, a measure of average earnings adjusted for inflation, spanning a decade. It smooths out the immediate fluctuations, revealing the underlying currents.
The traditional P/E Ratio, focused on the last twelve months, is like reading the surface of a stream. The CAPE Ratio is like observing the riverbed itself, the accumulated sediment of years. Recessions and sudden shocks can distort the surface reading, but the riverbed remains, a silent witness to the passage of time.
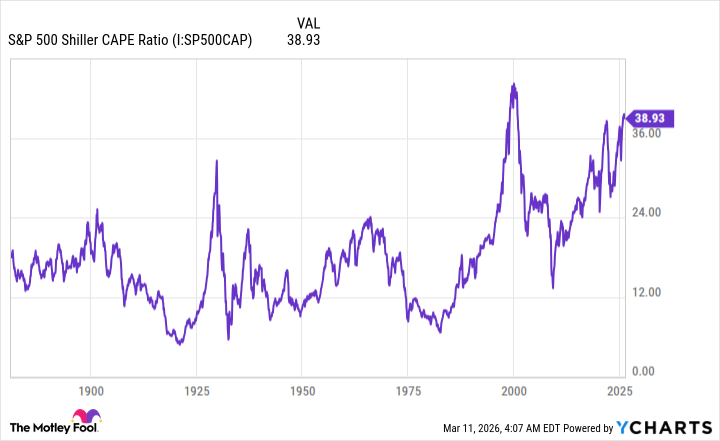
Over 155 years, this ratio has averaged 17.35. But for the last three decades, it has largely remained above that mark. Lower interest rates, a flood of capital, and the democratization of information—the breaking down of barriers between Wall Street and the wider world—have all contributed to a climate of heightened risk-taking.
Recently, the S&P 500’s CAPE Ratio has danced between 39 and 41—the second highest in history. It is a precarious perch, a moment of exquisite tension. We have seen this before, of course. Five times in the past. And each time, the market has… adjusted.
Loading…
—
A Shiller P/E of 30 is, perhaps, an arbitrary line in the sand. But history suggests it is a line that should not be ignored. Consider the past:
- August to September 1929: The prelude to the Great Depression. The Dow lost nearly 90% of its value.
- June 1997 to August 2001: The dot-com bubble. The S&P 500 and Nasdaq Composite shed 49% and 78% respectively.
- September 2017 to November 2018: A correction of 20%.
- December 2019 to February 2020: The onset of the COVID-19 pandemic. A swift, brutal decline.
- August 2020 to May 2022: A post-pandemic rally followed by a bear market, wiping away a quarter of the S&P 500’s value.
- November 2023 to present: The current moment. A peak of 41.20—the second highest on record.
Each time, a Shiller P/E above 30 has foreshadowed a significant decline. It is not a prediction, of course. But it is a warning—a subtle tremor before the storm.
The market, like a field of wheat, bends before the wind. It does not break. But it does yield. And in yielding, it reminds us that even the most robust growth is subject to the laws of nature.

The Rhythm of Seasons
History is not a linear progression, but a series of cycles. A pendulum swinging between optimism and despair. And, overwhelmingly, it favors those who maintain perspective and patience. Corrections, bear markets, even dramatic declines—these are not catastrophes, but inevitable phases of a larger process. They are the price of admission for participating in the greatest wealth-creating engine the world has ever known.
Recently, Bespoke Investment Group published data on the length of bull and bear markets dating back to the Great Depression. The findings were… illuminating. Bear markets, on average, last just 286 days—less than ten months. Bull markets, on the other hand, endure for over 1,000 days. The average bull market is 3.5 times longer than the typical bear market.
This suggests that every downturn—every moment of fear and uncertainty—represents an opportunity. A chance to acquire assets at a more reasonable price. A chance to plant seeds for future growth. It is a reminder that the market, like nature itself, is governed by the rhythm of seasons.
Loading…
—
Read More
- Building 3D Worlds from Words: Is Reinforcement Learning the Key?
- Spotting the Loops in Autonomous Systems
- The Best Directors of 2025
- 2025 Crypto Wallets: Secure, Smart, and Surprisingly Simple!
- The Glitch in the Machine: Spotting AI-Generated Images Beyond the Obvious
- 20 Best TV Shows Featuring All-White Casts You Should See
- Umamusume: Gold Ship build guide
- Mel Gibson, 69, and Rosalind Ross, 35, Call It Quits After Nearly a Decade: “It’s Sad To End This Chapter in our Lives”
- Gold Rate Forecast
- Uncovering Hidden Signals in Finance with AI
2026-03-15 13:44