Ah, Solana-always keeping us on the edge of our seats. For weeks, the price has been caught in the vice of the market’s broader malaise, down about 13% over the past month. But lo and behold, beneath the surface, a quiet, yet persistent reversal structure is taking form. The price has started to rebound, and long-term holders seem to be preparing for an extended recovery. It’s almost like watching a flower bloom in slow motion-if only it weren’t constantly bombarded by market volatility.
Yet, there’s a little cloud in the sky. One rising metric, lurking in the background, has historically led to corrections of 7% to 10% in Solana’s price. So, while the token might be doing a little jig upwards, it may stumble again before the recovery takes full flight. The suspense, as always, is palpable. But let’s dig into the numbers and see who will win this battle-rebound or pullback.
Solana’s Bullish Divergence Appears as Long-Term Holders Increase Accumulation
The first hint that Solana might be staging a turnaround comes from its momentum structure. A classic setup-Solana formed a lower low between January 28 and March 1, while its Relative Strength Index (RSI) formed a higher low. The RSI, in case you’re wondering, is the market’s way of saying, “Hey, even though the price is down, there’s a bit more strength lurking beneath.” It’s a bullish divergence-an indication that selling pressure is starting to ease off during a downtrend.
And then, of course, Solana tried to rebound-climbing about 10% before market volatility hit the scene again like an unwanted guest. But, fret not. The structure is still intact, with Solana holding above the March 1 swing low. For now, the reversal is still on, albeit with a bit of a limp.
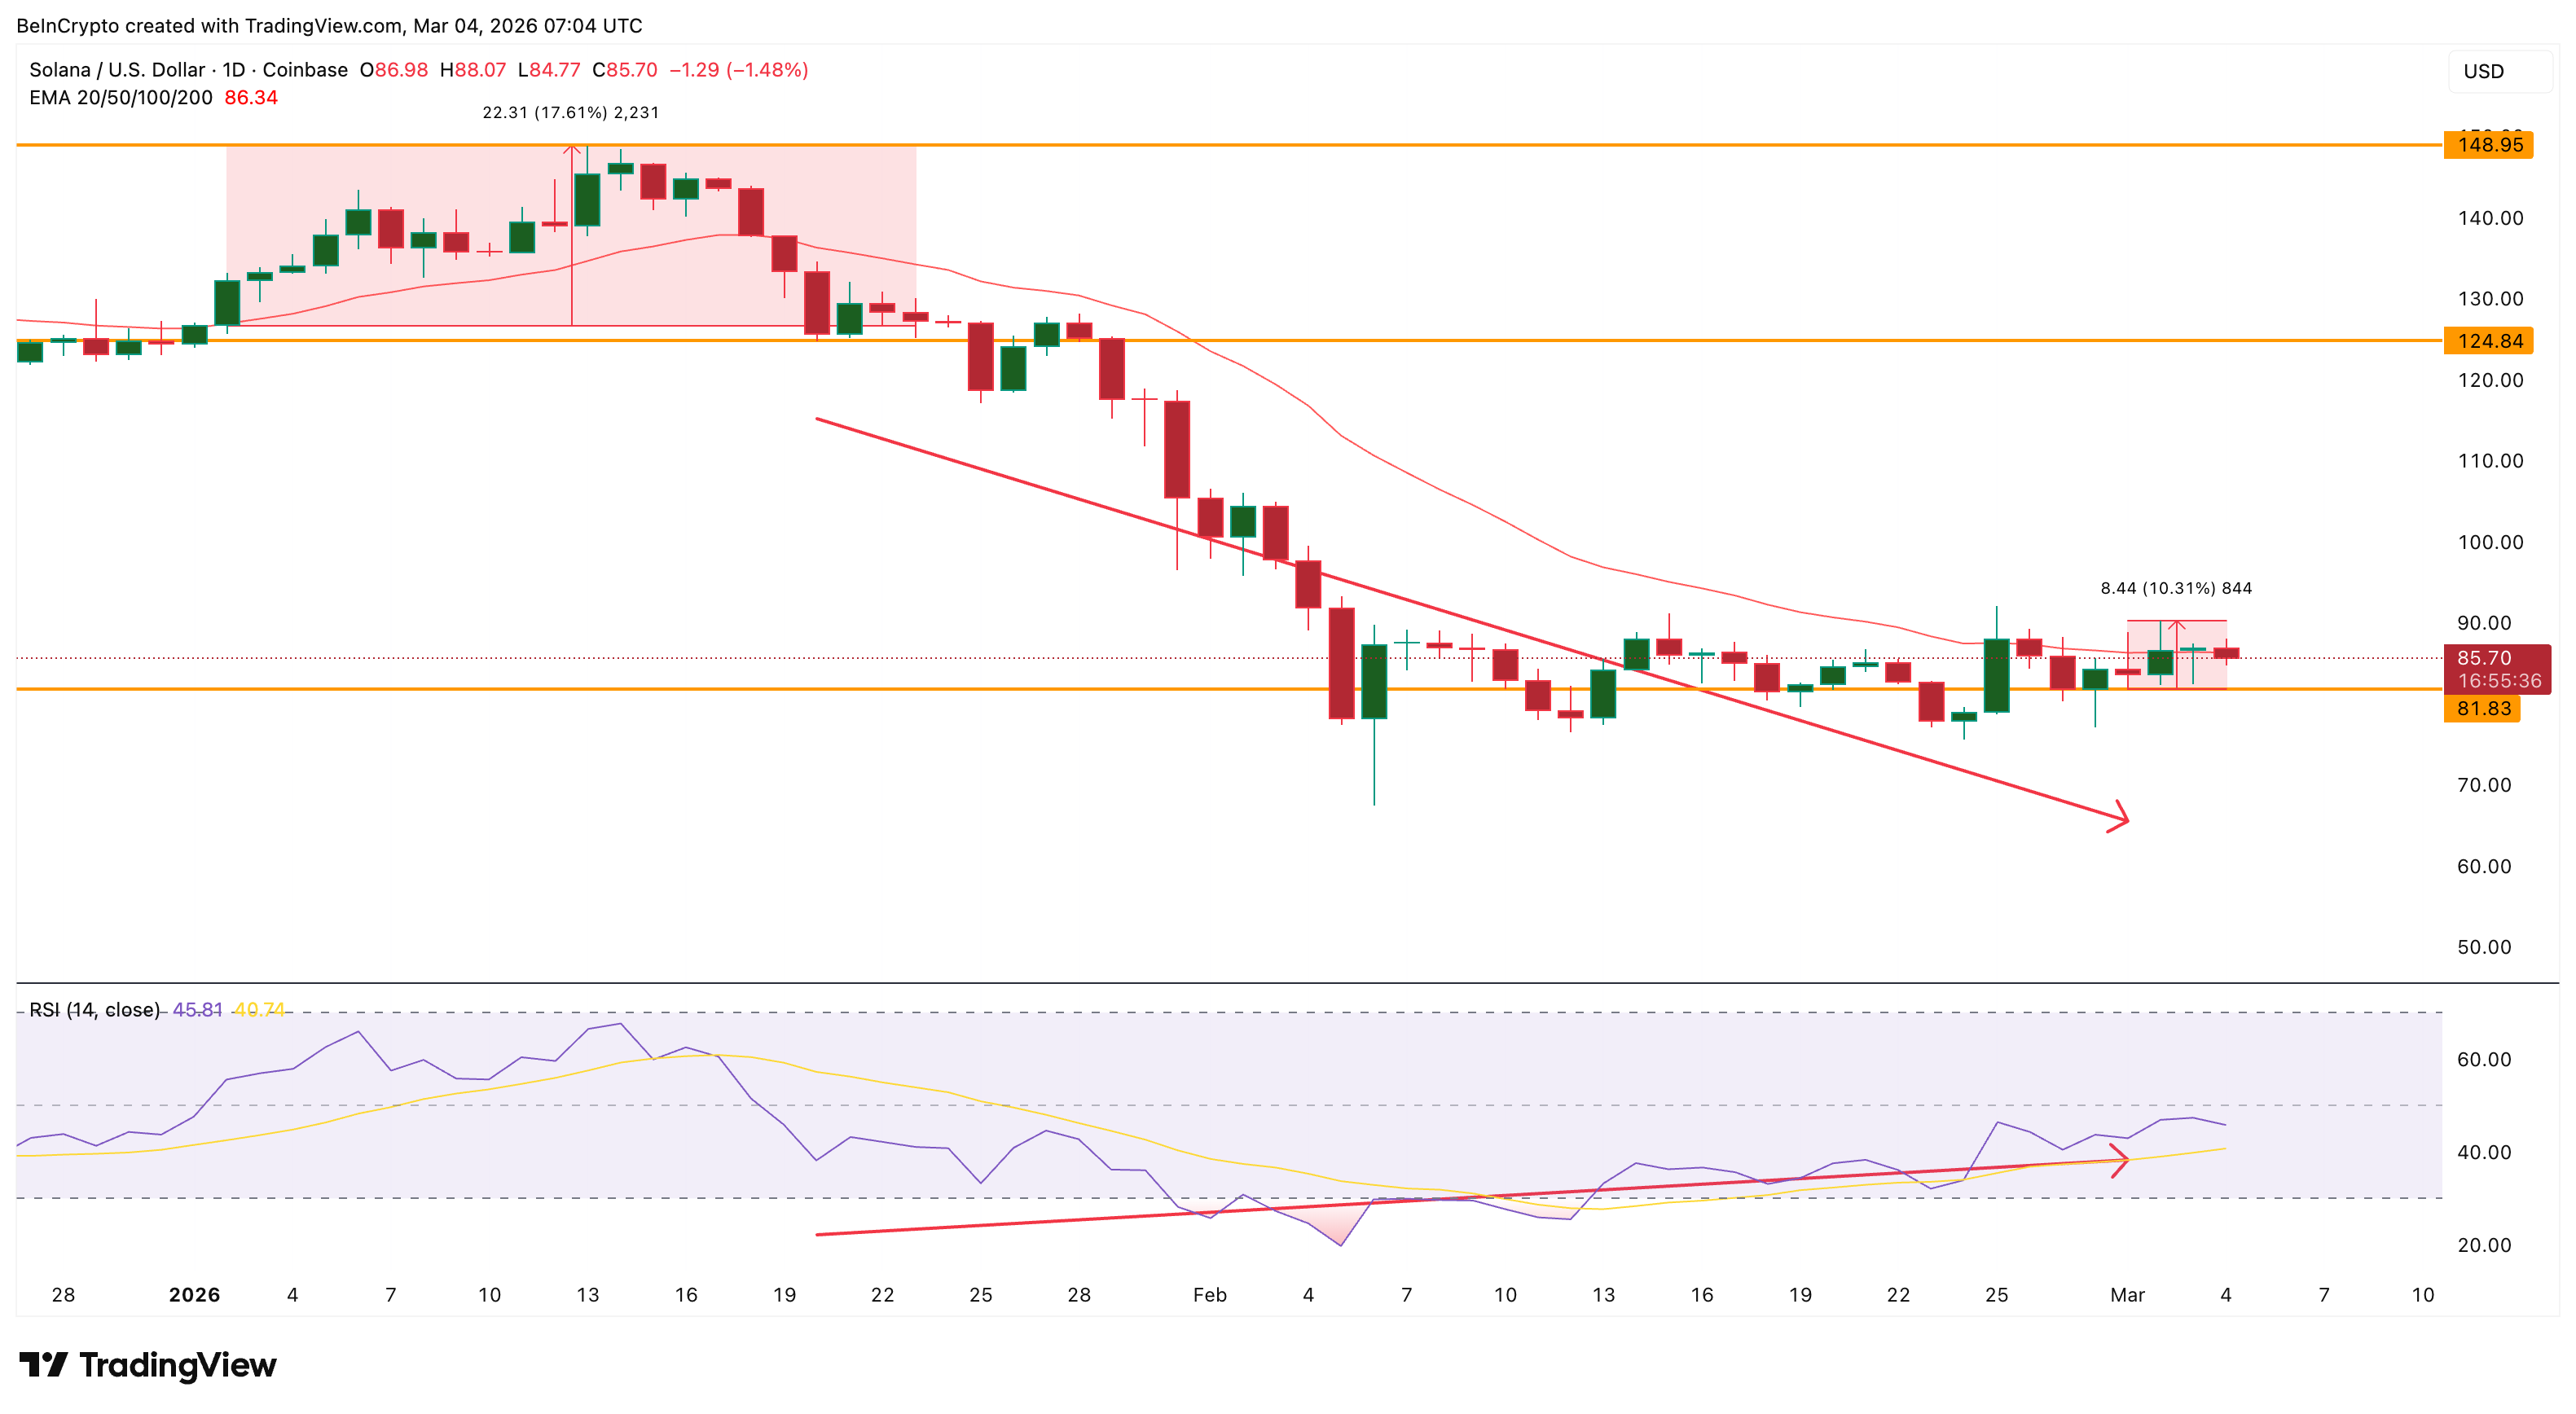
As if that wasn’t enough drama, the price is now flirting with the 20-day Exponential Moving Average (EMA)-a trend indicator that can sometimes be more reliable than your friend who says, “I’ll be there in five minutes” and shows up 30 minutes late. If Solana manages to reclaim this EMA level, it might give more credence to the recovery thesis. But no promises. We all know how these things can turn on a dime.
On-chain data also supports the narrative. Long-term holders have been busy accumulating-ever the calm presence amidst the storm. The Hodler Net Position Change metric, which tracks the activity of investors holding for over 155 days, has shown a notable increase. From 642,906 SOL on March 1, to 819,114 SOL by March 3-an increase of 27% in just two days. A solid move, indeed. But remember, accumulation alone doesn’t guarantee smooth sailing. The tide might still turn.
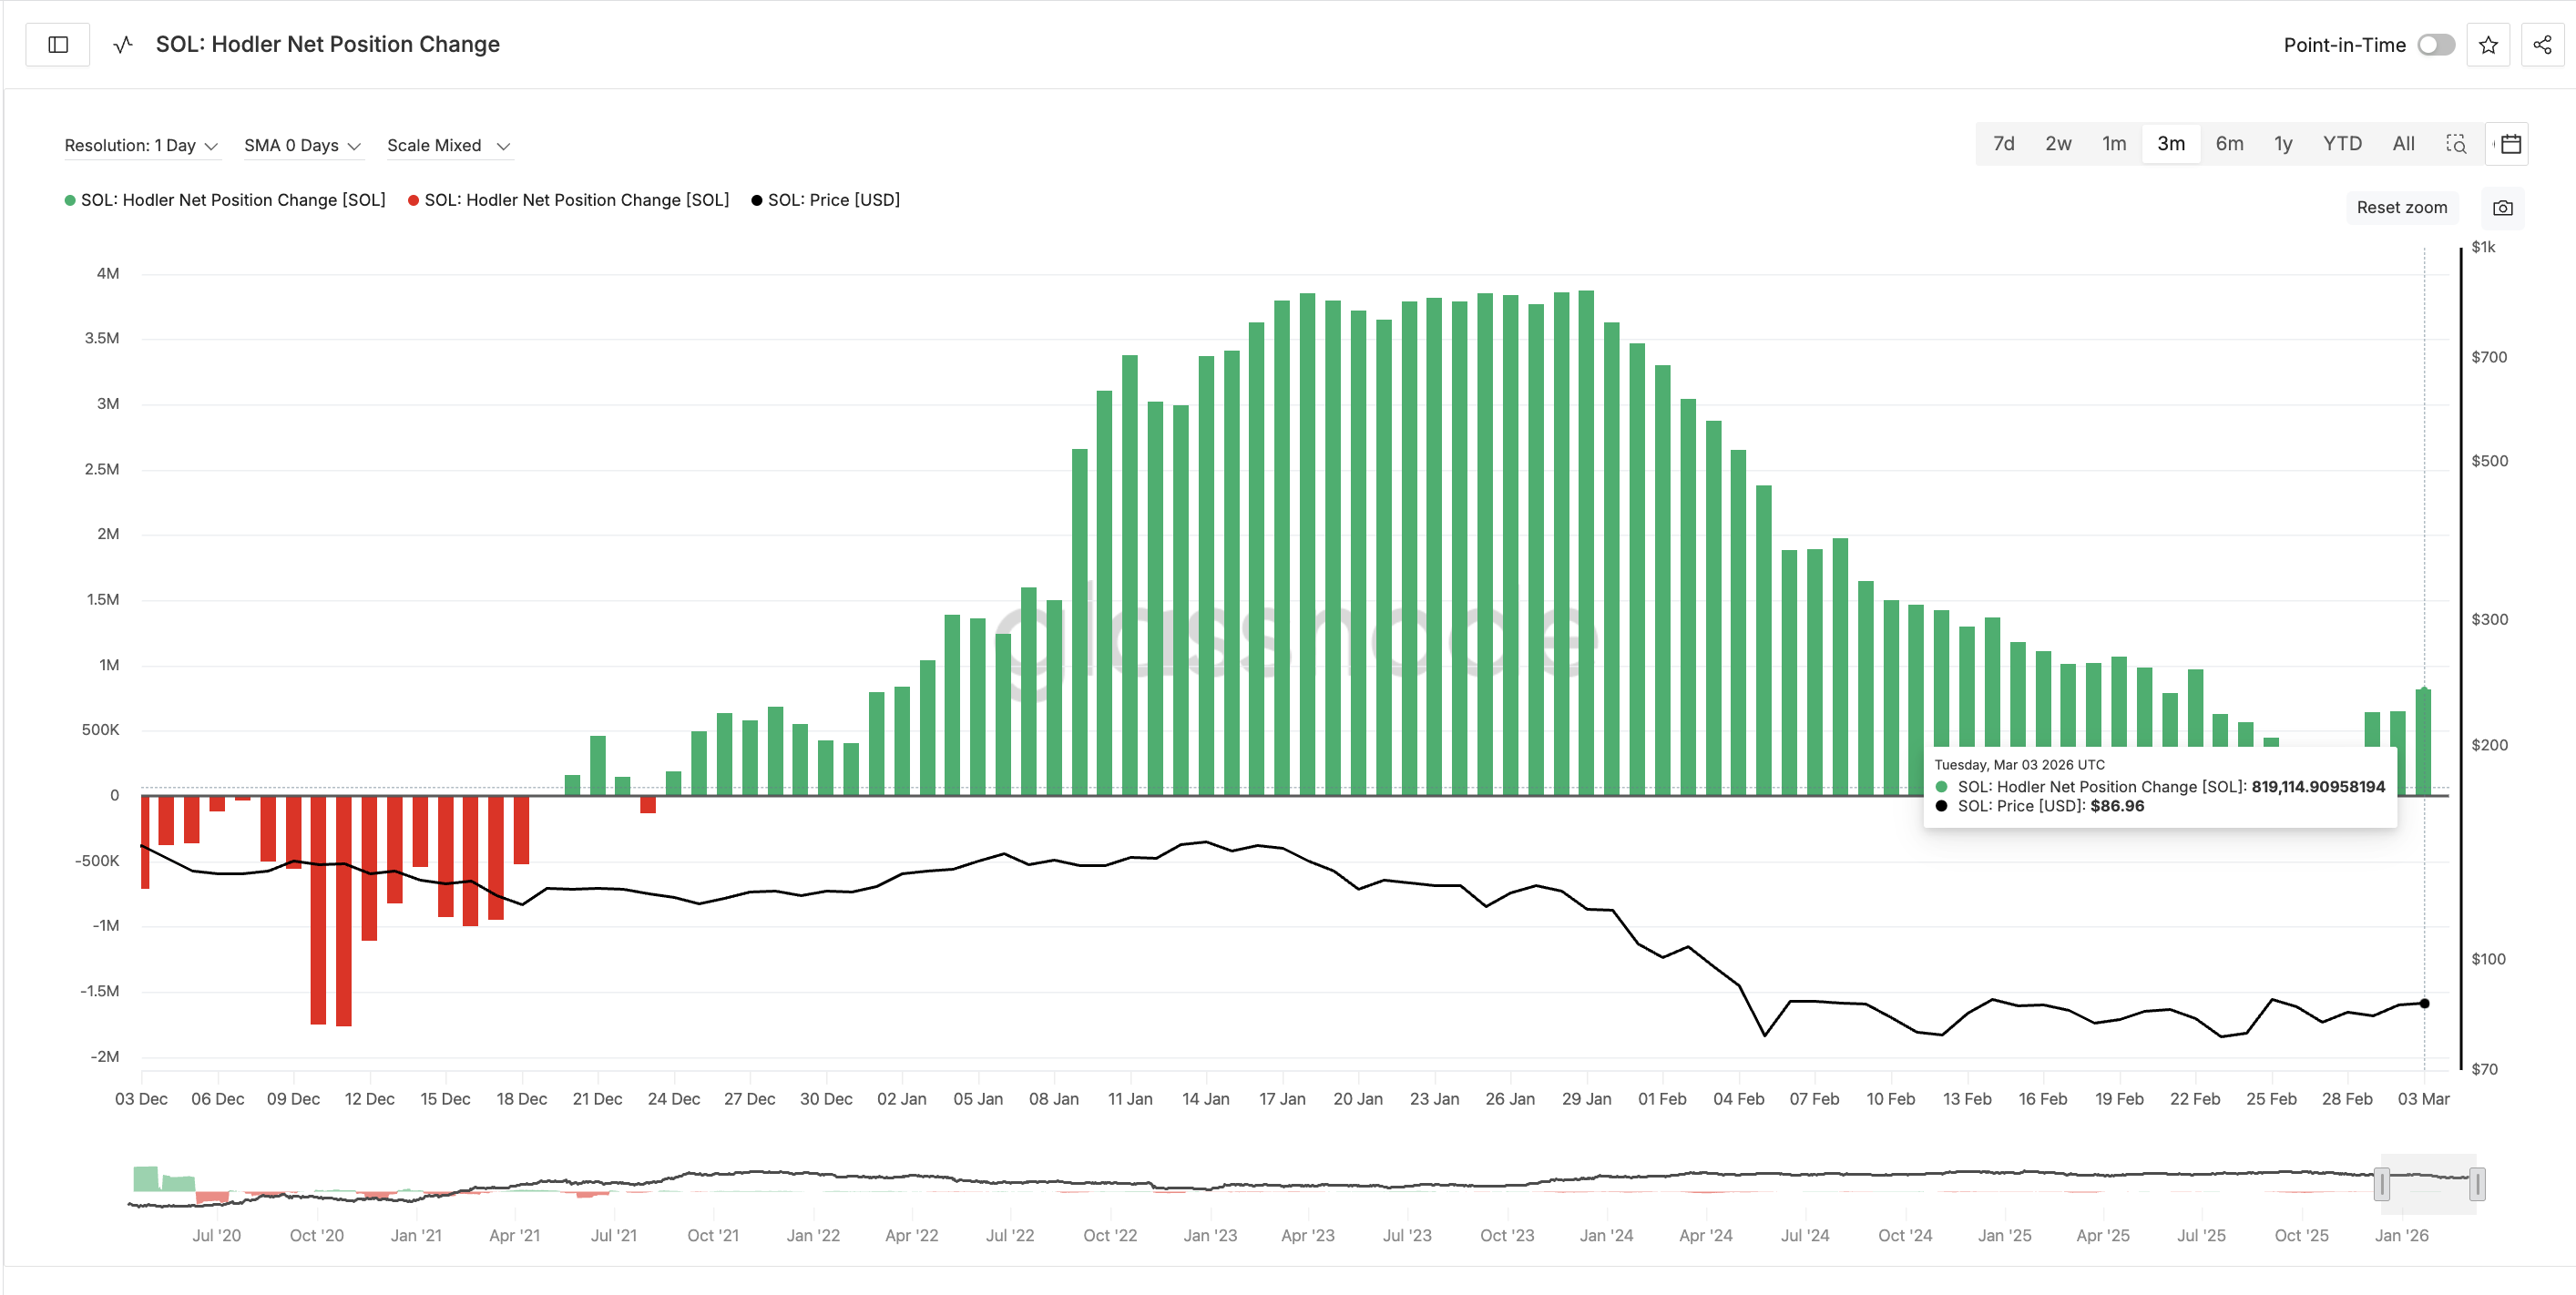
This rise in long-term positions suggests that seasoned investors aren’t running for the hills just yet. However, there’s another metric that’s a little less optimistic-and it’s been known to spoil the party.
Rising Short-Term Holder Metric Has Historically Preceded Corrections
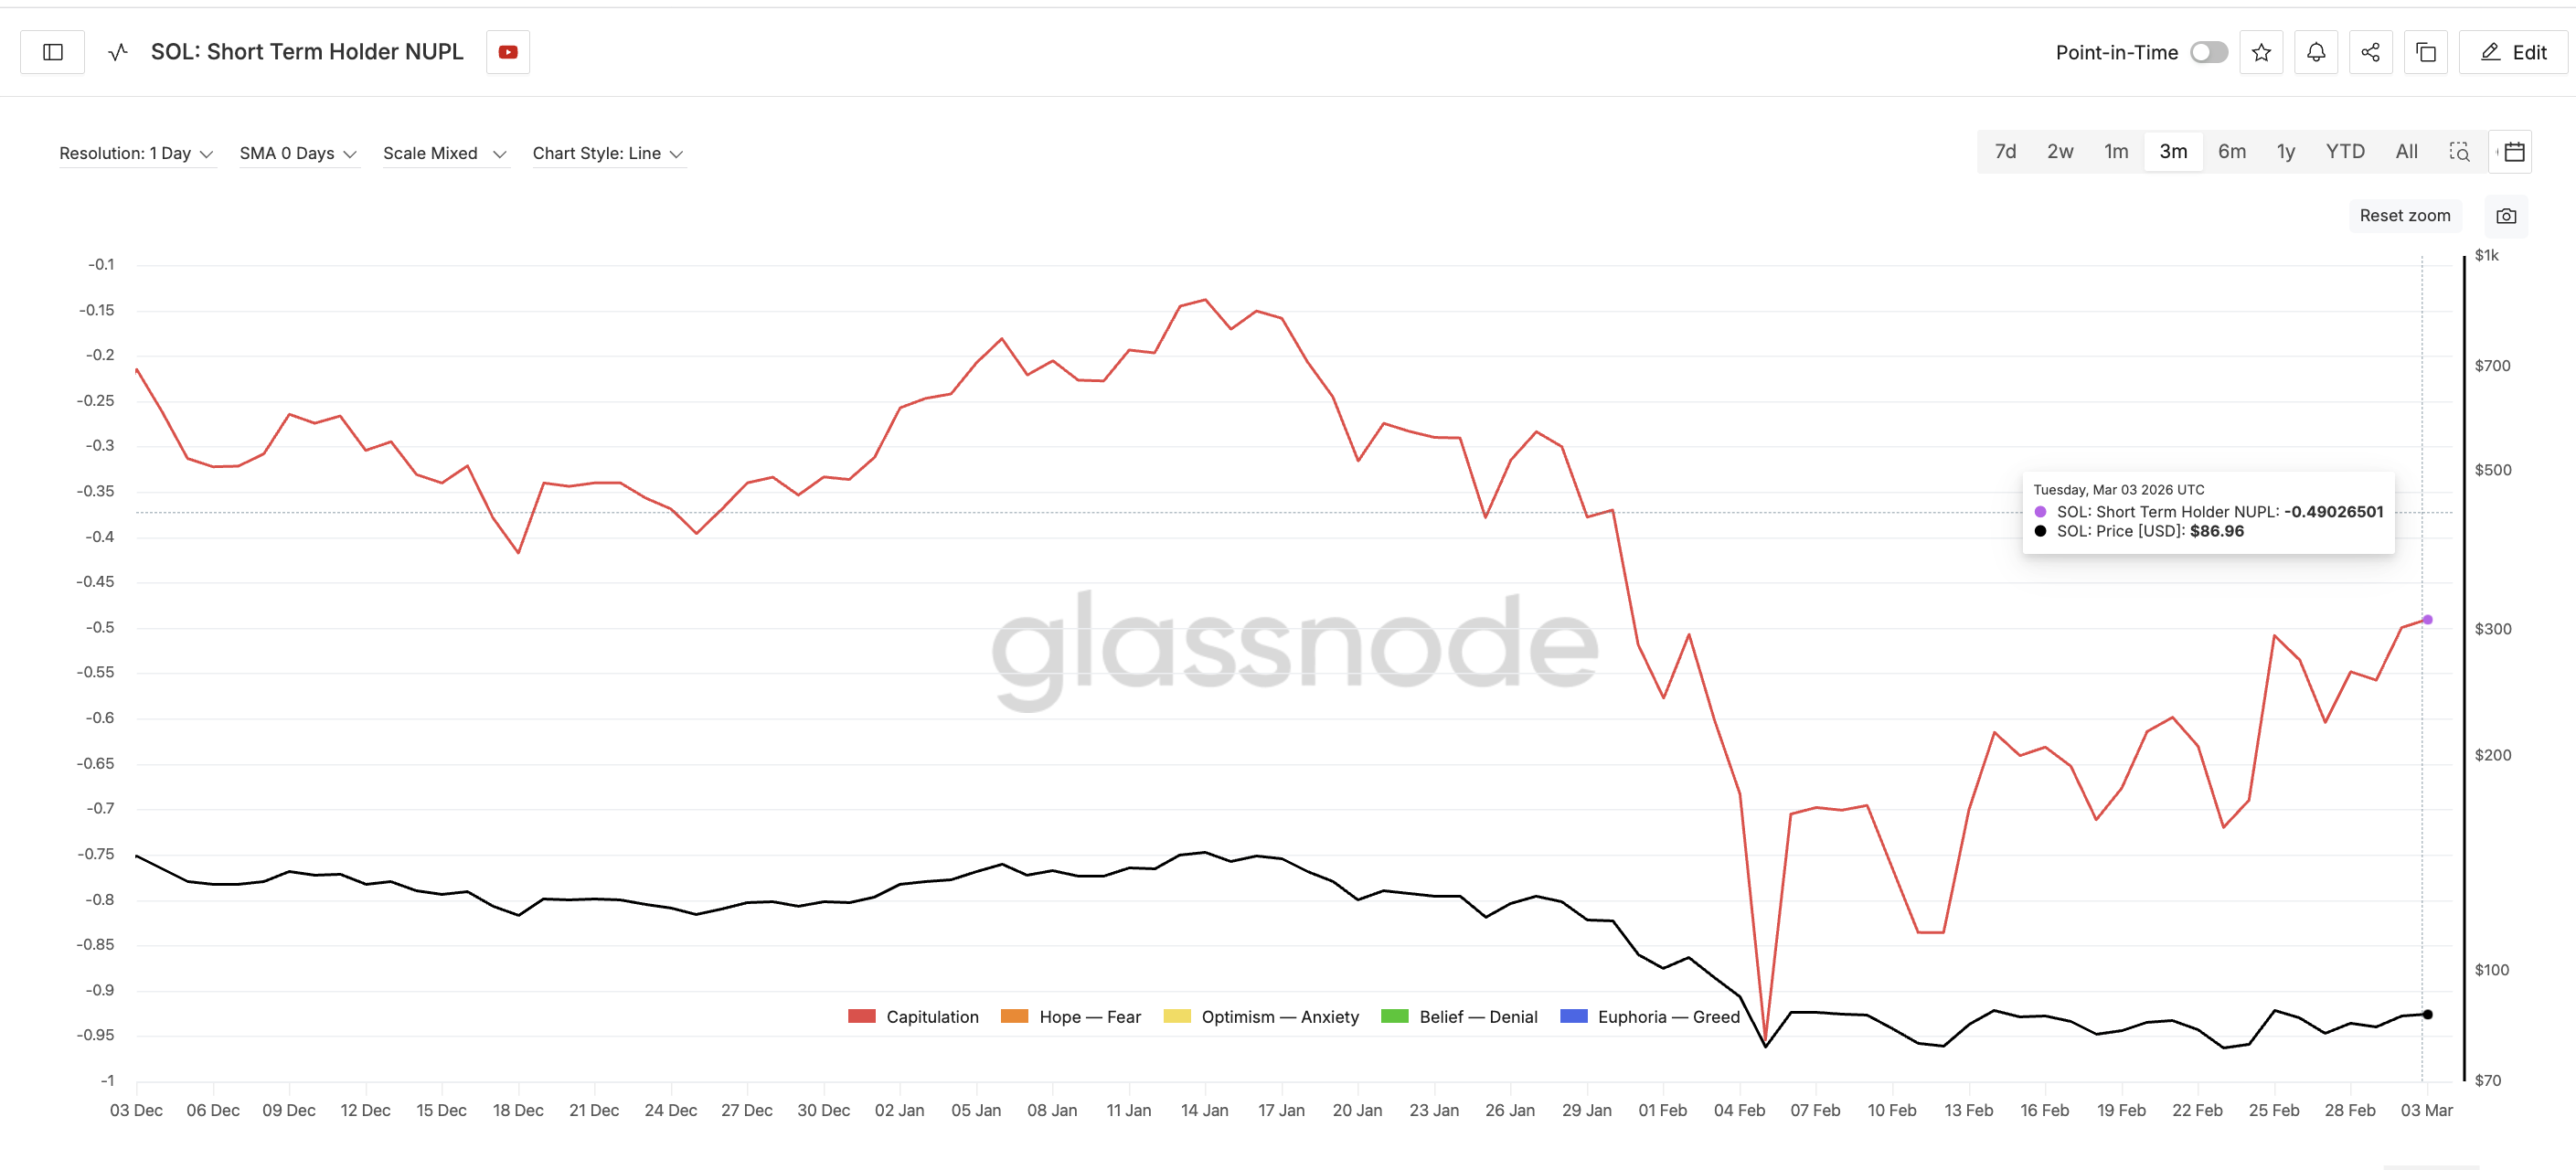
While the long-term investors are out there enjoying their Solana stash, the short-term traders are getting a little fidgety. This can be seen in the Short-Term Holder Net Unrealized Profit/Loss (NUPL) metric. As this metric rises, it indicates that traders are getting closer to breakeven. For Solana, it’s been a steady climb from −0.71 to −0.49 since February 23-a recovery of about 31%.
Want more token insights like this? Sign up for Editor Harsh Notariya’s Daily Crypto Newsletter here.
Even though the metric is still in the dreaded capitulation zone, it’s a sign that traders may soon be tempted to take profits. Or-more likely-reduce their losses. History has shown how this works out for Solana. On February 24, when the NUPL reached −0.50, Solana was hovering around $88. Within three days, it had dropped to $82-down by about 7%. Déjà vu, anyone?
Earlier in February, a similar scenario played out. On February 6, when the NUPL was near −0.70, Solana traded at $87. Six days later, it plummeted to $78. A 10% drop-just like clockwork.
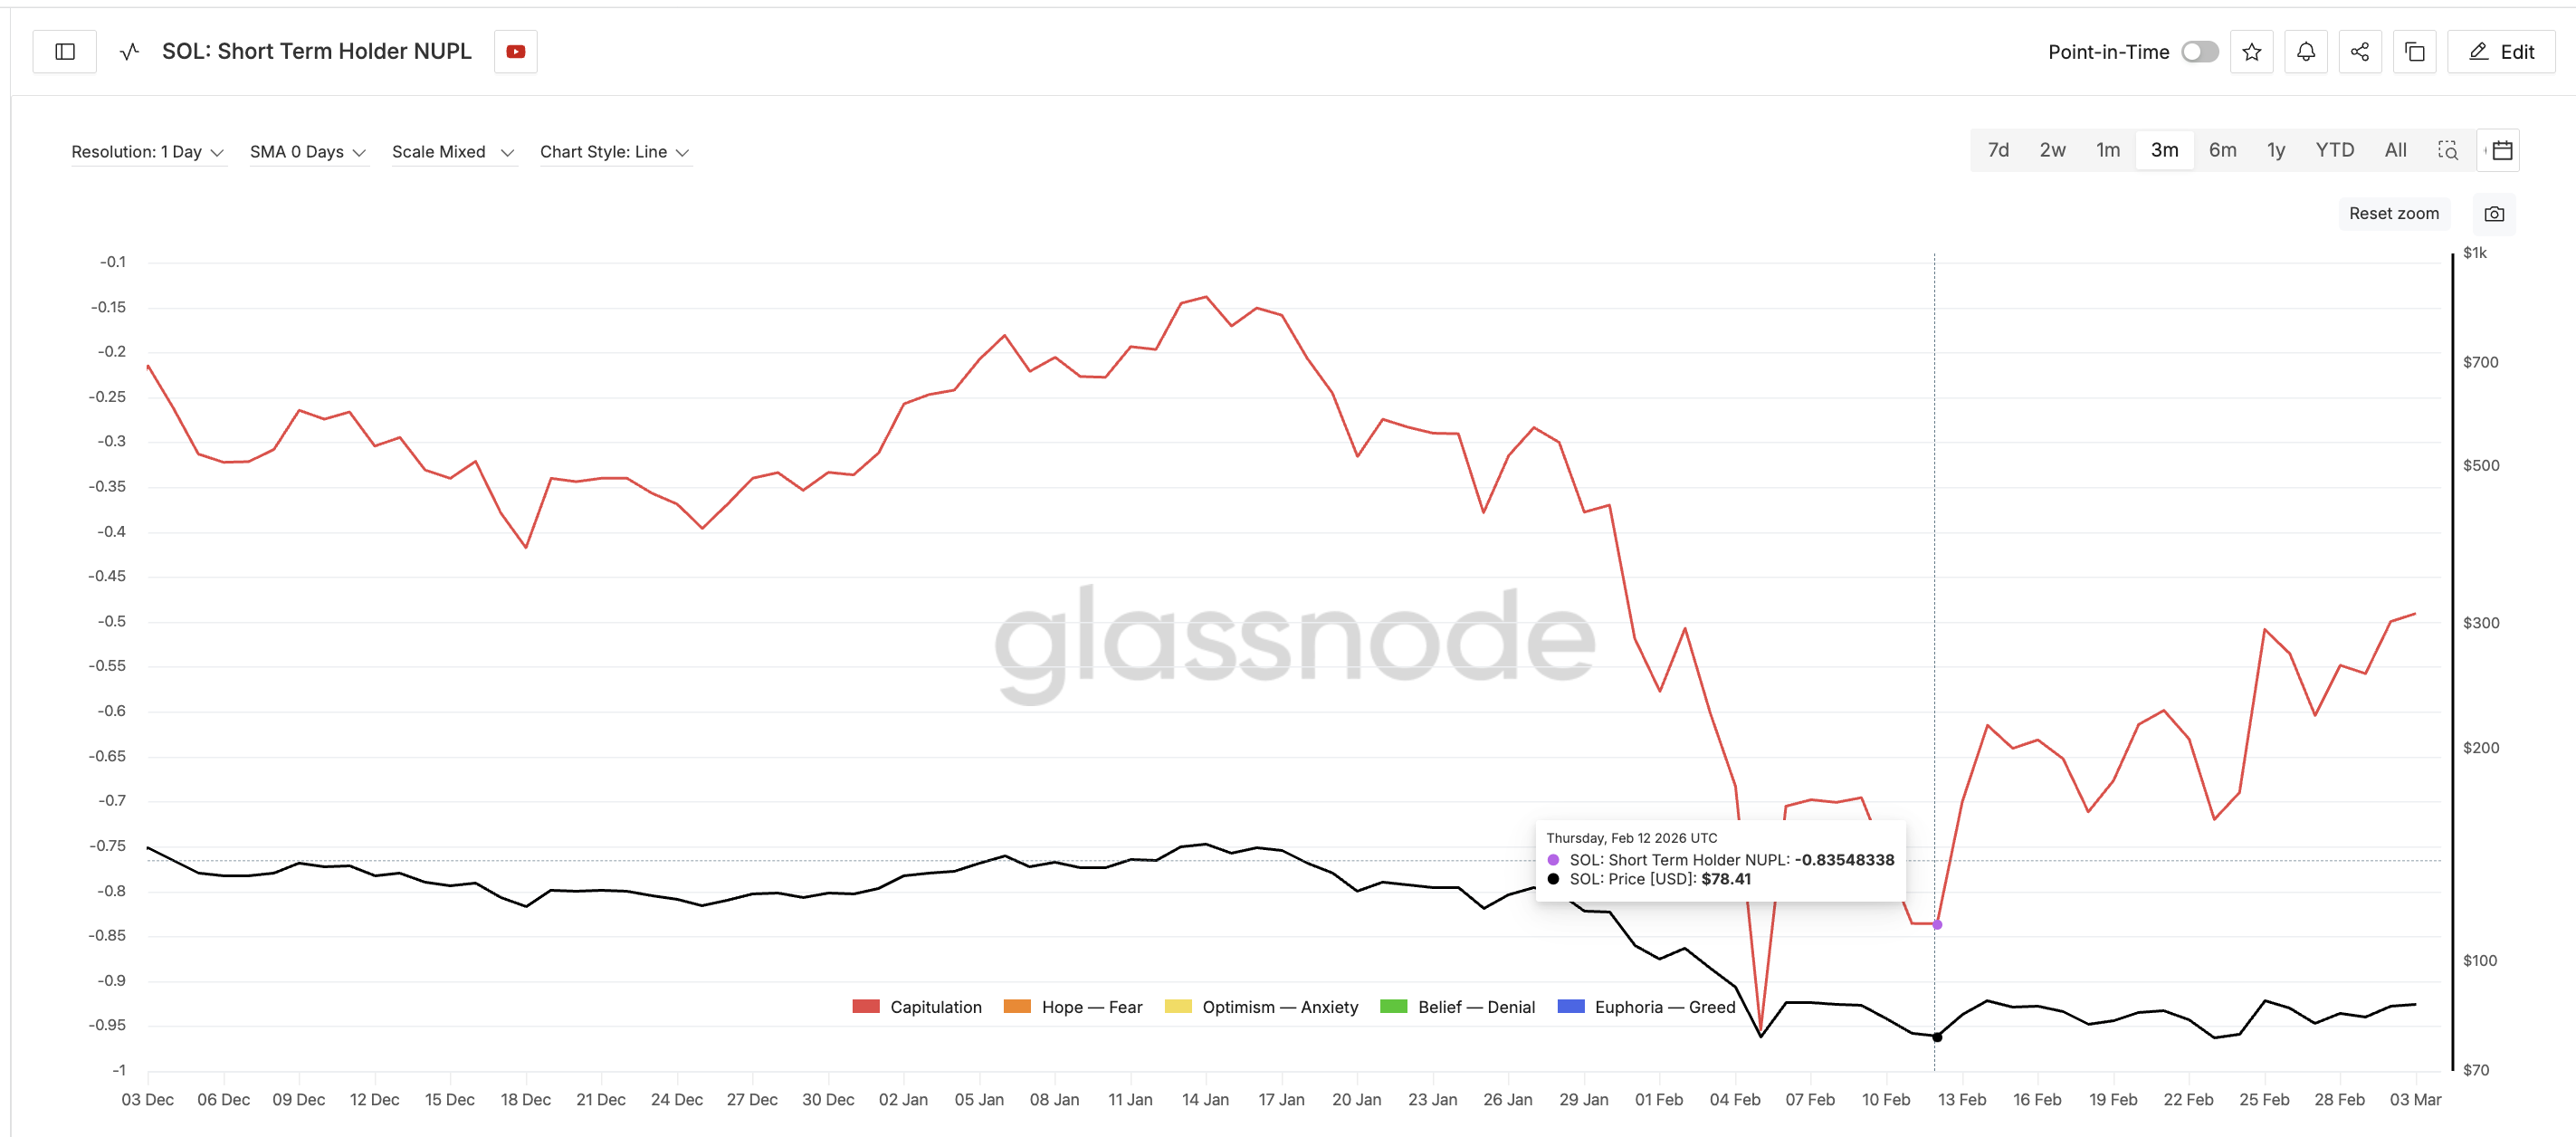
It’s these patterns that give the rising NUPL metric a slightly ominous air. Traders may not be taking profits-but they might be getting antsy enough to sell simply to reduce losses when the price rebounds.
A Major SOL Supply Cluster Could Amplify Selling Pressure
Now, let’s talk about the cost basis distribution-an elegant name for a very important metric. This tracks where large groups of investors bought their tokens. And there’s a significant cluster between $86.80 and $87.80-around $86-$88, to be precise. Over 14 million SOL were acquired in this zone.
When the price nears these levels, traders who bought in earlier might feel the urge to sell, hoping to break even. Short-term holders are already inching toward the territory where they might start unloading. If Solana rebounds towards this zone, the selling pressure could become quite substantial.
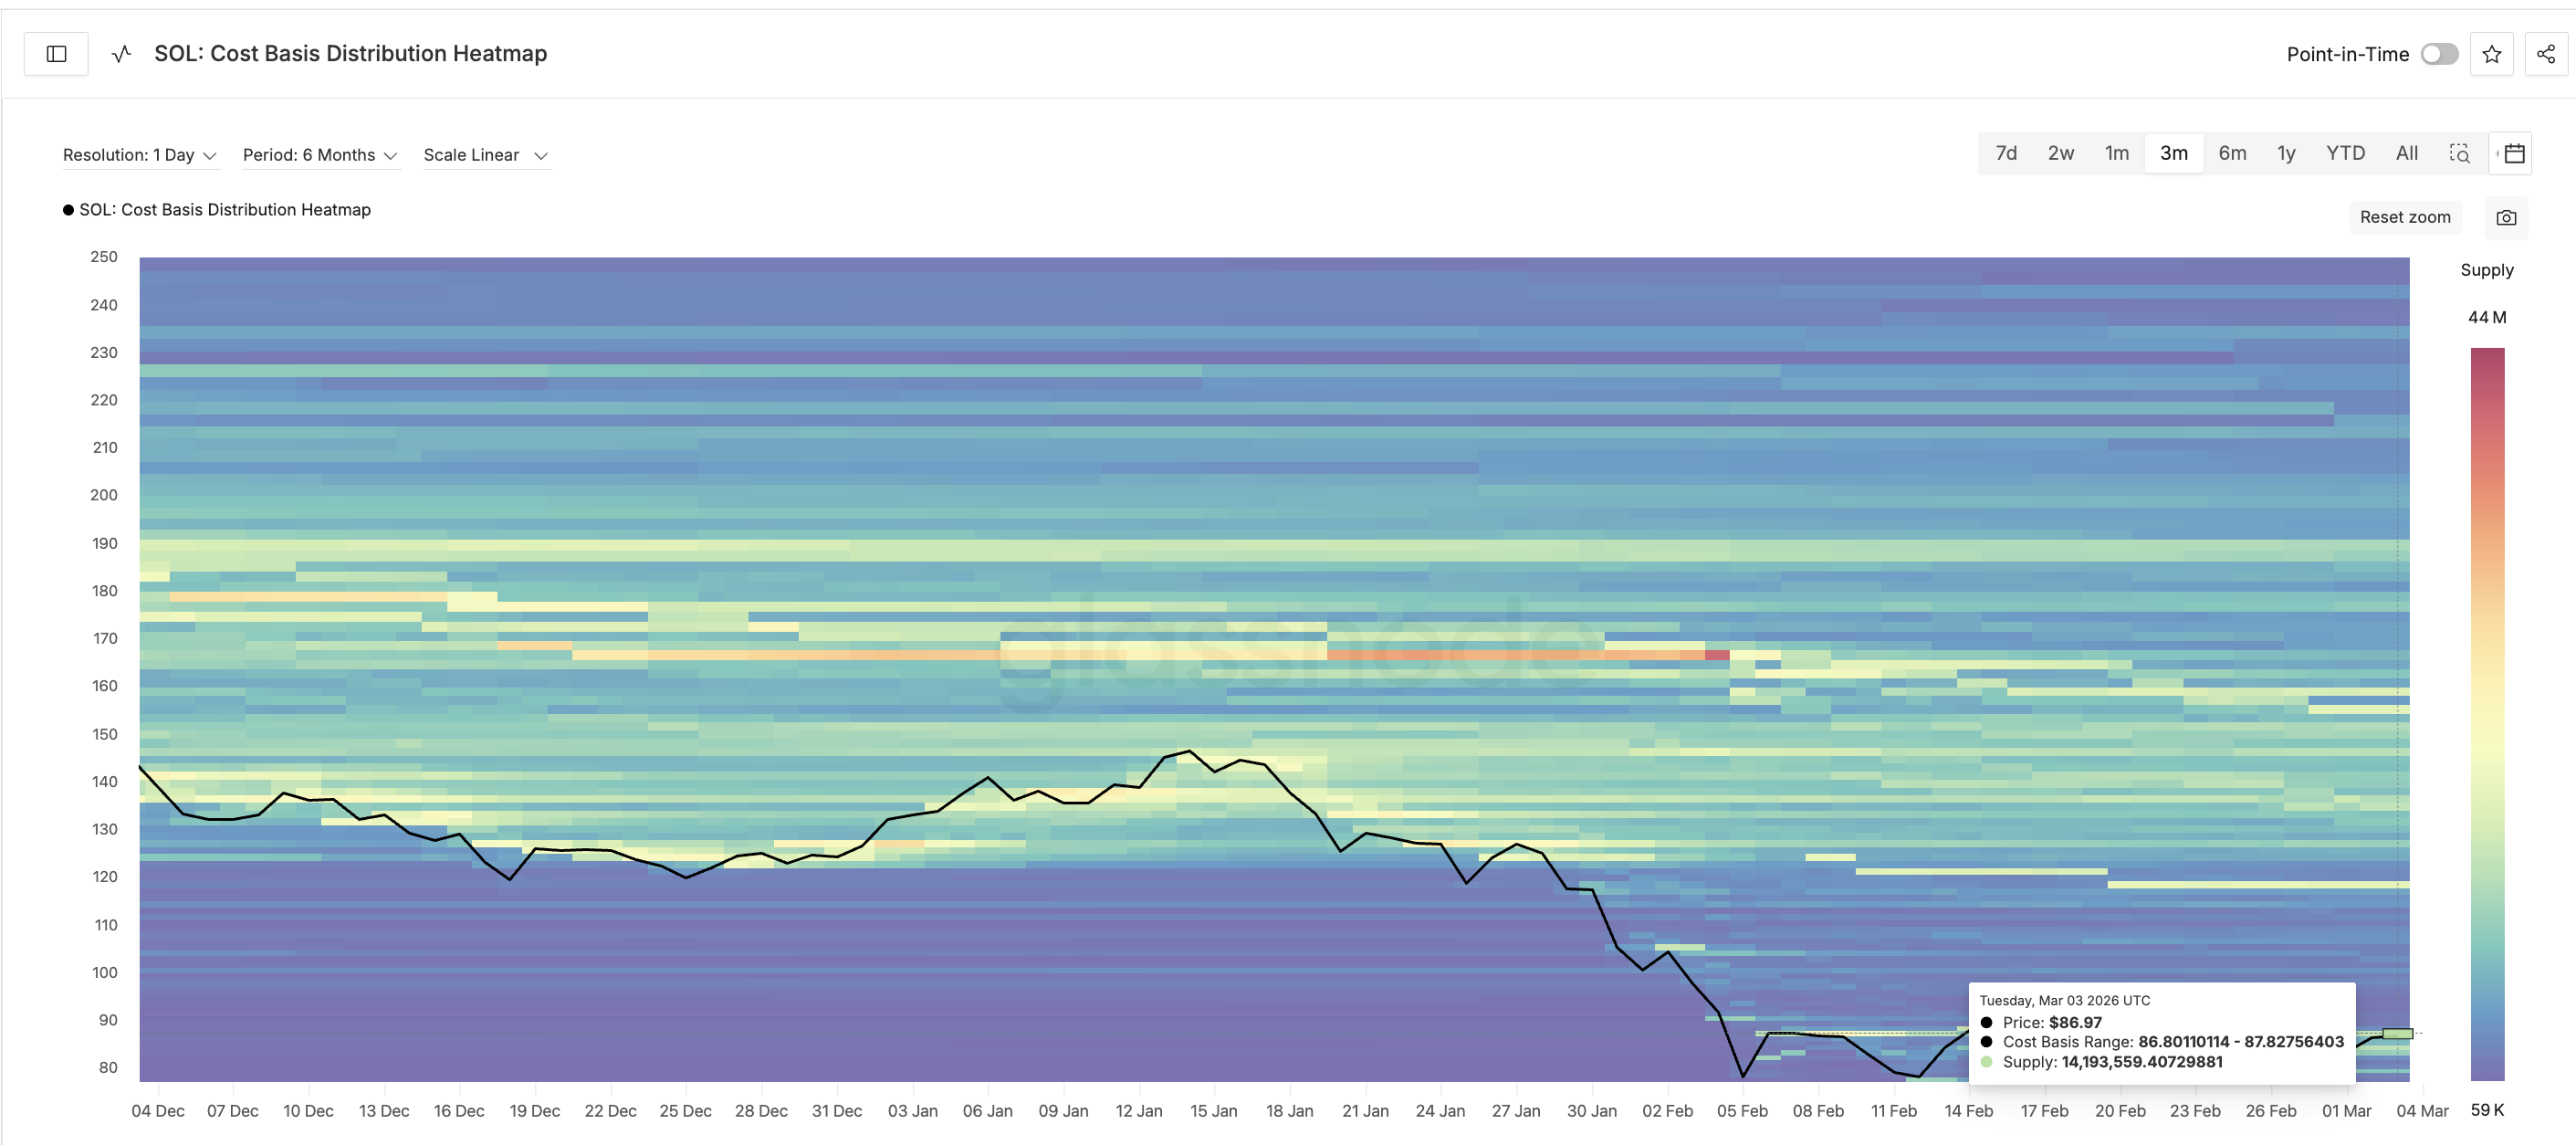
In other words, this cost basis cluster is the equivalent of a no-entry sign-if Solana rises to this range, expect some profit-taking and resistance. The 7-10% pullback pattern we’ve seen earlier this month could very well repeat itself.
The $86-$89 Zone Now Decides the Next Solana Price Move
Solana is currently flirting with the $83 mark, which places it just beneath the $86 resistance zone-the area where our cost-basis data suggests traders may start selling to lock in losses. The first real hurdle is at $86, which also happens to align with the 20-day EMA. A close above this level would indicate that buyers are gaining the upper hand.
However, the real test is a move above $89. If Solana can push past this level, it will have cleared the resistance zone without triggering heavy selling. That could send the price soaring toward $92, $96, and perhaps even $101. But if it fails to break this resistance, well, let’s just say history isn’t on its side.
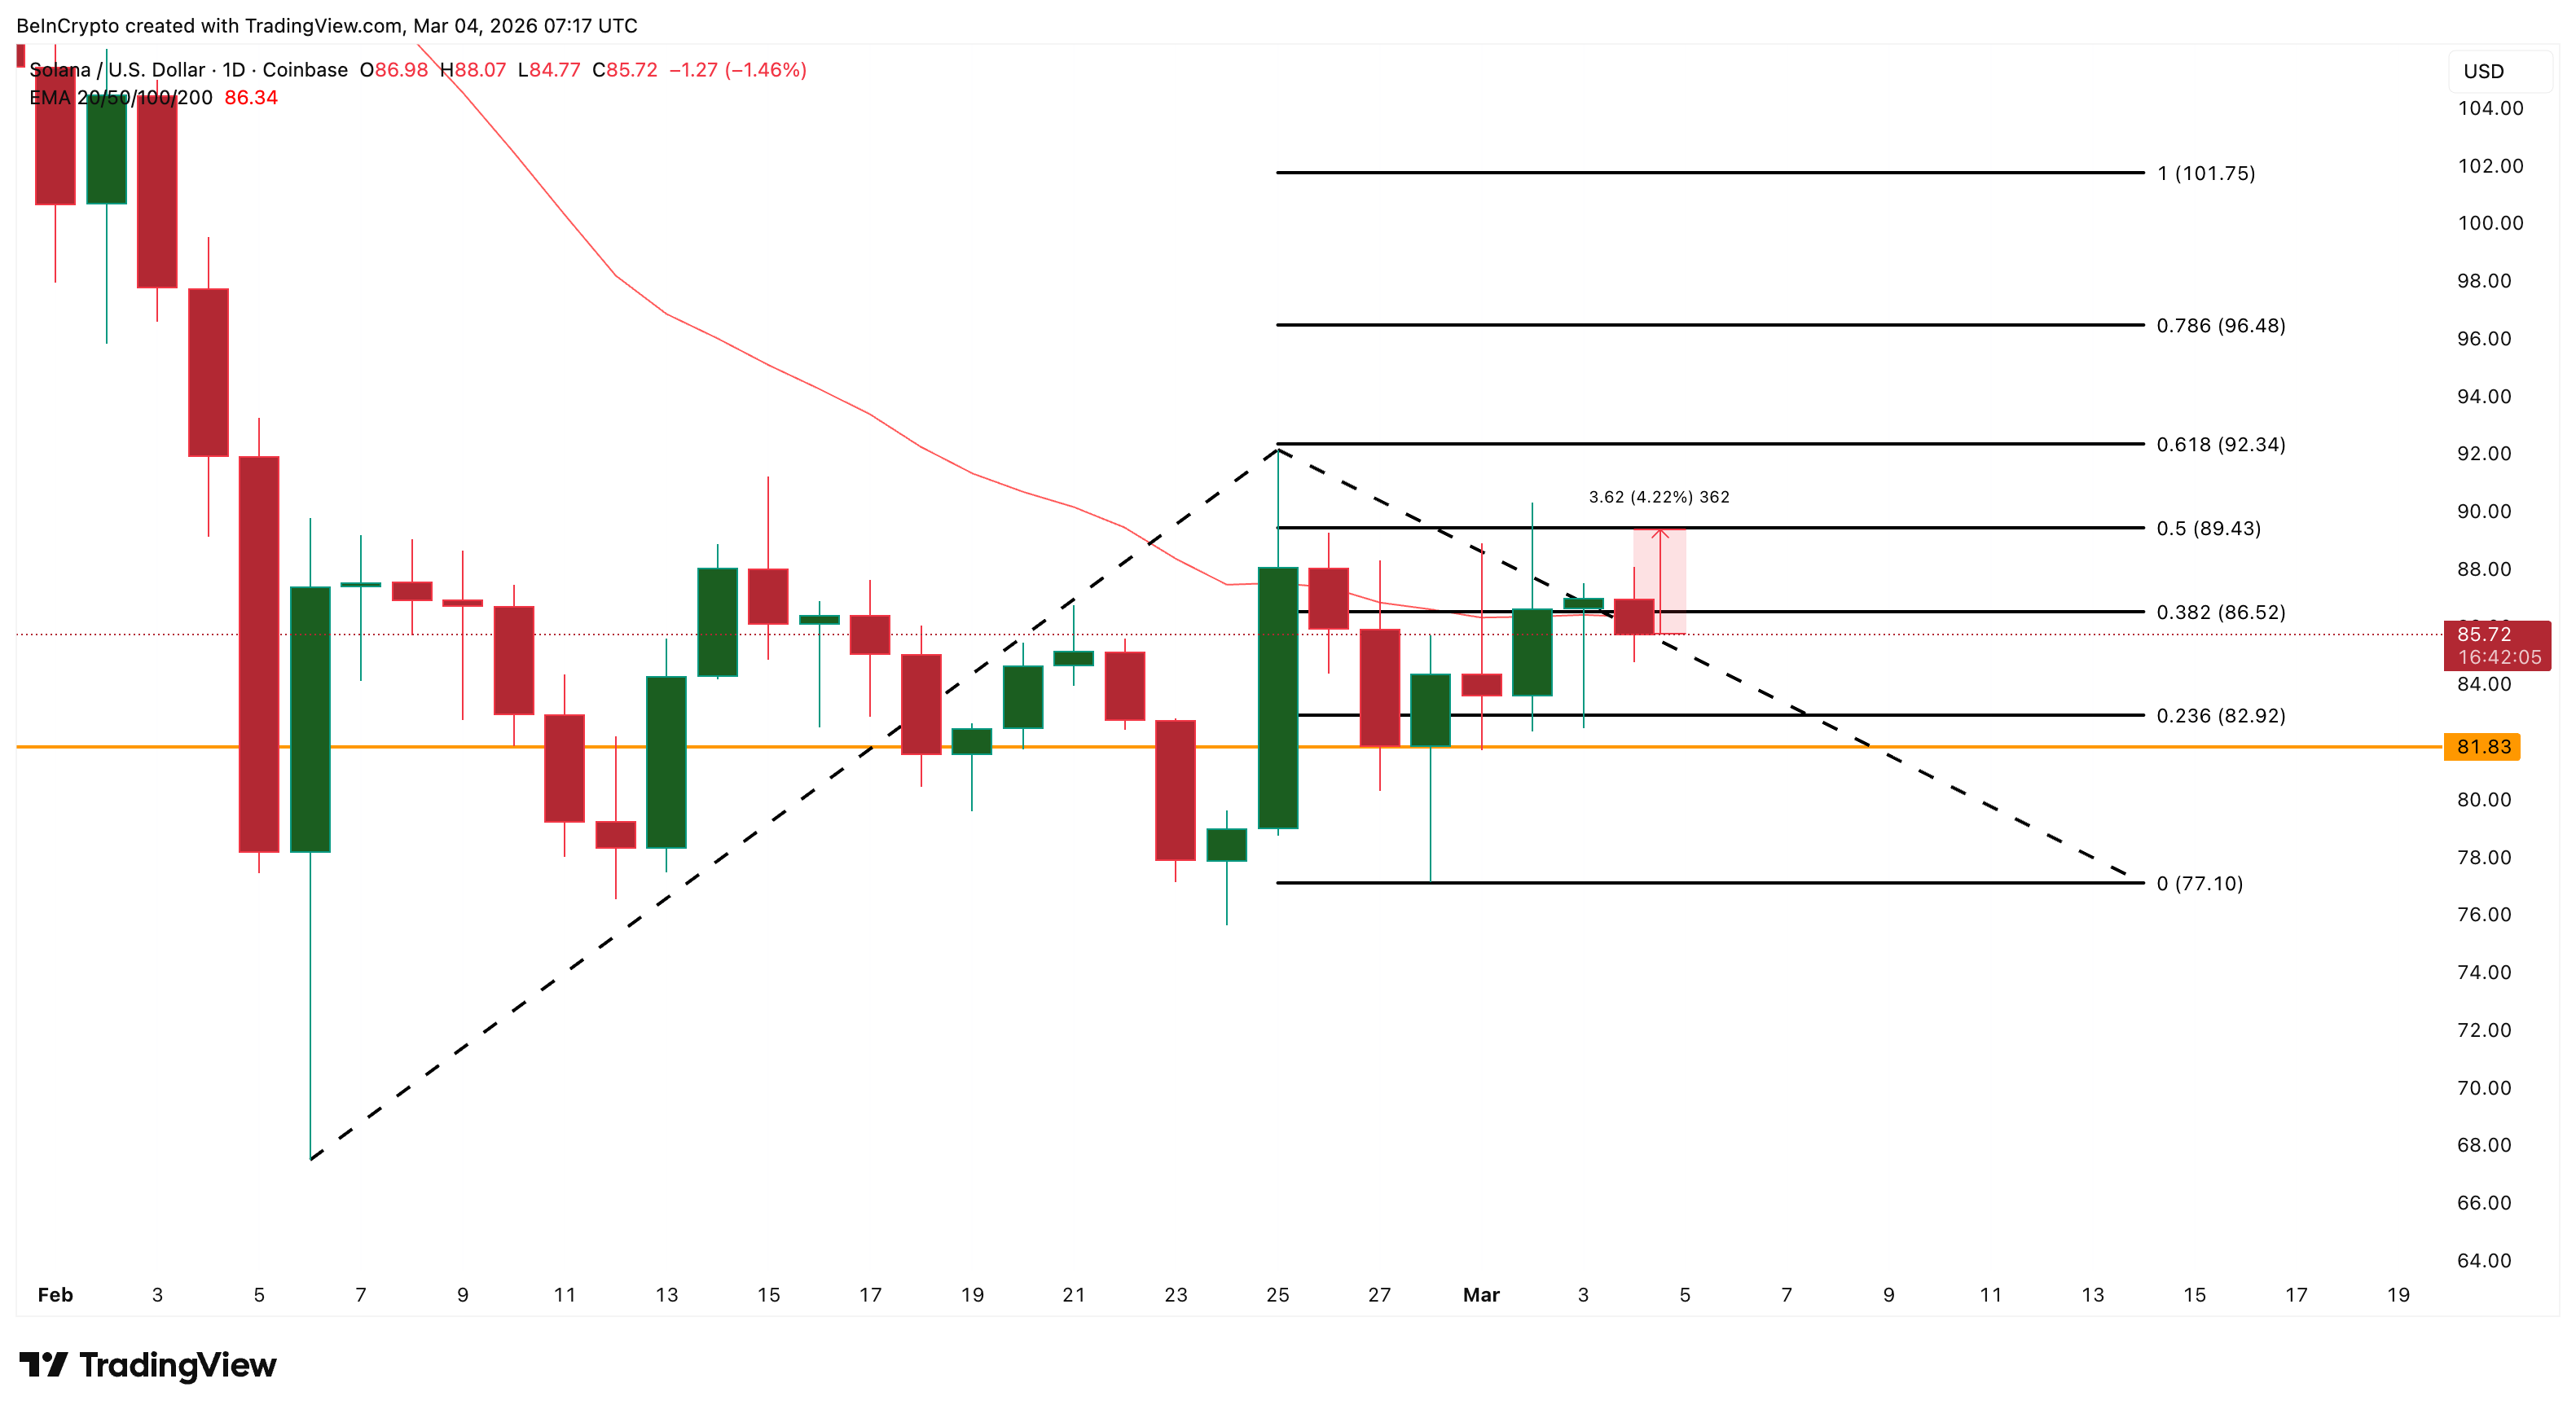
If Solana falls below $82, a trip back to $77 might be on the cards. That would represent a 7-10% correction, following the familiar pattern. So while the reversal setup remains intact for now, we’re not out of the woods just yet.
Read More
- Gold Rate Forecast
- Top 15 Insanely Popular Android Games
- Did Alan Cumming Reveal Comic-Accurate Costume for AVENGERS: DOOMSDAY?
- 4 Reasons to Buy Interactive Brokers Stock Like There’s No Tomorrow
- EUR UAH PREDICTION
- Silver Rate Forecast
- DOT PREDICTION. DOT cryptocurrency
- ELESTRALS AWAKENED Blends Mythology and POKÉMON (Exclusive Look)
- New ‘Donkey Kong’ Movie Reportedly in the Works with Possible Release Date
- Core Scientific’s Merger Meltdown: A Gogolian Tale
2026-03-04 15:16