Well, strap in, folks, because Bitcoin’s daily chart has just done the financial equivalent of a backflip while juggling chainsaws. Apparently, it’s confirmed a “bullish divergence,” which sounds like something you’d hear at a rodeo, not a financial report. Liquidations, meanwhile, have spiked like a caffeine-fueled trader after six cups of espresso. Monday was a wild one, and the crypto world is now eyeing the $71k resistance level like it’s the last slice of pizza at a party.
- Bitcoin’s Relative Strength Index (RSI) has decided to go rogue and form a bullish divergence. Who knew charts could be so dramatic?
- This week’s economic data-including the FOMC minutes from January-might as well be called “Bitcoin’s Fate: The Sequel.” Popcorn not included.
- Over $75 million in Bitcoin futures positions got liquidated. Ouch. Someone’s coffee budget just took a hit.
So, the daily chart for Bitcoin shows its RSI throwing a little rebellion against the price, which has been sulking in a downtrend since mid-January. Imagine your mood after realizing you left your wallet at the bar-that’s Bitcoin right now.
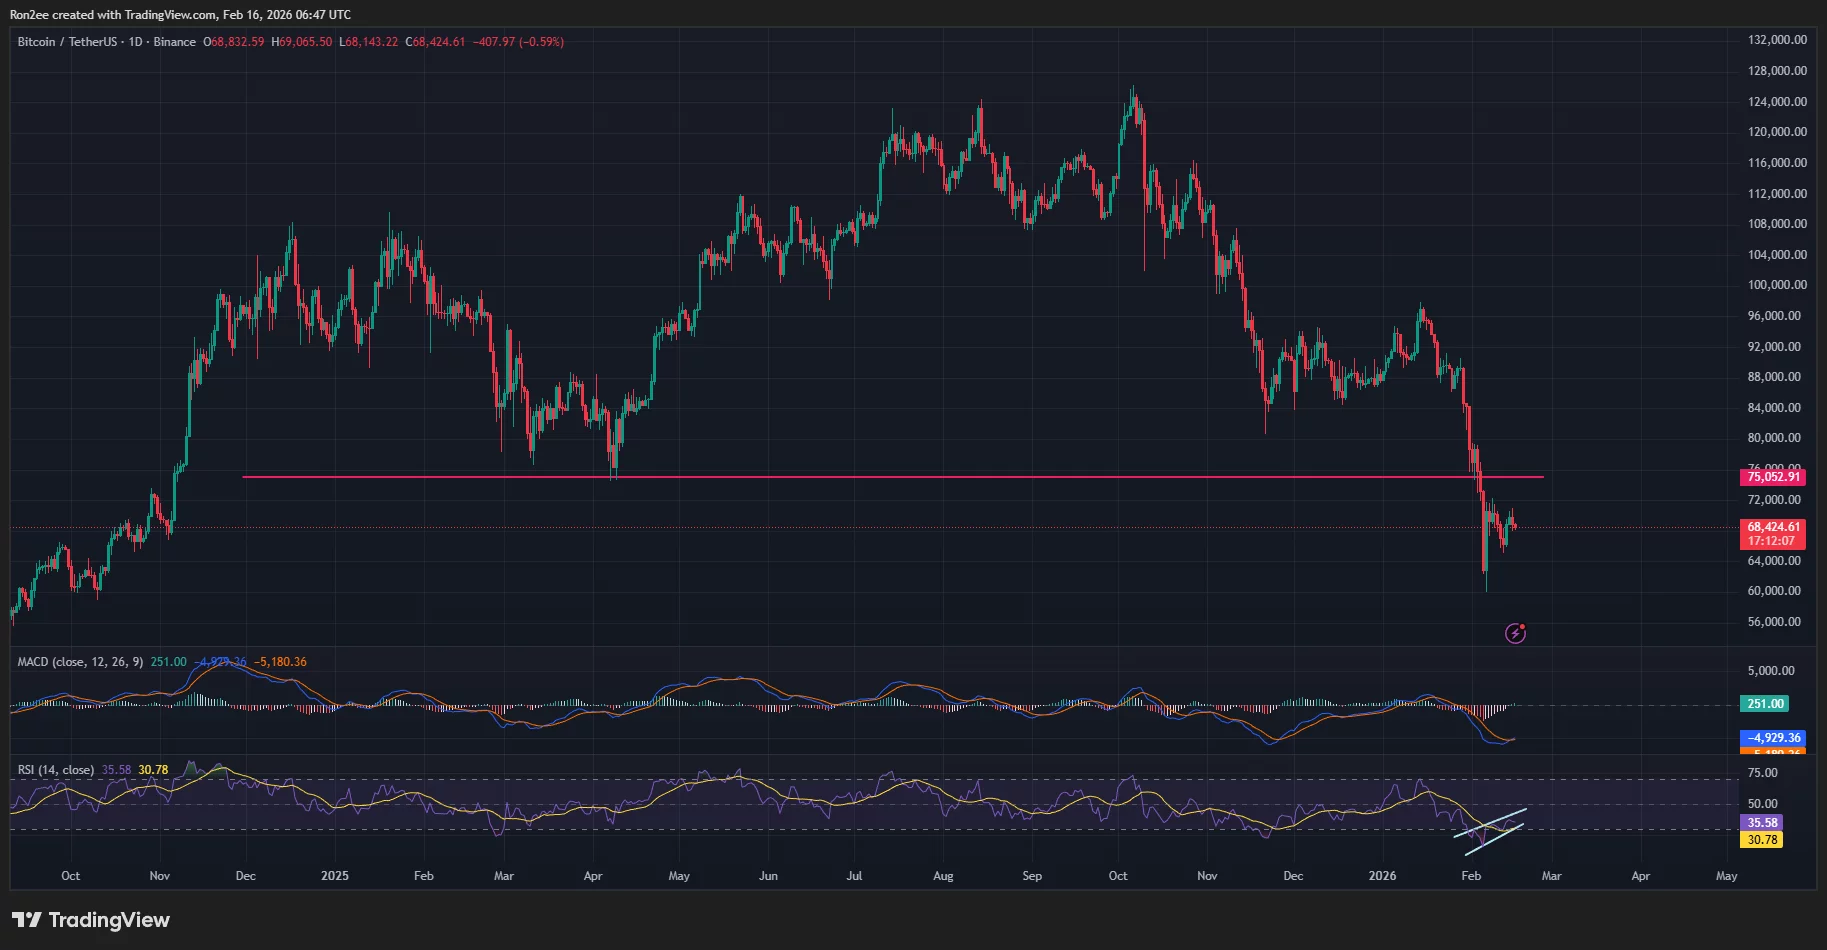
This “bullish RSI divergence” is financial jargon for “things might get interesting.” It happens when the RSI starts feeling optimistic while the price is still moping around, setting lower lows. Historically, this has been the chart’s way of saying, “Hold my beer, I’ve got this,” before a trend reversal or a relief rally.
And let’s not forget the MACD histogram and moving averages, which are basically the backup dancers in this financial ballet. The MACD line just crossed over the signal line, which is apparently a big deal. Bulls are starting to flex their muscles, and the market is watching like it’s a soap opera.
Bitcoin Bulls: Will They Stick the Landing or Faceplant?
All this comes after Bitcoin bulls tried to stage a comeback when the price dipped near $65k on Thursday. It rebounded like a trampoline, but then hit a wall at $71k-again. Investors are sitting on the sidelines, sipping tea and waiting for this week’s economic data to drop like a mic.
First up, Federal Reserve Governor Michael S. Barr is set to talk about AI and the labor market on Wednesday. Riveting stuff. Also on Wednesday, the Fed will release the minutes from its January meeting, which will either be a snoozefest or a bombshell. And on Friday, the U.S. drops its Q4 GDP and core PCE inflation data, because why not end the week with a bang?
This macro data will supposedly tell us if the Fed plans to ease up on monetary policy for the rest of 2026. Bitcoin is waiting for this clarity like a kid waiting for Christmas morning. Will it get a new bike or a lump of coal? Stay tuned.
Key Levels to Watch (or Ignore, Depending on Your Risk Tolerance)
For now, Bitcoin seems to be aiming higher, with $71k as the next big hurdle. If it breaks through, $75k could be back on the menu. But if it stumbles and falls below $65k, we might see a retreat to the $60k lows from earlier this month. Thrilling, isn’t it?
Meanwhile, liquidations are sweeping through the crypto market like a leaf blower in autumn. In the past 24 hours, nearly $300 million got wiped out, with Bitcoin alone losing $75 million. It’s like a financial version of musical chairs, and the music just stopped. Oops.
Read More
- 2025 Crypto Wallets: Secure, Smart, and Surprisingly Simple!
- Gold Rate Forecast
- Here Are the Best TV Shows to Stream this Weekend on Paramount+, Including ‘48 Hours’
- Top 15 Celebrities in Music Videos
- Top 20 Extremely Short Anime Series
- Where to Change Hair Color in Where Winds Meet
- 20 Films Where the Opening Credits Play Over a Single Continuous Shot
- Top gainers and losers
- 50 Serial Killer Movies That Will Keep You Up All Night
- 20 Must-See European Movies That Will Leave You Breathless
2026-02-16 11:24