Author: Denis Avetisyan
New research explains why likelihood-based anomaly detection, often unreliable with images, performs surprisingly well with tabular data when using deep generative models.

The study demonstrates that the intrinsic dimensionality of tabular data mitigates the counterintuitive failures observed in image anomaly detection with normalizing flows.
While deep generative models offer a principled approach to anomaly detection via likelihood estimation, a counterintuitive failure mode-assigning higher likelihoods to anomalous data-is well-documented in domains like image analysis. This paper, ‘Why the Counterintuitive Phenomenon of Likelihood Rarely Appears in Tabular Anomaly Detection with Deep Generative Models?’, investigates this phenomenon in the context of tabular data, demonstrating its surprisingly infrequent occurrence. Through extensive experimentation on diverse datasets, we find that likelihood-based anomaly detection with normalizing flows generally performs reliably in tabular settings. This raises the question of whether intrinsic differences in data dimensionality and feature correlation explain this discrepancy, and if these insights can further refine anomaly detection strategies.
The Elusive Signal: Anomalies in Complex Data
The detection of anomalies-those rare instances that deviate from expected patterns-proves essential across a remarkably broad spectrum of applications, ranging from identifying fraudulent transactions and network intrusions to predicting equipment failures in predictive maintenance and even discovering critical flaws in medical diagnoses. However, conventional anomaly detection techniques, often reliant on statistical methods assuming simple data distributions, increasingly falter when confronted with the realities of modern datasets. These datasets are characterized by high dimensionality – a vast number of variables – and intricate relationships, rendering simplistic models inadequate and leading to either a flood of false alarms or, more concerningly, the failure to identify genuinely critical anomalies that demand immediate attention. The challenge isn’t merely finding something different, but discerning meaningful deviations from the norm within a complex information landscape.
Establishing a reliable baseline of ‘normal’ data is paramount in anomaly detection, yet proving surprisingly difficult due to inherent complexities within the data itself. Many datasets aren’t neatly distributed according to simple statistical models; instead, they exhibit non-linearity, seasonality, or intricate dependencies between variables. This means that algorithms designed to capture typical patterns often fall short, either by oversimplifying the data or failing to account for subtle variations. Consequently, differentiating between genuine anomalies and legitimate, albeit unusual, occurrences becomes a significant challenge, hindering the effectiveness of predictive systems and requiring increasingly sophisticated modeling techniques to accurately represent the true scope of normal behavior.
The increasing scale and intricacy of modern datasets pose a significant challenge to anomaly detection systems. Traditional approaches frequently rely on assumptions of data distribution – such as normality – that become increasingly inaccurate as data dimensionality and complexity grow. This simplification leads to a higher incidence of false positives, where normal behaviors are incorrectly flagged as anomalous, and, more critically, a failure to identify genuinely critical anomalies hidden within the noise. Consequently, systems built on these outdated assumptions struggle to provide reliable insights, particularly in dynamic environments where subtle deviations can indicate significant issues; the very act of over-flagging normal activity obscures the signal of true anomalies, diminishing the effectiveness of preventative measures and increasing the risk of unforeseen consequences.
The Geometry of Data: Dimensionality and Correlation
The intrinsic dimension of a dataset refers to the number of independent parameters necessary to represent the data effectively, which may be significantly lower than the total number of features. As dimensionality increases, the data becomes increasingly sparse in the feature space, a phenomenon known as the “curse of dimensionality.” This sparsity directly impacts anomaly detection because distances between data points become less meaningful and the likelihood of false positives increases. Specifically, the volume of the feature space grows exponentially with the number of dimensions, requiring exponentially more data to maintain a consistent data density and reliable statistical comparisons. Consequently, algorithms designed for lower-dimensional spaces often fail in high-dimensional scenarios, necessitating dimensionality reduction techniques or algorithms specifically designed to address this challenge.
Feature correlation significantly impacts anomaly detection accuracy. When features are highly correlated, the influence of one feature on an anomaly may be obscured by the predictable variation in the correlated feature. This can lead to a reduction in the signal-to-noise ratio, making it difficult to isolate true anomalies. Furthermore, assuming feature independence when it does not exist can distort the perceived data distribution, resulting in inaccurate statistical modeling and misidentification of outliers. For example, in a dataset where height and weight are strongly correlated, an unusual weight might be incorrectly flagged as an anomaly if the corresponding height is not considered, or vice versa. Therefore, understanding and accounting for feature dependencies is crucial for reliable anomaly detection and accurate data interpretation.
Traditional statistical measures, such as Pearson correlation, often fail to fully represent complex feature relationships beyond linear dependencies. Methods like mutual information, distance correlation, and kernel-based techniques provide more comprehensive assessments by capturing non-linear associations and higher-order interactions. These approaches analyze data structure through various means – examining shared information between variables, measuring dependence without assuming a functional form, or mapping data into higher-dimensional spaces to reveal hidden patterns. Utilizing these advanced techniques allows for a more accurate depiction of feature interdependence, which is crucial for robust anomaly detection and improved data interpretation, especially in datasets exhibiting intricate relationships beyond simple linear correlation.
A Toolkit for Discernment: Modern Approaches to Anomaly Detection
Several established methods address anomaly detection, each exhibiting performance variations based on data characteristics. One-Class Support Vector Machines (OCSVM) are effective when dealing with high-dimensional data and well-defined normal class boundaries, but require careful parameter tuning. Isolation Forest (IF) excels at identifying anomalies as isolated points, performing efficiently on large datasets and requiring minimal parameterization; however, its effectiveness diminishes with high-dimensional data. COPOD, based on collective probability outlier detection, is particularly suited for detecting contextual anomalies and performs well with mixed data types, though it can be computationally expensive for very large datasets. The optimal choice depends on factors such as data dimensionality, the presence of contextual information, and computational resource constraints.
Deep learning methods are increasingly utilized for anomaly detection due to their capacity to learn intricate data representations. Deep Autoencoding Gaussian Mixture Models (DAGMM) combine the strengths of autoencoders for dimensionality reduction and Gaussian Mixture Models for density estimation, enabling the identification of anomalies as low-probability instances. Neural Trajectory Learning (NeuTraLAD) focuses on modeling the temporal evolution of data, particularly in sequential data, and identifies anomalies as deviations from learned trajectories. Both DAGMM and NeuTraLAD address limitations of traditional methods when dealing with high-dimensional, complex datasets by automatically extracting relevant features and capturing non-linear relationships within the data, thereby improving anomaly detection accuracy.
Normalizing Flows (NF) represent a class of generative models that learn complex data distributions by transforming a simple, known distribution – typically Gaussian – into the target distribution through a series of invertible transformations. This allows for the exact likelihood of a data point to be computed, a significant advantage over methods that only provide relative anomaly scores. NF-SLT (State-dependent Linear Transformations) is a specific NF architecture designed for time-series anomaly detection, employing linear transformations conditioned on the input state to efficiently model temporal dependencies. The learned likelihood function then serves as an anomaly score; low-likelihood data points are considered anomalous. This approach is particularly robust as it explicitly models the normal data distribution, rather than relying on distance-based or density-estimation heuristics, and avoids the limitations of assuming a specific distribution for the data.
Beyond Simple Likelihood: Refining the Signal
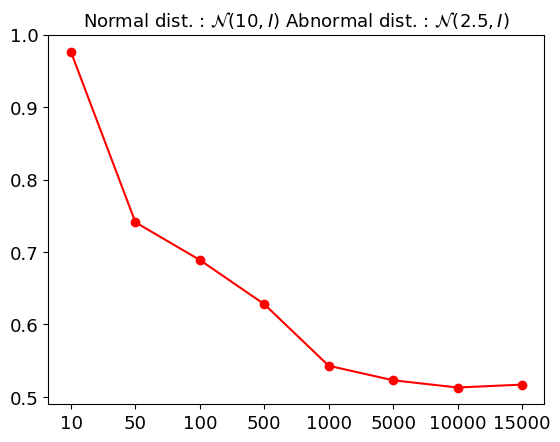
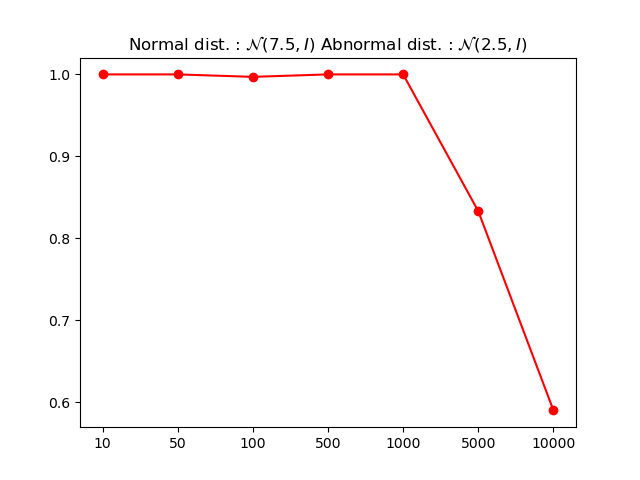
Anomaly detection systems often rely on likelihood scores – the probability a data point fits the established model – but this approach can falter when faced with intricate data distributions. The observed ‘counterintuitive phenomenon’ demonstrates that higher likelihood does not always equate to normality; a model may assign a high probability to an anomalous sample simply because it poorly represents the true underlying data generating process. This limitation arises because standard likelihood-based methods assume the model accurately captures the data distribution, an assumption frequently violated in real-world scenarios involving complex relationships and high-dimensional data. Consequently, relying solely on likelihood scores can lead to false negatives, where genuine anomalies are missed because the model fails to recognize their deviation from its imperfect representation of normal data, necessitating alternative approaches that focus on relational consistency or distributional robustness.
To overcome the limitations of relying solely on likelihood scores for anomaly detection, research has explored methods that prioritize data consistency and relational understanding. Techniques like Mutual Consistency Matching (MCM) and Implicit Contrastive Learning (ICL) shift the focus from assessing the absolute probability of a data point to evaluating how consistently a model processes similar inputs or how well it distinguishes between related and unrelated data. MCM, for example, encourages the model to produce similar outputs for perturbed versions of the same input, reinforcing robustness and identifying anomalies as inconsistencies. Similarly, ICL learns representations where related data points are close together in the embedding space, allowing anomalies-those that fall outside established relationships-to be readily detected. By emphasizing these relational aspects, these methods offer a more nuanced approach to anomaly detection, particularly when dealing with complex data distributions where simple likelihood scores can be misleading.
Objective assessment of anomaly detection techniques necessitates rigorous evaluation on standardized benchmarks. Utilizing metrics like the Area Under the Receiver Operating Characteristic curve (AUROC) allows for a comparative analysis, independent of arbitrary threshold settings. Recent work demonstrates the efficacy of this approach, as the Novelty Factor – Scalable Likelihood Training (NF-SLT) model achieves state-of-the-art performance on the ADBench tabular dataset collection. These results, quantified by consistently high AUROC scores, indicate NF-SLT’s superior ability to discriminate between normal and anomalous data instances within complex tabular data distributions, establishing a new benchmark for future research in this area.
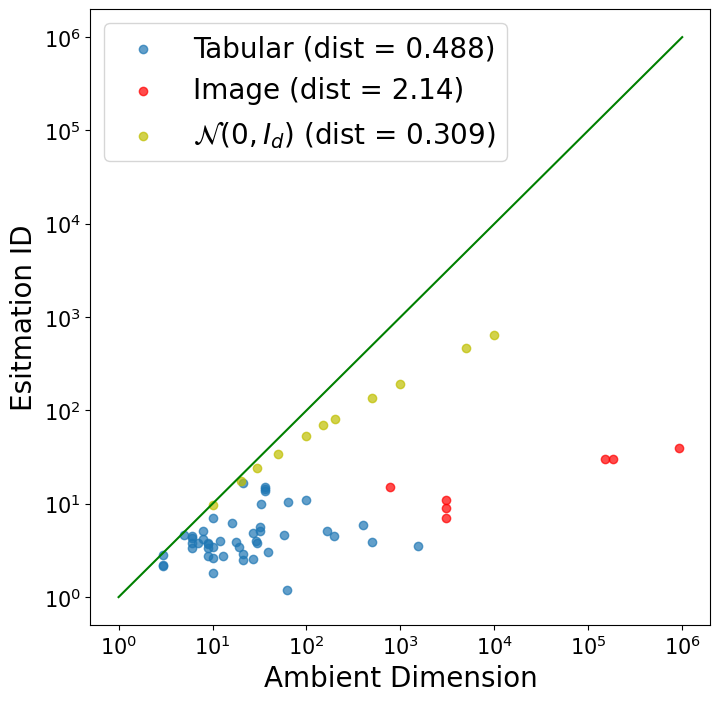
Tabular datasets exhibit a surprisingly low-dimensional structure when compared to image data; the ratio of intrinsic to ambient dimension is approximately 1%, suggesting a markedly less severe ‘curse of dimensionality’. This fundamental difference explains why counterintuitive anomaly detection results – where low-likelihood instances are actually normal data points – are relatively rare in tabular data. Specifically, analysis based on Definition 3.3 reveals a low failure rate, indicating that models are generally better equipped to accurately assess the likelihood of tabular instances. This finding highlights the importance of considering data-specific dimensionality when designing and evaluating anomaly detection algorithms, as approaches optimized for high-dimensional data may not be necessary, or even optimal, for the inherently lower-dimensional structure of tabular datasets.
The study highlights an intriguing disparity between image and tabular data anomaly detection, revealing that likelihood-based tests, often problematic in image analysis, function surprisingly well with tabular data. This aligns with a principle of elegant design: removing unnecessary complexity. As Barbara Liskov once stated, “Programs must be correct and usable. Correctness is when it does what it is supposed to do. Usability is when it is easy to use.” The paper demonstrates that normalizing flows, by effectively capturing feature correlations within tabular data, simplify the anomaly detection process, achieving reliable results without the pitfalls observed in more complex domains. This simplification reflects a pursuit of clarity, a removal of noise, and a step towards a more usable and robust system.
Where Do We Go From Here?
The observation that likelihood, so troublesome in image analysis, presents fewer difficulties with tabular data is not, in itself, a resolution. It is a subtraction. The problem wasn’t solved; it simply relocated. One suspects the ease with which normalizing flows function on structured data stems not from inherent superiority, but from a diminished capacity for the system to require complex solutions. A simpler system, by definition, demands less ingenuity to detect its deviations.
Future work must resist the temptation to celebrate success in a constrained domain. The core question isn’t whether these models perform well on tabular data-they evidently do-but why likelihood-based anomaly detection fails in the first place. The intrinsic dimension, so often invoked, remains a placeholder for a deeper understanding of feature correlation and the manifold’s actual structure. The pursuit should not be more complex models, but models that require less.
A truly elegant solution will not be identified by its ability to detect anomalies, but by its ability to preclude them. A system that needs instructions has already failed. The goal, therefore, is not anomaly detection, but anomaly prevention through a deeper understanding of the underlying generative process. Clarity is courtesy, and a concise explanation is always superior to an elaborate one.
Original article: https://arxiv.org/pdf/2602.09593.pdf
Contact the author: https://www.linkedin.com/in/avetisyan/
See also:
- 2025 Crypto Wallets: Secure, Smart, and Surprisingly Simple!
- Monster Hunter Stories 3: Twisted Reflection launches on March 13, 2026 for PS5, Xbox Series, Switch 2, and PC
- Here Are the Best TV Shows to Stream this Weekend on Paramount+, Including ‘48 Hours’
- 🚨 Kiyosaki’s Doomsday Dance: Bitcoin, Bubbles, and the End of Fake Money? 🚨
- 20 Films Where the Opening Credits Play Over a Single Continuous Shot
- 39th Developer Notes: 2.5th Anniversary Update
- 10 Hulu Originals You’re Missing Out On
- 10 Underrated Films by Ben Mendelsohn You Must See
- Target’s Dividend: A Redemption Amidst Chaos
- First Details of the ‘Avengers: Doomsday’ Teaser Leak Online
2026-02-11 22:28