
The first month of ’26 has brought a peculiar wind to the markets, a rearrangement of fortunes that’s left many a portfolio looking… unsettled. For three years, the grand spectacle was dominated by the tech titans, the ‘Magnificent Seven’ as they were called. Now, a different breed is stirring – the smaller ventures, the value stocks, even the glint of precious metals. It’s a subtle shift, but a shift nonetheless, like the earth settling after a tremor.
Those who’ve spread their bets, diversified as the textbooks preach, will likely find some comfort in this change of pace. But for those who piled everything on the last winning horse, the return is looking…thin. It’s a reminder, isn’t it? The market doesn’t reward unwavering faith, only prudent calculation.
But the real story, the one that whispers of deeper currents, is the Russell 2000. For years, it’s been the overlooked sibling, trailing behind the giants. Now, it’s dared to step forward, to assert itself. A feat, they call it. I call it a consequence. Every empire eventually feels the weight of its own ambition.
Small Caps Stir from Their Slumber
For three years, the S&P 500 has enjoyed a steady climb, fueled by optimism and, let’s be honest, a good deal of speculation. But as the fervor for artificial intelligence cools, as geopolitical shadows lengthen, and the labor market begins to creak, investors are starting to eye the neglected corners of the market. They’re searching for something…solid. Something that won’t vanish with the next fleeting trend.
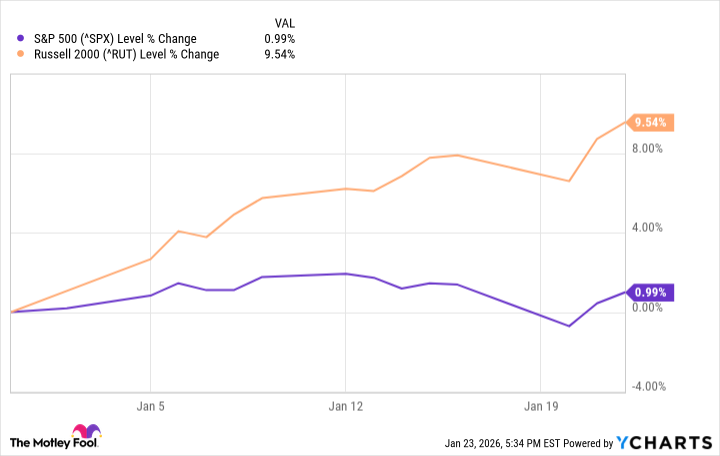
And they’ve found it, at least for now, in the small caps. It’s not a mere ripple, this change. It’s a surge. From January 2nd to the 22nd, the Russell 2000 outperformed the S&P 500 for fourteen consecutive trading days. A rare sight, they say. I say it’s a predictable consequence of excess. The pendulum always swings.
| Date | Russell 2000 Return | S&P 500 Return | Outperformance in Percentage Points |
|---|---|---|---|
| 1/2/2026 | 1.06% | 0.19% | 0.87 |
| 1/5/2026 | 1.58% | 0.64% | 0.94 |
| 1/6/2026 | 1.37% | 0.62% | 0.75 |
| 1/7/2026 | -0.29% | -0.34% | 0.05 |
| 1/8/2026 | 1.11% | 0.01% | 1.10 |
| 1/9/2026 | 0.78% | 0.65% | 0.13 |
| 1/12/2026 | 0.44% | 0.16% | 0.28 |
| 1/13/2026 | -0.10% | -0.19% | 0.10 |
| 1/14/2026 | 0.70% | -0.53% | 1.23 |
| 1/15/2026 | 0.86% | 0.26% | 0.60 |
| 1/16/2026 | 0.12% | -0.06% | 0.18 |
| 1/20/2026 | -1.21% | -2.06% | 0.85 |
| 1/21/2026 | 2.02% | 1.16% | 0.86 |
| 1/22/2026 | 0.74% | 0.55% | 0.19 |
Over the entirety of this brief surge, the small-cap index has outperformed the S&P 500 by roughly 850 basis points. A substantial margin, they claim. I say it’s a temporary reprieve, a brief moment of clarity before the inevitable return to the established order. There’s little historical precedent for such a run, which isn’t surprising. The market rarely repeats itself exactly. It merely offers variations on familiar themes.
Echoes of the Past
Let’s loosen the criteria a bit. What happens when the Russell 2000 outperforms for ten consecutive days? According to the record books, this has occurred eight times in the past forty years:
- February 1991
- April 1996
- June 2000
- December 2001
- April 2002
- June 2003
- June 2008
- January 2026
A pattern emerges, doesn’t it? The years 2000, 2001, 2002, 2008. Half of these instances coincided with periods of significant economic turmoil – the tech bubble bursting, the financial crisis looming. In those years, the small caps weren’t necessarily soaring. They were simply falling less quickly than the giants. A subtle distinction, perhaps, but a crucial one. The working man doesn’t need grand fortunes. He simply needs to avoid utter ruin.
In 1991, we saw a brief recovery following a recession. But the subsequent decline was swift and unforgiving. The small caps had more ground to make up, and they did, once sentiment began to shift. In 1996, the market was relatively stable, and the Russell 2000 simply enjoyed a sustained period of growth. A rare occurrence, indeed.
The Long View
Here’s how the S&P 500 performed in the 200 trading days following each of these ten-day runs:
- February 1991: 15.8%
- April 1996: 20.1%
- June 2000: -22%
- December 2001: -24.5%
- April 2002: -22.1%
- June 2003: 14.9%
- June 2008: -42.3%
- January 2026: ?
A mixed bag, wouldn’t you say? More often than not, these bursts of small-cap outperformance have been followed by periods of market turbulence. The only constant seems to be volatility. Either substantial gains or substantial losses. There’s rarely any middle ground. The market doesn’t offer comfort. It offers risk. And the working man bears the brunt of it.
Everything appears stable for now, but the winds can change quickly. Concerns about valuations and the labor market are growing. Whether these concerns will trigger a recession remains to be seen. But the wise investor prepares for all eventualities. He doesn’t chase fleeting fortunes. He seeks to preserve what he has. And he remembers that the market, like life, is a relentless struggle. A struggle that favors not the bold, but the enduring.
Read More
- Top 20 Dinosaur Movies, Ranked
- 20 Movies Where the Black Villain Was Secretly the Most Popular Character
- Celebs Who Narrowly Escaped The 9/11 Attacks
- 25 “Woke” Films That Used Black Trauma to Humanize White Leads
- The 10 Most Underrated Jim Carrey Movies, Ranked (From Least to Most Underrated)
- Transformers Under the Microscope: What Graph Neural Networks Reveal
- The Best Directors of 2025
- Every Notable ‘Star Trek: The Original Series’ Actor Who Died
- Trading on Thin Air: AI Agents Conquer Crypto Volatility
- 22 Films Where the White Protagonist Is Canonically the Sidekick to a Black Lead
2026-01-29 15:33