Author: Denis Avetisyan
A new framework uses machine learning to automatically identify relationships within complex, evolving datasets without prior knowledge.
This work introduces Latent Structural Similarity Networks to discover relational structures in multivariate time series data using sequence-to-sequence learning and similarity network construction.
Uncovering hidden relationships in complex, multivariate time series data remains a significant challenge due to assumptions of linearity or stationarity often imposed by traditional methods. This paper introduces ‘Latent Structural Similarity Networks for Unsupervised Discovery in Multivariate Time Series’, a novel framework that learns relational hypotheses directly from the data without such constraints. By combining sequence-to-sequence autoencoders with similarity network construction, the approach generates analyzable abstractions that compress the search space for potential relationships. Could this task-agnostic discovery layer offer a powerful new lens for exploratory data analysis across diverse domains, moving beyond prediction towards genuine relational understanding?
The Illusion of Correlation: Why Most Relationships Fail to Propagate
Conventional methods for identifying relationships within datasets frequently falter when applied to the intricacies of multivariate time series. These techniques, often designed for static or simpler data structures, struggle to capture the dynamic interplay between multiple variables evolving over time. Consequently, subtle yet significant correlations – those indicating predictive power or underlying systemic connections – can be easily missed. The challenge lies in disentangling genuine relationships from the inherent noise and complexity, as traditional approaches often rely on assumptions about data distribution or require pre-defined relationships to be explicitly sought. This limitation hinders the discovery of emergent patterns and potentially valuable insights hidden within the data’s temporal dependencies, particularly in fields like finance, climate science, and neuroscience where nuanced interactions are paramount.
The proliferation of data in fields like finance and scientific research presents a unique challenge: discerning meaningful signals from overwhelming noise. Traditional analytical techniques often falter when confronted with the sheer volume of information and the inherent unpredictability of complex systems. Consequently, researchers are increasingly turning to advanced methodologies-including machine learning and topological data analysis-capable of identifying subtle correlations and patterns that would otherwise remain hidden. These sophisticated approaches aren’t simply about processing more data; they focus on extracting robust relationships that persist despite fluctuations and irregularities, ultimately leading to more reliable insights and predictive models. The ability to filter noise and reveal genuine connections is becoming paramount for progress in these data-rich disciplines.
Current techniques for discerning relationships within complex datasets frequently depend on researchers establishing similarity metrics before analysis even begins. This pre-definition proves limiting, as subtle, non-linear patterns or connections that deviate from the anticipated similarities can be easily overlooked. The rigidity of these pre-set metrics struggles to capture the nuanced variations inherent in real-world data, particularly in fields like finance or climate science where relationships aren’t always straightforward or consistently measurable by conventional standards. Consequently, valuable insights may remain hidden, as the analytical tools are constrained by the initial assumptions embedded within the chosen similarity measurement – hindering the discovery of genuinely novel or unexpected correlations.
The Ghost in the Machine: Unveiling Relationships Through Learned Representations
Representation learning for time series data involves applying algorithms to convert raw data points into vector embeddings – numerical representations that capture the inherent temporal dynamics. This transformation is achieved by identifying and encoding key features within the time series, such as trends, seasonality, and cyclical patterns. The resulting embeddings are typically lower-dimensional than the original data, providing a compressed representation while retaining critical information. Unlike traditional feature engineering, representation learning automates the process of feature extraction, enabling the discovery of complex, non-linear relationships that might be missed by manual methods. These vector embeddings facilitate subsequent analysis, allowing for tasks like clustering, classification, and anomaly detection to be performed more effectively on the transformed data.
Sequence-to-Sequence LSTM Autoencoders excel at generating vector embeddings from time series data due to their recurrent architecture and ability to model temporal dependencies. These autoencoders consist of an encoder LSTM which compresses the input sequence into a fixed-length vector, and a decoder LSTM which reconstructs the original sequence from this vector. The training process minimizes the reconstruction error, forcing the network to learn a compressed, latent representation that captures the essential patterns within the data. This compression significantly reduces dimensionality while preserving information relevant to the original time series, facilitating downstream tasks such as relationship discovery and anomaly detection. The LSTM’s gating mechanisms mitigate the vanishing gradient problem, enabling effective learning of long-range dependencies often present in temporal data.
Learned embeddings derived from time series data facilitate relational discovery by transitioning from a raw data space to a feature space where complex patterns are explicitly represented. Traditional relational methods often struggle with the inherent noise and dimensionality of raw time series; embedding techniques reduce dimensionality while retaining salient temporal features. This enriched representation enables the application of diverse algorithms – including clustering, classification, and graph-based methods – with improved accuracy and robustness. Furthermore, the adaptable nature of these embeddings allows for the identification of non-linear relationships and the discovery of connections that would be obscured in the original data space, supporting more flexible and nuanced analyses.
The Topology of Influence: Mapping Relationships with Sparse Similarity Networks
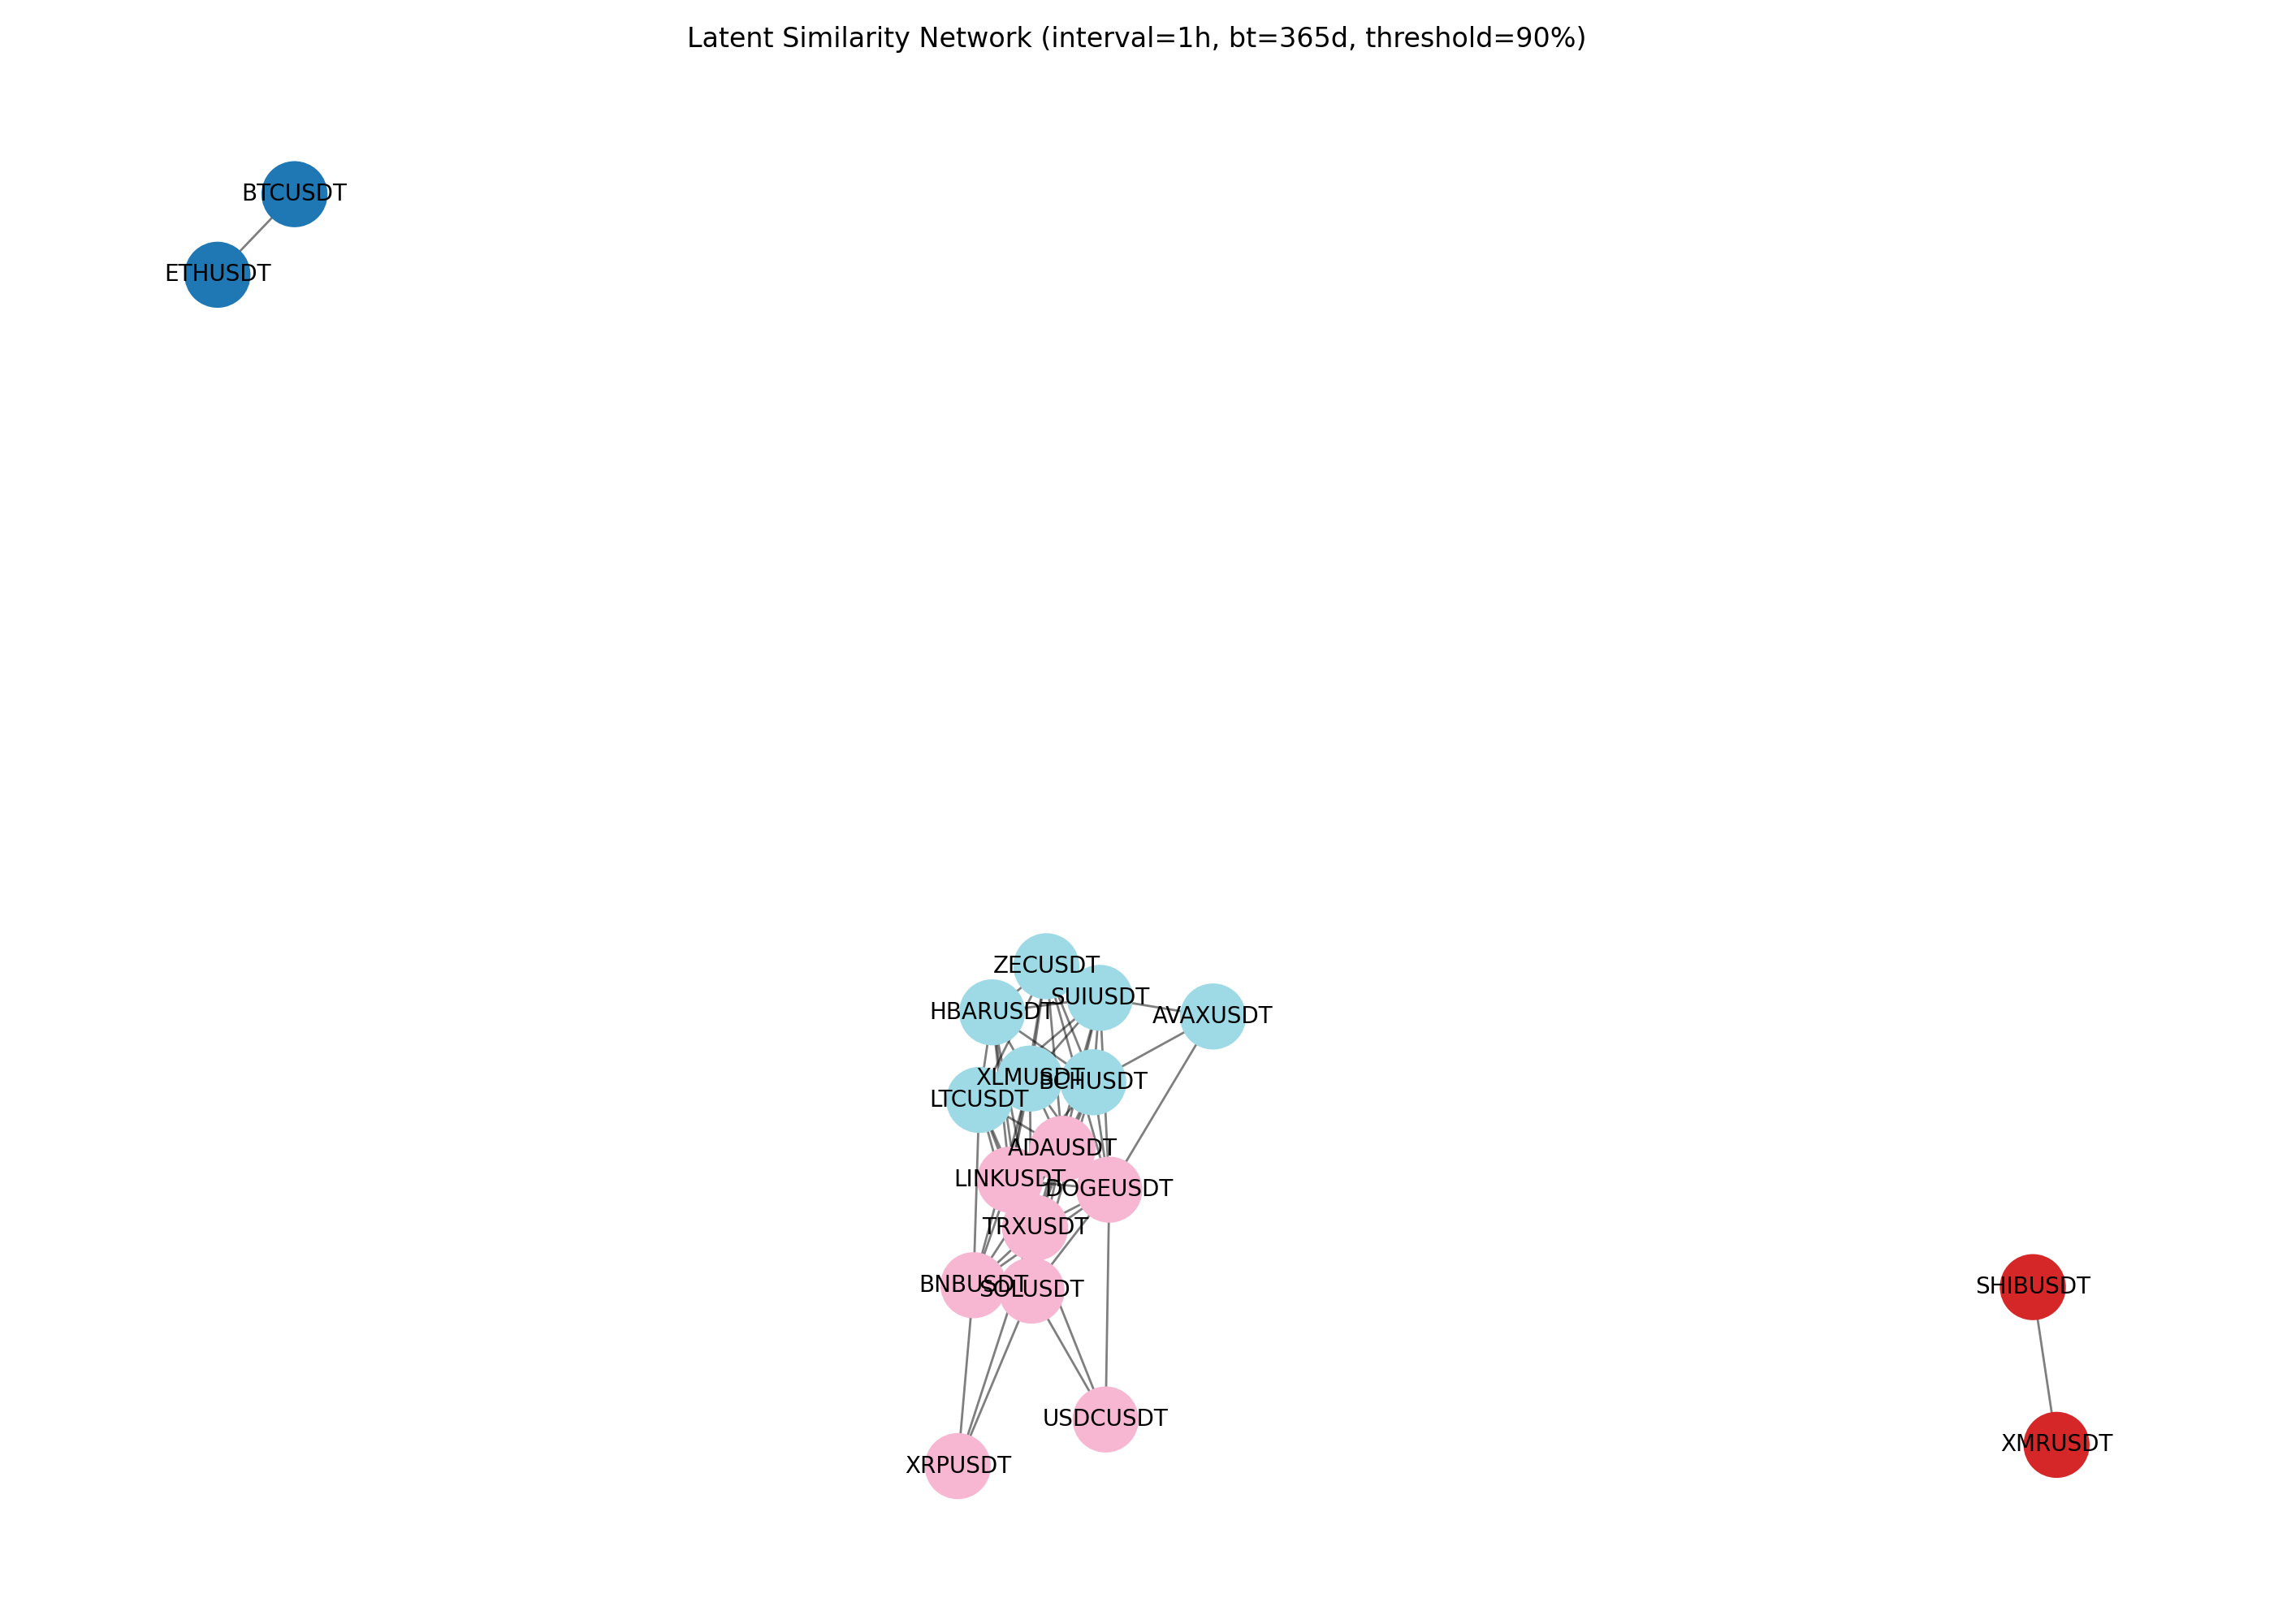
A sparse similarity graph is a data structure used to model relationships between entities, where entities are represented as nodes and connections between them are represented as edges. The ‘sparse’ characteristic refers to a deliberate limitation on the number of edges present in the graph; this is achieved by only including edges that exceed a defined similarity threshold. This enforced sparsity serves two primary functions: it enhances the interpretability of the graph by reducing complexity and facilitating easier analysis of key relationships, and it improves computational efficiency by reducing the storage and processing requirements associated with large, densely connected graphs.
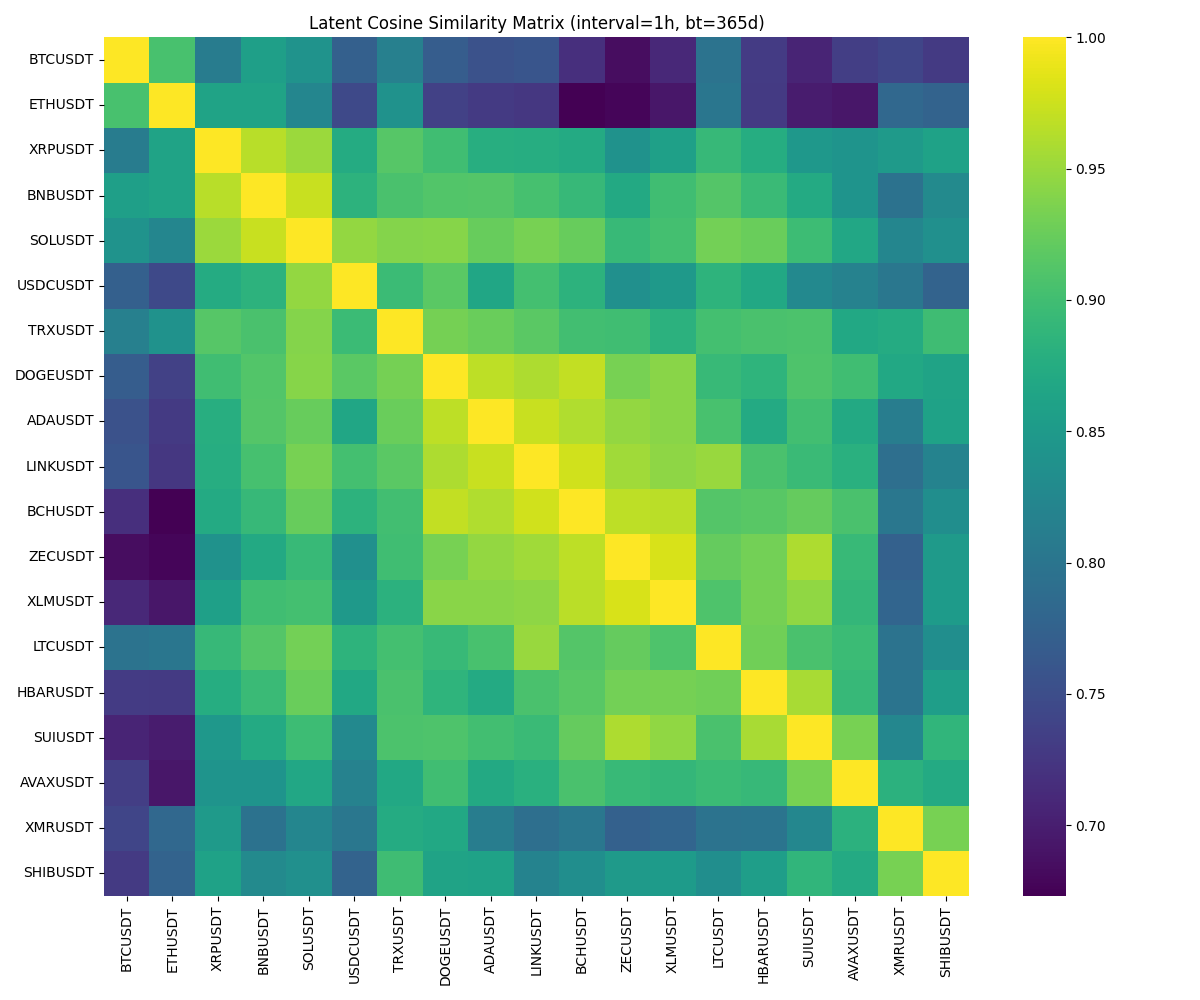
The creation of sparse similarity graphs necessitates a quantifiable assessment of relatedness between sequence embeddings. This process typically involves representing each sequence as a vector in a high-dimensional space, after which a similarity metric is applied to determine the degree of association between pairs of vectors. Cosine similarity is a frequently employed metric, calculating the cosine of the angle between two vectors; a value closer to 1 indicates higher similarity, while a value closer to 0 suggests greater dissimilarity. Other metrics, such as Euclidean distance or dot product, can also be utilized depending on the specific application and characteristics of the embeddings. The resulting similarity scores are then used to establish edges between nodes, with thresholds applied to enforce sparsity and retain only the most significant relationships.
The final sparse similarity network comprised 64 edges, representing significant relationships between entities after applying a stringent selection criterion. This network was generated by evaluating all potential connections and retaining only those exceeding a cosine similarity threshold of 0.90. This fixed threshold served as a quantifiable boundary, ensuring that only highly similar entity pairs were included in the graph, thus prioritizing precision and reducing computational complexity by limiting the number of connections.
The Illusion of Permanence: Validating Relationships Through Temporal Stability and Cointegration
Identifying truly dependable relationships between assets requires more than just correlation at a single point in time; temporal stability serves as a critical validation step. This principle asserts that robust associations should persist across different timeframes, demonstrating consistency beyond mere coincidence. A relationship exhibiting temporal stability isn’t simply a snapshot of shared movement, but a sustained pattern observable when analyzing data over varying windows. This consistency is vital because transient correlations, driven by short-term market fluctuations or external events, can mislead analysts and generate spurious signals. Therefore, assessing how relationships hold up when the analysis window shifts – whether examining daily, weekly, or monthly data – provides a more reliable measure of genuine interconnectedness and predictive power, filtering out noise and highlighting enduring patterns within complex financial systems.
The investigation employed cointegration tests, notably the Engle-Granger methodology, to validate the enduring connections revealed within the sparse similarity graph. This statistical approach determines whether two or more time series – in this case, asset prices – share a long-term, stable relationship despite short-term fluctuations. By assessing the potential for a linear combination of these series to be stationary, the tests identify assets that tend to move together over time, suggesting an underlying economic equilibrium. The confirmation of cointegration signifies that deviations from this equilibrium are temporary, and the assets are likely to revert to a balanced state, offering potential insights for portfolio construction and risk management strategies.
Analysis of the 64 asset pairs identified through sparse similarity modeling revealed a subset of 16 demonstrating statistically significant cointegration at the 95% confidence level. This finding suggests these pairs share a long-term equilibrium relationship, meaning that while their individual price series may fluctuate independently in the short term, they exhibit a tendency to move together over extended periods. The robustness of these cointegrated relationships, confirmed by rigorous statistical testing, offers compelling evidence for the potential of these asset pairs to be exploited in financial strategies like pair trading, where discrepancies from the long-term equilibrium can be leveraged for profit. These results highlight the value of combining network-based approaches with established econometric techniques to uncover enduring connections within complex financial systems.
The pursuit of relational discovery within multivariate time series, as detailed in this work, mirrors a fundamental truth about complex systems. Stability, often sought through rigid modeling, proves a transient state. This research, by embracing the inherent non-stationarity of time series data and focusing on latent structural similarities, acknowledges this fluidity. As Bertrand Russell observed, “The whole problem of philosophy is to account for the fact that anything exists at all.” Similarly, this framework doesn’t impose structure, but rather reveals it – recognizing that relationships emerge and evolve, and a guarantee of fixed order is merely a contract with probability. Chaos isn’t failure; it’s nature’s syntax, and this approach understands that.
What Lies Ahead?
The pursuit of latent relational structures within multivariate time series data inevitably yields a more complex network of dependencies, not less. This work offers a method for discovering these connections, but does not address the inherent fragility they introduce. Each identified relationship is a potential point of systemic failure, a vector for the propagation of non-stationarity. The elegance of unsupervised discovery should not be mistaken for robustness; the system reveals itself, but remains susceptible to the unforeseen.
Future iterations will undoubtedly focus on scaling these networks – incorporating higher dimensionality, greater data volume, and more intricate temporal dynamics. However, increased scale merely amplifies the pre-existing tendency toward correlated failure. The challenge isn’t simply to map the network, but to anticipate its points of collapse. Attempts to impose artificial stability – through regularization or constraint – will likely prove futile; the system will find a way to express its underlying instability, perhaps in less predictable forms.
The real frontier lies not in refining the algorithms of discovery, but in accepting the inevitability of dependency. The task is not to build a perfectly resilient system, but to understand the contours of its eventual decline. One might even propose that the most valuable output of such research is not a predictive model, but a detailed map of where – and how – things will fall apart.
Original article: https://arxiv.org/pdf/2601.18803.pdf
Contact the author: https://www.linkedin.com/in/avetisyan/
See also:
- Top 20 Dinosaur Movies, Ranked
- 20 Movies Where the Black Villain Was Secretly the Most Popular Character
- Celebs Who Narrowly Escaped The 9/11 Attacks
- 25 “Woke” Films That Used Black Trauma to Humanize White Leads
- The 10 Most Underrated Jim Carrey Movies, Ranked (From Least to Most Underrated)
- Transformers Under the Microscope: What Graph Neural Networks Reveal
- The Best Directors of 2025
- Every Notable ‘Star Trek: The Original Series’ Actor Who Died
- 22 Films Where the White Protagonist Is Canonically the Sidekick to a Black Lead
- Trading on Thin Air: AI Agents Conquer Crypto Volatility
2026-01-28 11:47