Solana is at some critical turning point after an extended downtrend. Like, wow, who would’ve guessed? After a sharp sell-off from the November highs (because who doesn’t sell at the top?), SOL has spent weeks consolidating above $118-$120. This area has been “defended” multiple times, which is code for “people keep buying because they think this is the bottom.” Shocker.
SOL Price Structure: Compression Below Key Resistance
On the 4-hour chart, Solana is still stuck below a descending trendline, keeping things bearish. But hey, look at this fancy reversal wedge pattern! It’s like a sandwich with no filling-tightening range, but sellers are still in control. Progress!
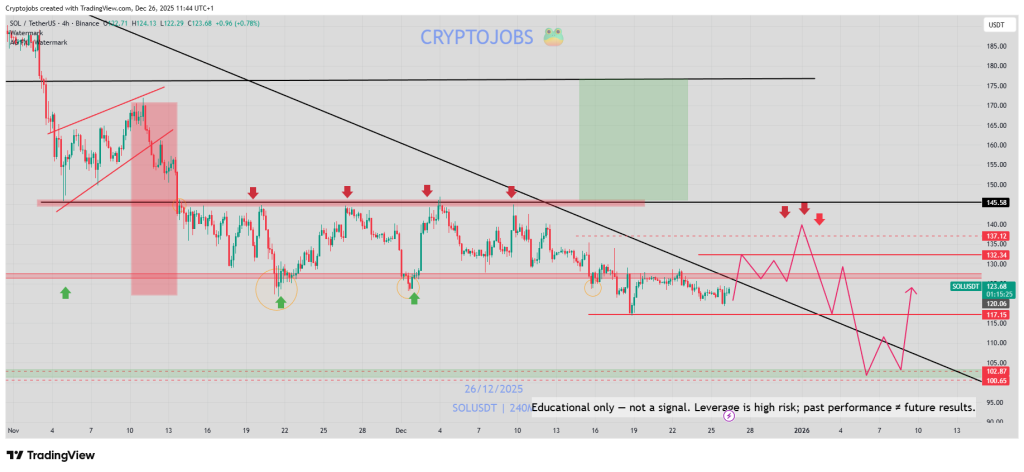
Each dip to $118-$120 gets “responsive buying,” which is just a polite way of saying “desperate people throw money at a wall hoping it sticks.” Not a reversal, but at least the doom isn’t too aggressive. Yet.
Momentum Signals Are Improving, but the Trend Is Not Reversed
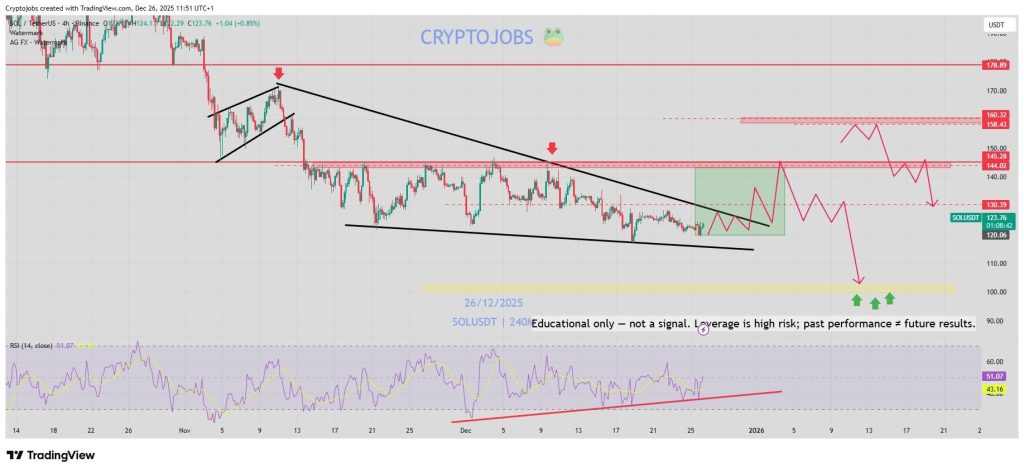
Momentum indicators are diverging. RSI is bullish, but price is still capped. Classic: “I’m fine, really!” while slowly sinking. Daily chart shows a double-bottom-like structure, which is just crypto-speak for “we’re building a base… maybe.” Early signals, not confirmation. Yet another crypto mirage.
Key Levels That Will Decide the Next Move
Traders should focus on these “magic numbers”:
- Major support: $118-$120 (the line between hope and despair)
- Near-term resistance: $132-$136 (a speed bump, not a finish line)
- Heavy supply zone: $145-$158 → $160 (the crypto version of the Bermuda Triangle)
- Invalidation: Sustained break below $118 (aka “game over, man”)
- Bearish continuation target: $105 → $100 (the emotional equivalent of a divorce)
Until SOL cracks $145-$160, sellers are still in charge. Any rally here? Treat it like a buffet line-grab what you can before it disappears.
What Needs to Happen for a Bullish Correction
For a “meaningful correction” (read: temporary relief), Solana needs:
- A break above the descending trendline (like climbing out of a deep, dark hole)
- Sustained trading above $132 with volume expansion (because nothing says “trust me” like volume)
- Momentum holding above RSI midline (the crypto version of “I’m not dead yet”)
No confirmations? Then this is just a lower-high setup in disguise. Don’t get fooled by a pretty chart.
What the Solana Chart Is Signaling Right Now
SOL is showing “conditions for a bounce,” which is code for “this might go up… maybe.” $118-$120 support is the line between a minor setback and a full-blown crypto apocalypse. Hold it, and you get a sliver of hope. Fail it, and you’re buying a house with crypto gains in 2026.
For traders: This is a reaction zone, not a green light. Wait for price to prove it’s not a trap. And for the love of all things holy, don’t short this without a helmet.
Read More
- Gold Rate Forecast
- 2025 Crypto Wallets: Secure, Smart, and Surprisingly Simple!
- HSR 3.7 story ending explained: What happened to the Chrysos Heirs?
- The 10 Most Beautiful Women in the World for 2026, According to the Golden Ratio
- ETH PREDICTION. ETH cryptocurrency
- Here Are the Best TV Shows to Stream this Weekend on Paramount+, Including ‘48 Hours’
- ‘Zootopia 2’ Wins Over Critics with Strong Reviews and High Rotten Tomatoes Score
- The Best Actors Who Have Played Hamlet, Ranked
- The Labyrinth of Leveraged ETFs: A Direxion Dilemma
- Games That Faced Bans in Countries Over Political Themes
2025-12-26 14:55