Ah, the eternal question: can Bitcoin, that most enigmatic of digital cryptids, maintain its momentum as it teeters on the edge of a financial cliff? 🚀💰 (Or is it a financial cliff? Who knows, but it’s definitely a cliff.)
The RSI, that trusty old friend of market analysts, is creeping towards the ‘oversold’ zone (16, for the uninitiated), suggesting that if support levels hold, we might witness a short-term buying frenzy. Or maybe it’s just the universe’s way of saying, ‘Not today, Satan.’ 🕵️♂️
Key Technical Levels Under the Spotlight
Analysts highlight several critical thresholds for Bitcoin’s short-term price action. Crypto strategist Heisenberg, known for macro-trend analysis on TradingView, commented:
“BTC bulls may need to break above $93K to sustain upward momentum. Support around $86K is important, and defending $80K could prevent a deeper correction scenario.”

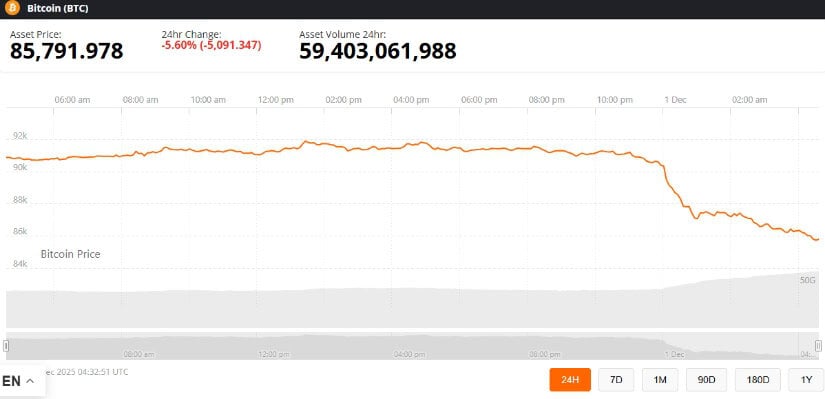
The $93K level coincides with a descending trendline on the daily chart, which has recently acted as resistance, according to chart data from TradingView. Short-term support near $86K is considered significant by many traders, while failure to hold this level could increase the risk of a correction toward the $80K zone. Historical price data from BraveNewCoin shows BTC experienced a 5% year-to-date decline by late November, despite hitting all-time highs in October.
Mixed Signals in the Market
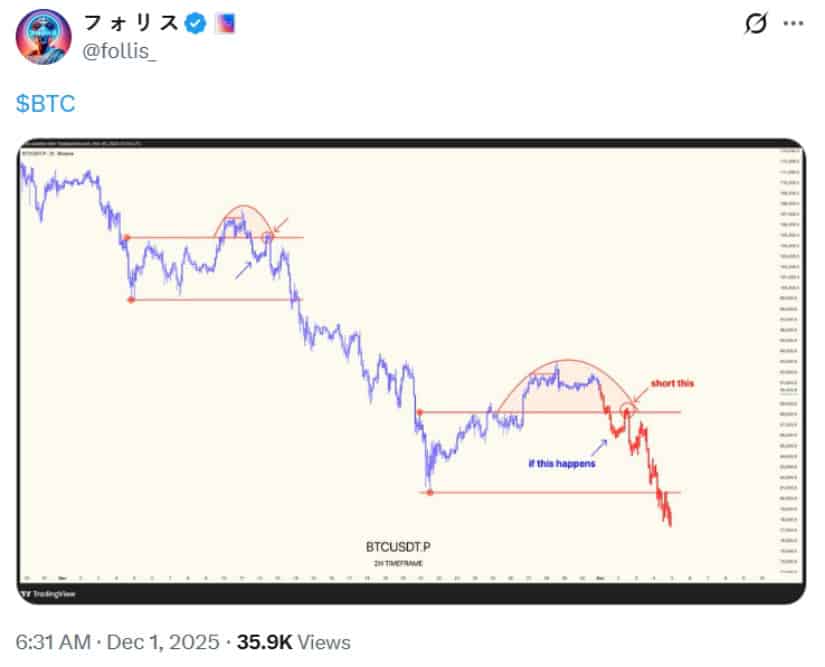
Market data indicate continued volatility amid weak ETF inflows. According to major ETF monitoring platforms, inflows have remained modest, contributing to uncertainty. Trader @follis, who frequently shares intraday setups on X, observed that BTC recently moved from $90,379 down to $87,044 within a session:
“If Bitcoin fails to maintain key support levels, downside targets below $85K may become more likely,” the trader noted.
This mixed technical picture reflects broader market sentiment following a challenging November. Analysts expect BTC could continue to experience sideways or volatile movements within the $80K-$92.5K range in early December.
Bullish Outlook Still in Play
Despite short-term pressures, some observers maintain a cautiously bullish perspective. A technical analyst monitoring Bitcoin’s Ichimoku cloud structure explained:
“As long as BTC remains above the green trendline and the weekly Ichimoku cloud-a tool often used to identify long-term support-upward momentum could remain intact. Breaking below these areas may indicate a potential shift in trend.”
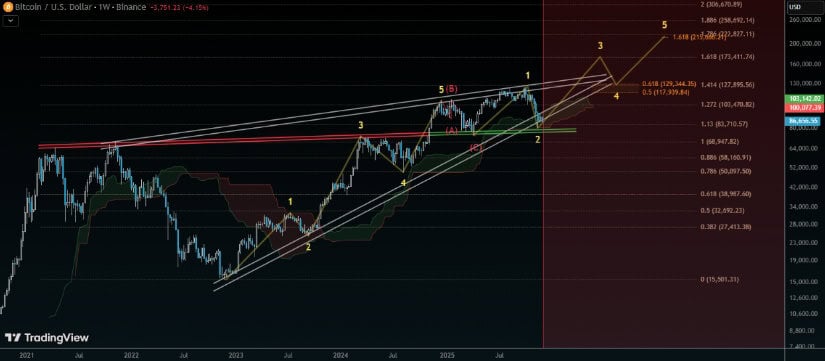
Chart data from TradingView supports this view, showing that BTC has repeatedly bounced off these support zones in prior weeks.
Short-Term Resistance Challenges
Bitcoin faces resistance near the descending trendline, with price action suggesting sellers may be dominating near higher levels. Breaking above $93K could signal bullish continuation, depending on market conditions, while failure to sustain support at $86K might accelerate downward pressure.
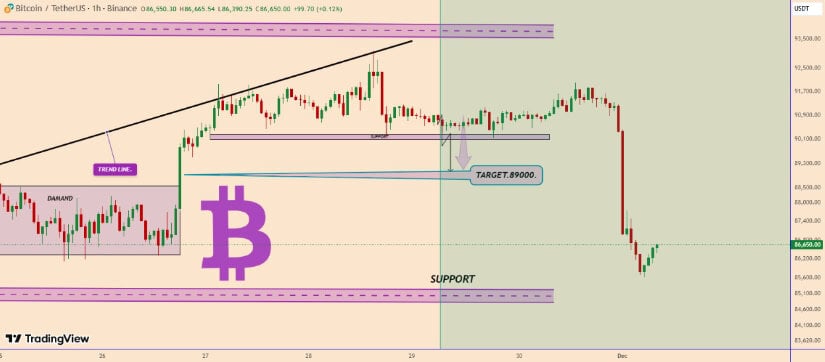
Analysts are also watching potential rebound zones around $89K, noting that consolidation and minor pullbacks could define BTC’s trajectory in the short term.
Final Thoughts
Bitcoin is at a critical juncture. While bullish sentiment persists, BTC must overcome resistance near $93K and maintain support around $86K to sustain momentum. Failure to defend these levels could result in a correction toward $80K or lower.
Investors and traders are advised to monitor technical indicators and support/resistance levels closely, as these metrics provide insight into short-term price behavior. The next few weeks may prove decisive for BTC as it heads into 2026.
Read More
- Invincible Season 4 Gender Swaps Tech Jacket As Fans Question Major Comic Change
- Silver Rate Forecast
- Gold Rate Forecast
- 15 Films That Were Shot Entirely on Phones
- Building Agents That Learn and Improve Themselves
- 22 Films Where the White Protagonist Is Canonically the Sidekick to a Black Lead
- 20 Movies Where the Black Villain Was Secretly the Most Popular Character
- Celebs Who Narrowly Escaped The 9/11 Attacks
- 18 TV Series Filming Rehearsals as Bonus Content
- Trading Crypto with AI: A New Approach to Portfolio Management
2025-12-01 23:23