Author: Denis Avetisyan
A novel framework dynamically filters out bad data to improve the accuracy of anomaly detection systems, even when training datasets are heavily contaminated.

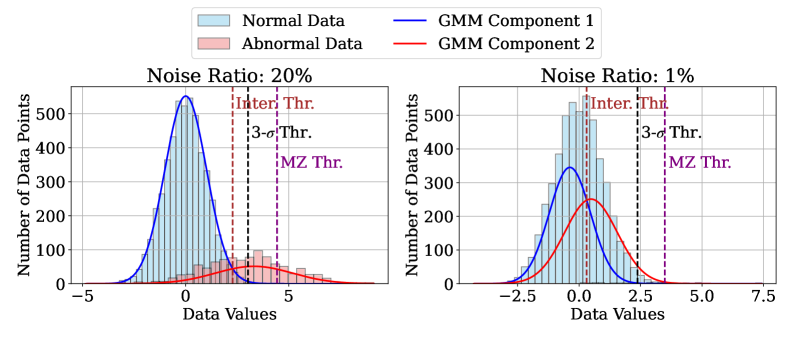
Adaptive and Aggressive Rejection combines modified z-score thresholding with Gaussian Mixture Models to enhance robustness against outliers in contaminated training data.
Despite the increasing sophistication of anomaly detection techniques, performance critically degrades when training data is compromised by outliers-a common challenge in real-world applications. This paper introduces ‘Anomaly Detection with Adaptive and Aggressive Rejection for Contaminated Training Data’, presenting a novel framework that dynamically identifies and excludes anomalous instances using a modified z-score and Gaussian mixture model-based thresholds. Experimental results on diverse datasets demonstrate that this Adaptive and Aggressive Rejection (AAR) method significantly outperforms existing state-of-the-art approaches. Could this dynamic rejection strategy unlock more robust and reliable anomaly detection across critical domains like fraud prevention and medical diagnostics?
The Inevitable Divergence: Identifying the Exceptional
At the heart of numerous analytical endeavors lies the critical task of anomaly detection – the pinpointing of data instances that markedly diverge from established patterns. This process isn’t simply about finding outliers; it’s a fundamental step in fields ranging from fraud prevention and network security to medical diagnosis and scientific discovery. Identifying these deviations requires a robust understanding of what constitutes ‘normal’ behavior, often achieved through statistical modeling, machine learning algorithms, or domain expertise. The significance of this lies in the fact that anomalies frequently signal critical events – a failing component, a malicious intrusion, or a previously unknown phenomenon – making their timely detection paramount. Effectively isolating these unusual data points allows for proactive intervention, informed decision-making, and a deeper understanding of the underlying processes at play.
The practical challenge of anomaly detection isn’t simply finding what’s different, but discerning genuine outliers from the pervasive noise of ‘contaminated data’. Most real-world datasets aren’t neatly separated; instead, they represent a complex mixture of normal instances, true anomalies, and data points that appear anomalous due to errors, irrelevant features, or natural variations within the normal population. This blending creates a significant hurdle for algorithms, as distinguishing between legitimate signals and spurious deviations requires sophisticated techniques capable of modeling the underlying data distribution and accounting for the inherent uncertainty. Consequently, a successful anomaly detection system must be robust to noise, adaptable to complex data structures, and capable of avoiding false positives – incorrectly flagging normal instances as anomalous – which can undermine its overall effectiveness and reliability.
Quantifying the Unexpected: Scoring Deviation
The Anomaly Score serves as a quantitative assessment of how significantly a data point diverges from established norms within a dataset. This score is not a binary classification of ‘normal’ or ‘anomalous’ but rather a continuous value, allowing for the ranking of observations based on their unusualness. Higher anomaly scores indicate greater deviation from expected behavior, while lower scores suggest conformity to the typical data profile. The specific scale and interpretation of the anomaly score are dependent on the method used for its calculation, but the fundamental principle remains consistent: a numerical representation of the degree of deviation. This allows for threshold-based identification of anomalies, where data points exceeding a predetermined score are flagged as potentially anomalous.
Kernel Density Estimation (KDE) is a non-parametric technique used to estimate the probability density function of a random variable. Unlike parametric methods that assume a specific distribution, KDE utilizes historical data to construct a smooth probability density estimate. This is achieved by placing a kernel – a symmetric probability density function, such as a Gaussian – on each data point and summing these kernels to form the overall density estimate. The bandwidth of the kernel is a critical parameter; smaller bandwidths yield more localized, potentially overfit estimates, while larger bandwidths produce smoother, more generalized estimates. Consequently, anomaly scores derived from KDE are typically inversely proportional to the estimated probability density; data points residing in low-density regions are assigned higher anomaly scores, indicating greater deviation from the expected data distribution.
Autoencoder (AE) architectures are a core component of many anomaly detection systems due to their ability to learn efficient data representations. These neural networks are trained to reconstruct their input; during training, the AE learns a compressed, lower-dimensional ‘latent space’ representation of the normal data. Anomaly detection leverages the principle that instances significantly deviating from the learned normal patterns will result in a higher ‘Reconstruction Error’ – the difference between the input and the reconstructed output. This error, typically measured using metrics like Mean Squared Error (MSE), serves as the anomaly score; higher scores indicate a greater deviation from the learned distribution and, therefore, a higher probability of being anomalous. The effectiveness of this approach relies on the AE’s ability to accurately capture the nuances of normal data, minimizing reconstruction error for typical instances while maximizing it for outliers.

Fortifying the System: Robustness and Refinement
Anomaly detection systems are susceptible to performance degradation when trained or evaluated on datasets containing contaminated data, such as incorrectly labeled instances or data points resulting from sensor errors. Robust methods are therefore crucial for ensuring reliable anomaly scores and accurate identification of true anomalies. These methods aim to minimize the influence of outliers and noisy data during model training and inference, preventing skewed parameter estimates or biased decision boundaries. Techniques such as robust loss functions, outlier removal strategies, and data weighting schemes are commonly employed to enhance the resilience of anomaly detection algorithms to data contamination, ultimately improving their generalization capability and practical applicability.
Pseudo-Huber loss functions offer a compromise between $L_1$ and $L_2$ loss, providing robustness to outliers during model training. Unlike $L_2$ loss, which squares errors and is highly sensitive to large residuals, and $L_1$ loss which uses absolute error and can lead to unstable gradients, the Pseudo-Huber loss uses a parameter, $\delta$, to define a threshold. Errors smaller than $\delta$ are treated with a quadratic loss, while larger errors are treated with a linear loss. This behavior reduces the influence of outliers on the model parameters, resulting in more stable anomaly scores and improved generalization performance when applied to datasets containing anomalous or contaminated data points. The function is defined as $L(x) = \begin{cases} \frac{1}{2}x^2 & \text{if } |x| \leq \delta \\ \delta(|x| – \frac{1}{2}\delta) & \text{if } |x| > \delta \end{cases}$.
Accurate estimation of the contamination ratio – defined as the proportion of anomalous instances within a dataset – is critical for effective anomaly detection. This ratio directly influences the selection of appropriate detection thresholds; a misestimated ratio can lead to either a high false positive rate (if the ratio is overestimated) or a high false negative rate (if underestimated). Many anomaly detection algorithms, particularly those based on statistical modeling or machine learning, rely on assumptions about the underlying data distribution, and the contamination ratio serves as a key parameter in these models. Consequently, techniques for contamination ratio estimation, such as those based on robust statistical methods or iterative algorithms, are essential components of a reliable anomaly detection pipeline. Incorrect threshold settings stemming from inaccurate contamination ratio estimates can significantly degrade the performance of anomaly detection systems in real-world applications.
The Adaptive and Aggressive Rejection (AAR) framework demonstrably improves anomaly detection performance, achieving an average Area Under the Receiver Operating Characteristic curve (AUROC) improvement of 0.041 when tested across multiple datasets. This improvement is facilitated by a dynamic adjustment of rejection policies, allowing the system to adapt to varying data characteristics. AAR combines both ‘hard’ rejection – completely discarding instances deemed unreliable – and ‘soft’ rejection, which modulates anomaly scores based on confidence levels. This combined approach allows for a more nuanced and effective filtering of potentially contaminating data points, ultimately leading to more accurate anomaly detection.
Beyond the Signal: Expanding the Anomaly Landscape
Anomaly detection transcends the mere pinpointing of unusual data points; it represents a core principle underpinning solutions across diverse fields. From safeguarding financial transactions through the identification of fraudulent activity, to optimizing industrial processes via predictive maintenance – anticipating equipment failures before they occur – the ability to discern deviations from expected patterns is paramount. This extends to network security, where anomalous traffic can signal cyberattacks, and even medical diagnostics, where unusual biomarkers might indicate disease. Effectively, anomaly detection provides a proactive capability, shifting focus from reactive responses to preventative measures, and enabling organizations to mitigate risks and enhance operational efficiency by understanding and addressing the unexpected. It is not about finding the anomaly, but understanding the system’s inherent fragility and anticipating its inevitable failures.
One-Class Support Vector Machines (OC-SVMs) represent a potent approach to anomaly detection by focusing on establishing the parameters of typical data behavior. Unlike many algorithms that require labeled anomalous examples – which are often scarce – OC-SVMs learn a decision boundary that encapsulates the majority of the dataset, effectively creating a profile of ‘normality’. This is achieved by mapping data points into a higher-dimensional space and identifying a hyperplane that separates the data from the origin, maximizing the margin between the hyperplane and the normal instances. Consequently, any data point falling significantly outside this learned boundary is flagged as an anomaly, making OC-SVMs particularly effective in scenarios where anomalous data is rare or poorly defined, and allowing for robust identification of deviations in complex, high-dimensional datasets.
Recent evaluations of anomaly detection frameworks on tabular datasets demonstrate a significant performance advantage for the AAR (Adversarial Autoencoder with Reconstruction) approach. Specifically, the AAR framework achieves an Area Under the Receiver Operating Characteristic curve (AUROC) score that is 0.34 higher than traditional Autoencoders (AE), 0.28 higher than Memory-based Autoencoders (MemAE), and 0.32 higher than Deep SVDD. This substantial improvement in AUROC indicates a markedly enhanced ability to accurately distinguish between normal and anomalous instances within the data, suggesting that AAR provides a more robust and reliable method for identifying deviations in tabular data compared to these established techniques. The consistent outperformance highlights the potential of AAR for applications demanding high precision in anomaly detection, such as fraud prevention or system health monitoring.
The practical value of advanced anomaly detection techniques extends far beyond simply flagging unusual data points. A robust comprehension of these methods facilitates proactive data quality enhancement by pinpointing systematic errors or inconsistencies often overlooked in standard data cleaning processes. This, in turn, yields more reliable analytical insights, allowing for the identification of genuine patterns and trends obscured by noisy or inaccurate information. Consequently, organizations equipped with this deeper understanding are empowered to make data-driven decisions with greater confidence, optimizing processes, mitigating risks, and ultimately achieving superior outcomes across a diverse range of applications, from financial forecasting to industrial quality control. This isn’t about preventing failure; it’s about understanding how the system will fail, and building resilience into the inevitable cascade.
The pursuit of pristine datasets, as this paper demonstrates with its Adaptive and Aggressive Rejection (AAR) framework, feels increasingly like a fool’s errand. The system doesn’t eliminate contamination; it adapts to it, recognizing that real-world data is rarely, if ever, neatly categorized. As Claude Shannon observed, “The most important thing is to have a way of measuring information.” AAR provides precisely that – a dynamic metric for assessing data integrity and, crucially, a willingness to discard what doesn’t fit, not as failure, but as a necessary component of a robust system. Stability, in this context, is merely an illusion that caches well, while the true power lies in acknowledging and accommodating the inevitable chaos.
What Lies Ahead?
The pursuit of robustness against tainted data, as exemplified by this work, reveals a fundamental truth: anomaly detection isn’t about identifying the unusual, but about anticipating failure. Each refinement of rejection thresholds, each Gaussian mixture sculpted to exclude the aberrant, merely delays the inevitable drift towards misclassification. The contamination ratio, a convenient parameter, obscures a more unsettling reality: data isn’t static, and ‘normal’ is a moving target. The framework presented here, while an advance, is a local maximum in a vast, unforgiving landscape.
Future explorations will inevitably confront the limitations of purely statistical approaches. The assumption of Gaussianity, however carefully relaxed, remains a simplifying fiction. More compelling solutions will likely emerge from systems that learn the process of contamination – that model not just what is anomalous, but how anomalies are introduced. This necessitates a shift from passive rejection to active intervention, perhaps through adversarial training or the construction of self-healing datasets.
Ultimately, the true challenge isn’t building more sophisticated detectors, but accepting the inherent fragility of all models. Architecture isn’t structure – it’s a compromise frozen in time. Technologies change, dependencies remain. The field will progress not by seeking perfect isolation from ‘bad’ data, but by embracing the inevitability of its presence, and designing systems capable of graceful degradation.
Original article: https://arxiv.org/pdf/2511.21378.pdf
Contact the author: https://www.linkedin.com/in/avetisyan/
See also:
- Gold Rate Forecast
- Invincible Season 4 Gender Swaps Tech Jacket As Fans Question Major Comic Change
- 22 Films Where the White Protagonist Is Canonically the Sidekick to a Black Lead
- Unveiling the Schwab U.S. Dividend Equity ETF: A Portent of Financial Growth
- The Best Former NFL Players Turned Actors, Ranked
- Why Won’t It Just *Do* What You Ask? Unpacking the Quirks of AI Language
- Silver Rate Forecast
- Superman Flops Financially: $350M Budget, Still No Profit (Scoop Confirmed)
- 14 Movies Where the Black Character Refuses to Save the White Protagonist
- ONE PIECE Season 2 Confirms Sanji’s OTHER Backstory in the Live-Action
2025-11-28 17:52