Well, hello there, Bitcoin enthusiasts! Seems like our favorite digital currency is trying to decide whether it wants to break out or break down-like that awkward moment when you can’t decide between sushi and pizza for dinner. 😅
Bitcoin
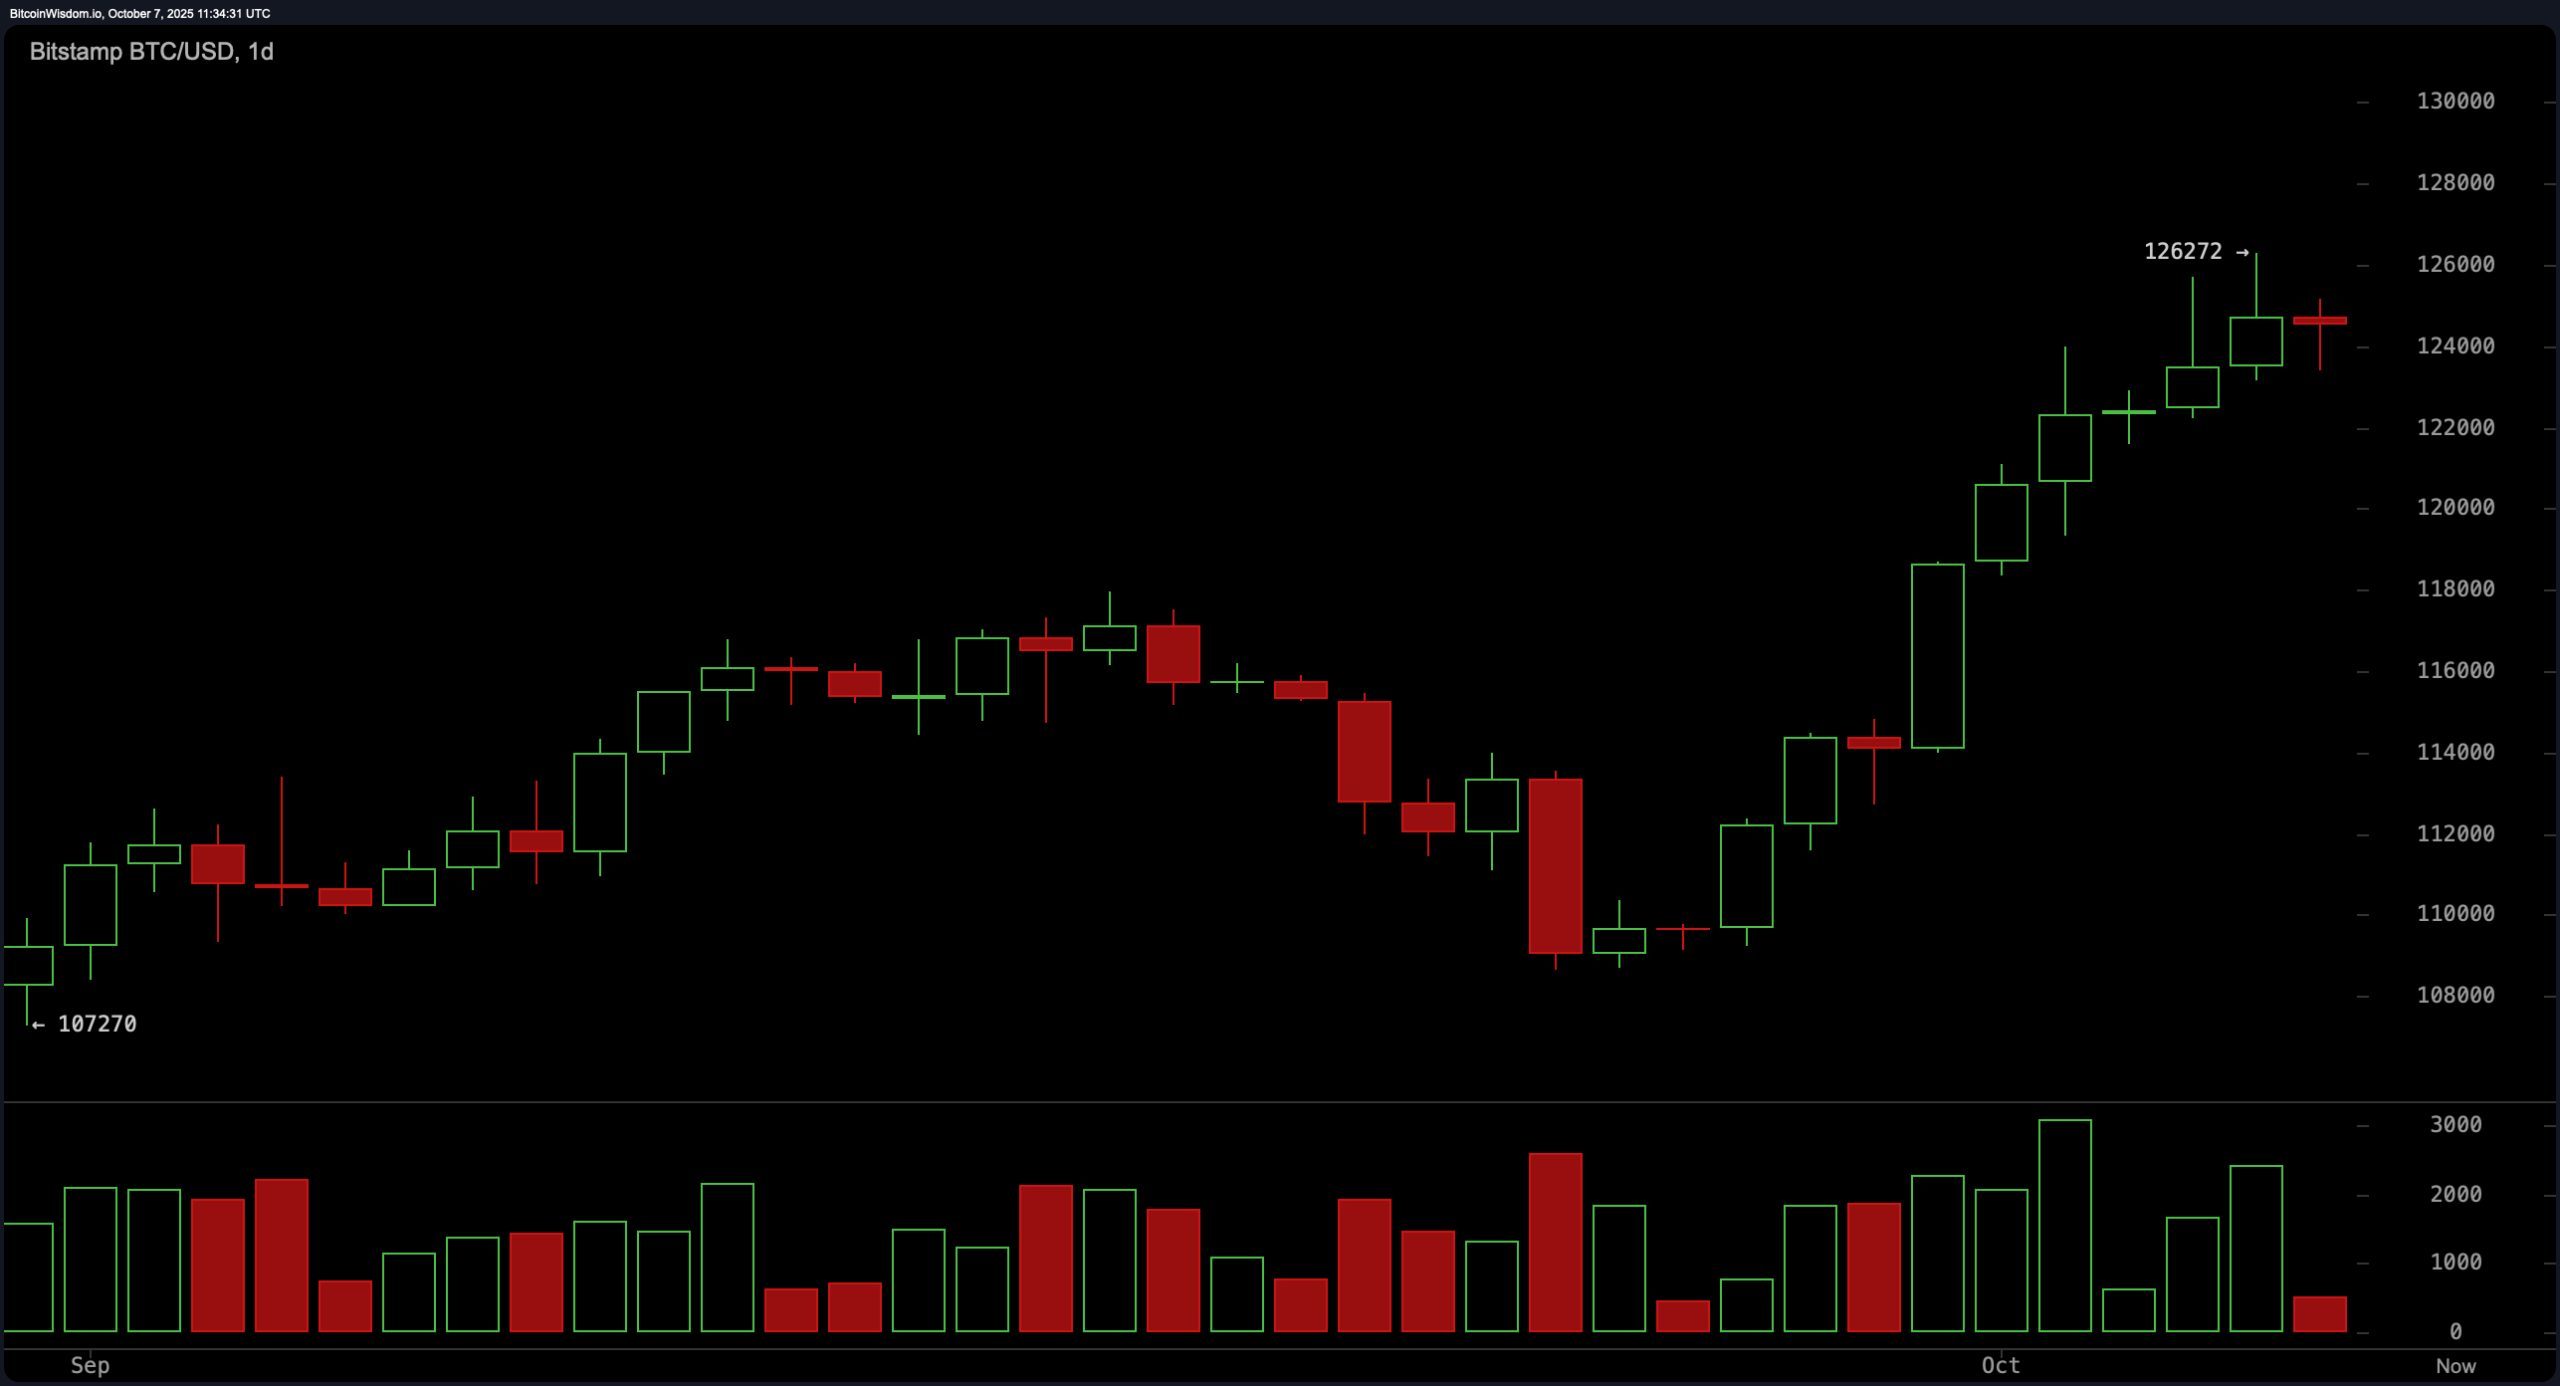
On the daily chart, Bitcoin is still basking in the glow of its recent $126,000 celebration, but it’s now taking a breather like a runner who just crossed the finish line. The trend is still bullish, but the candles are starting to look like they’re in a mid-life crisis-indecisive, and a little unsure of themselves.
Support’s chilling around $124,000, and if the price retraces to the $122,000-$123,000 range, that could be the moment when the bulls start showing up like a party with free drinks. But watch out, resistance is still lurking at $126,000-$127,000, like that one person who shows up to your party and doesn’t know when to leave. Without something big to push it further, Bitcoin might be stuck playing the waiting game for now.
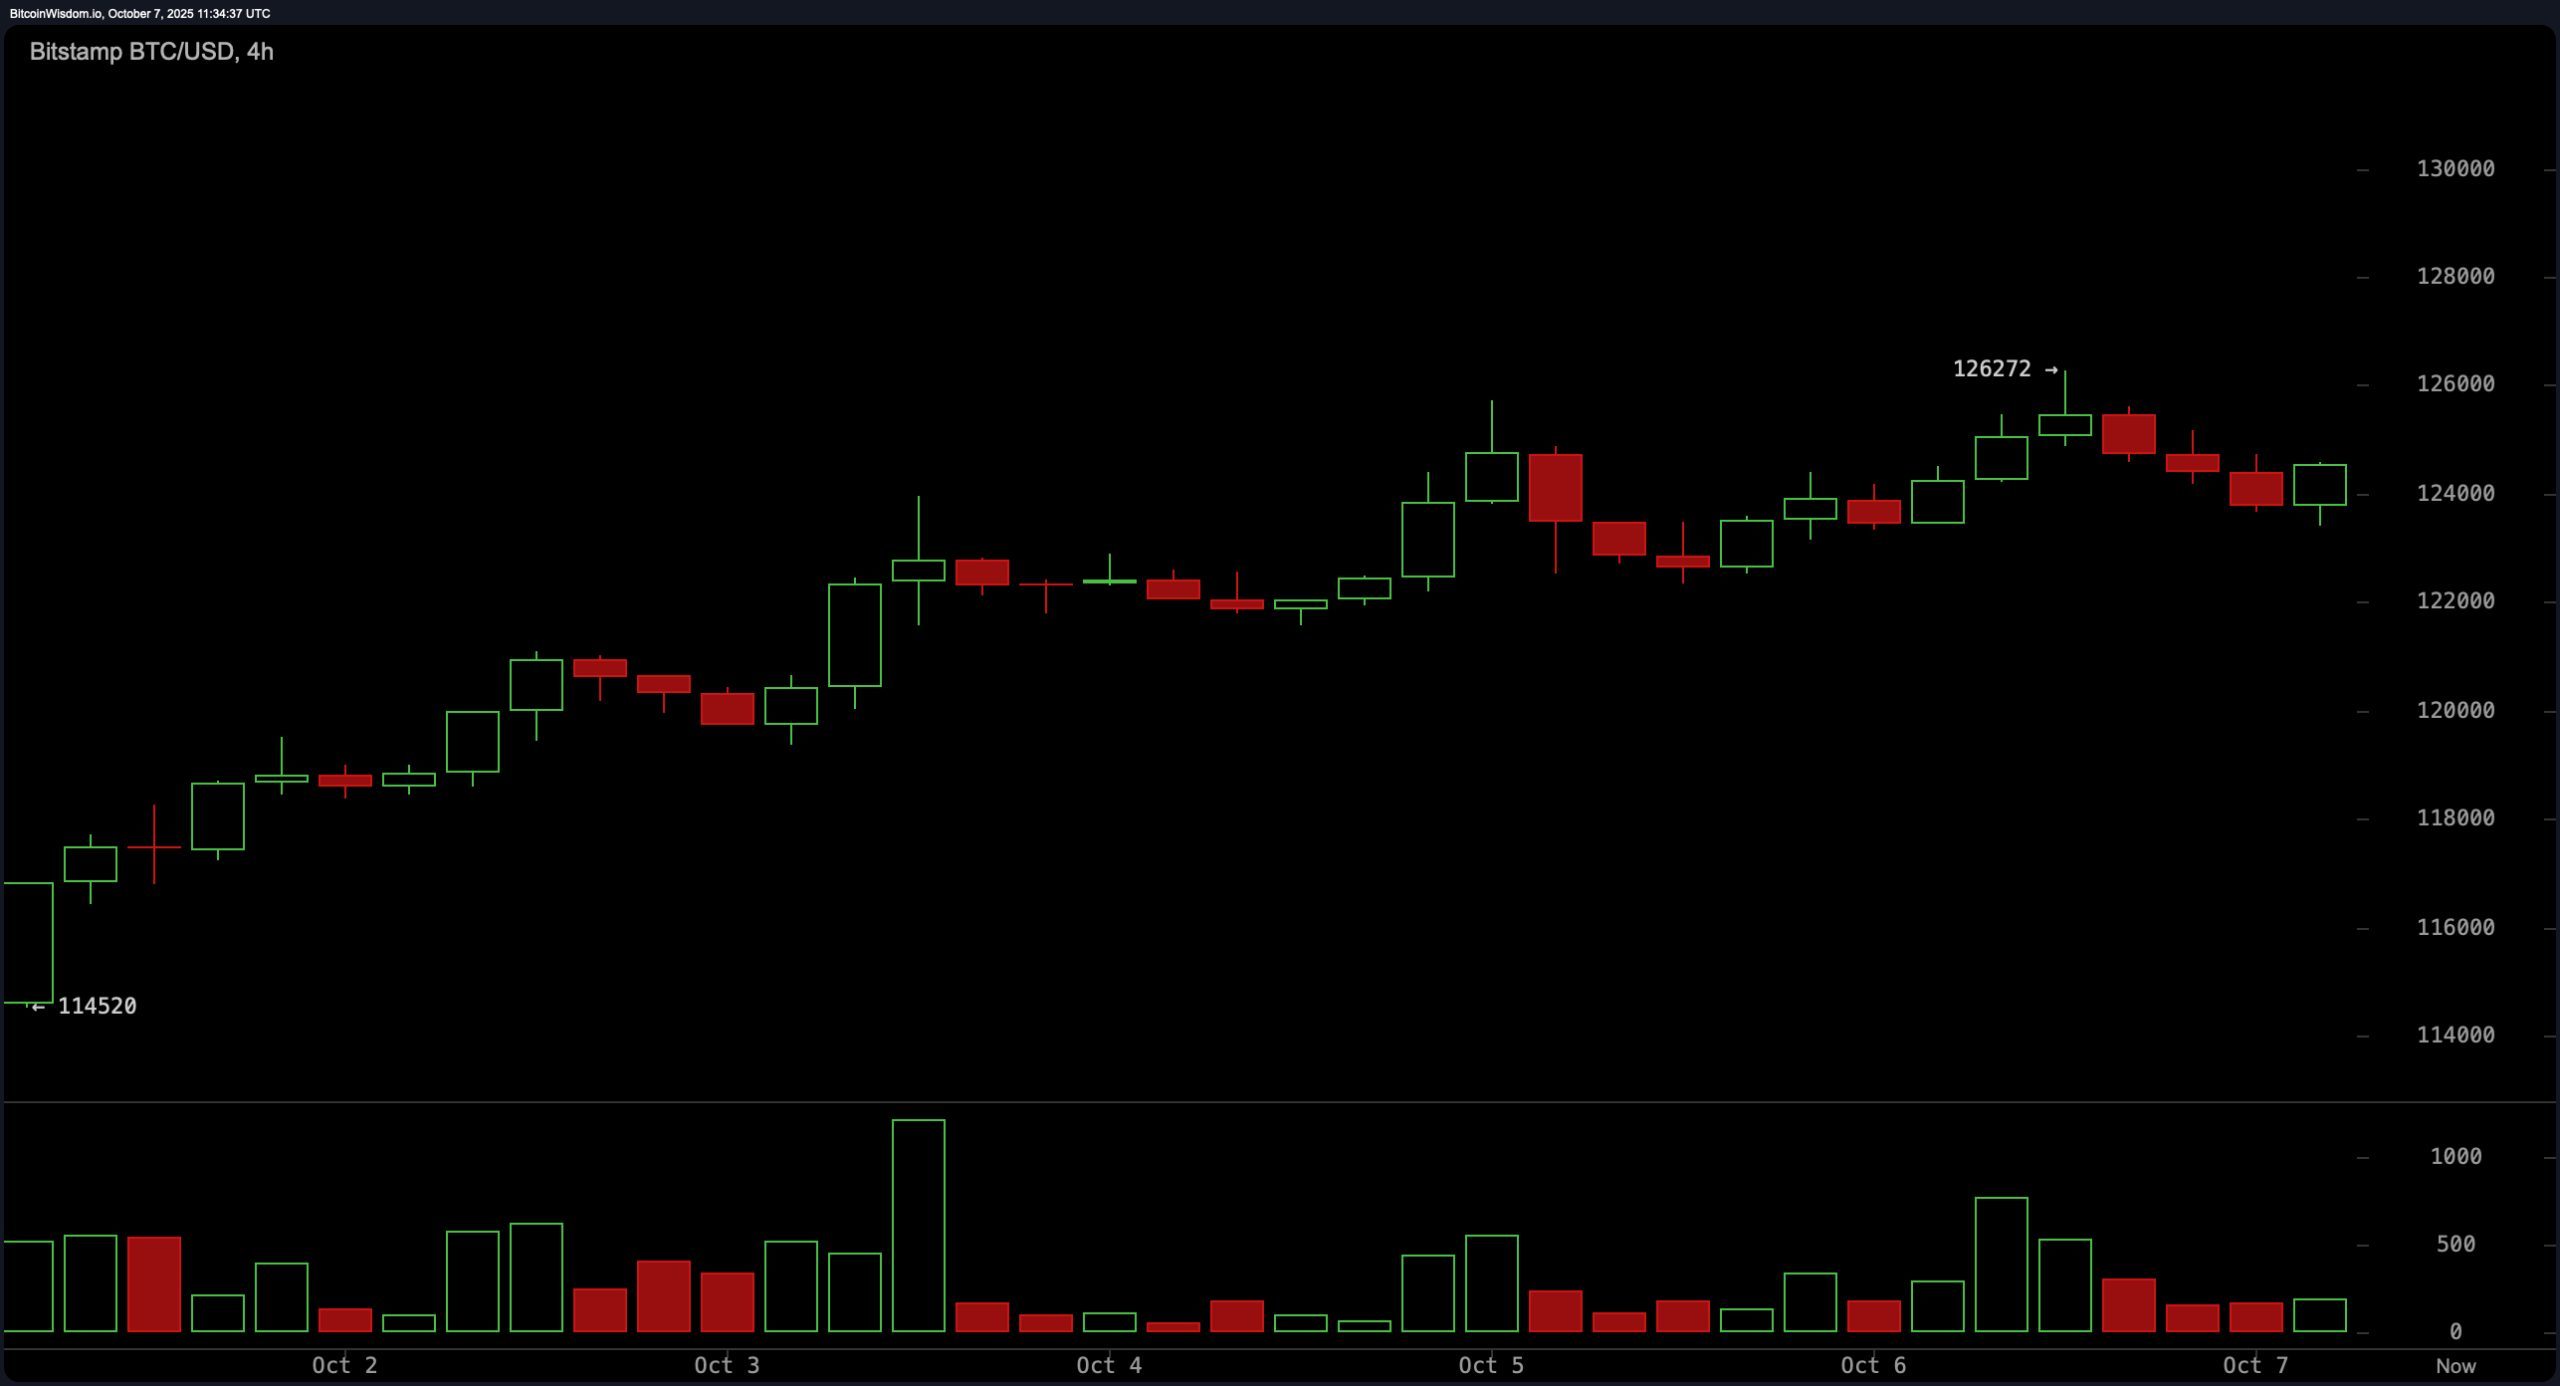
Now, on the 4-hour chart, things are getting a little spicy. We’re seeing a rising wedge breakdown, like a bad date that you just know isn’t going anywhere. After peaking at $126,272, Bitcoin’s been doing this awkward dance of lower highs and lower lows-volume’s weak, and the market is kinda like, “I’m not sure what to do with my life.”
If Bitcoin dips below $124,000 with some decent volume, it could roll downhill to $122,500. But, if it manages to pull itself together and goes above $125,500, then it’s game on for the bulls again. We’re in classic breakdown territory here, so don’t blink-this could turn into a rollercoaster ride real fast. 🎢
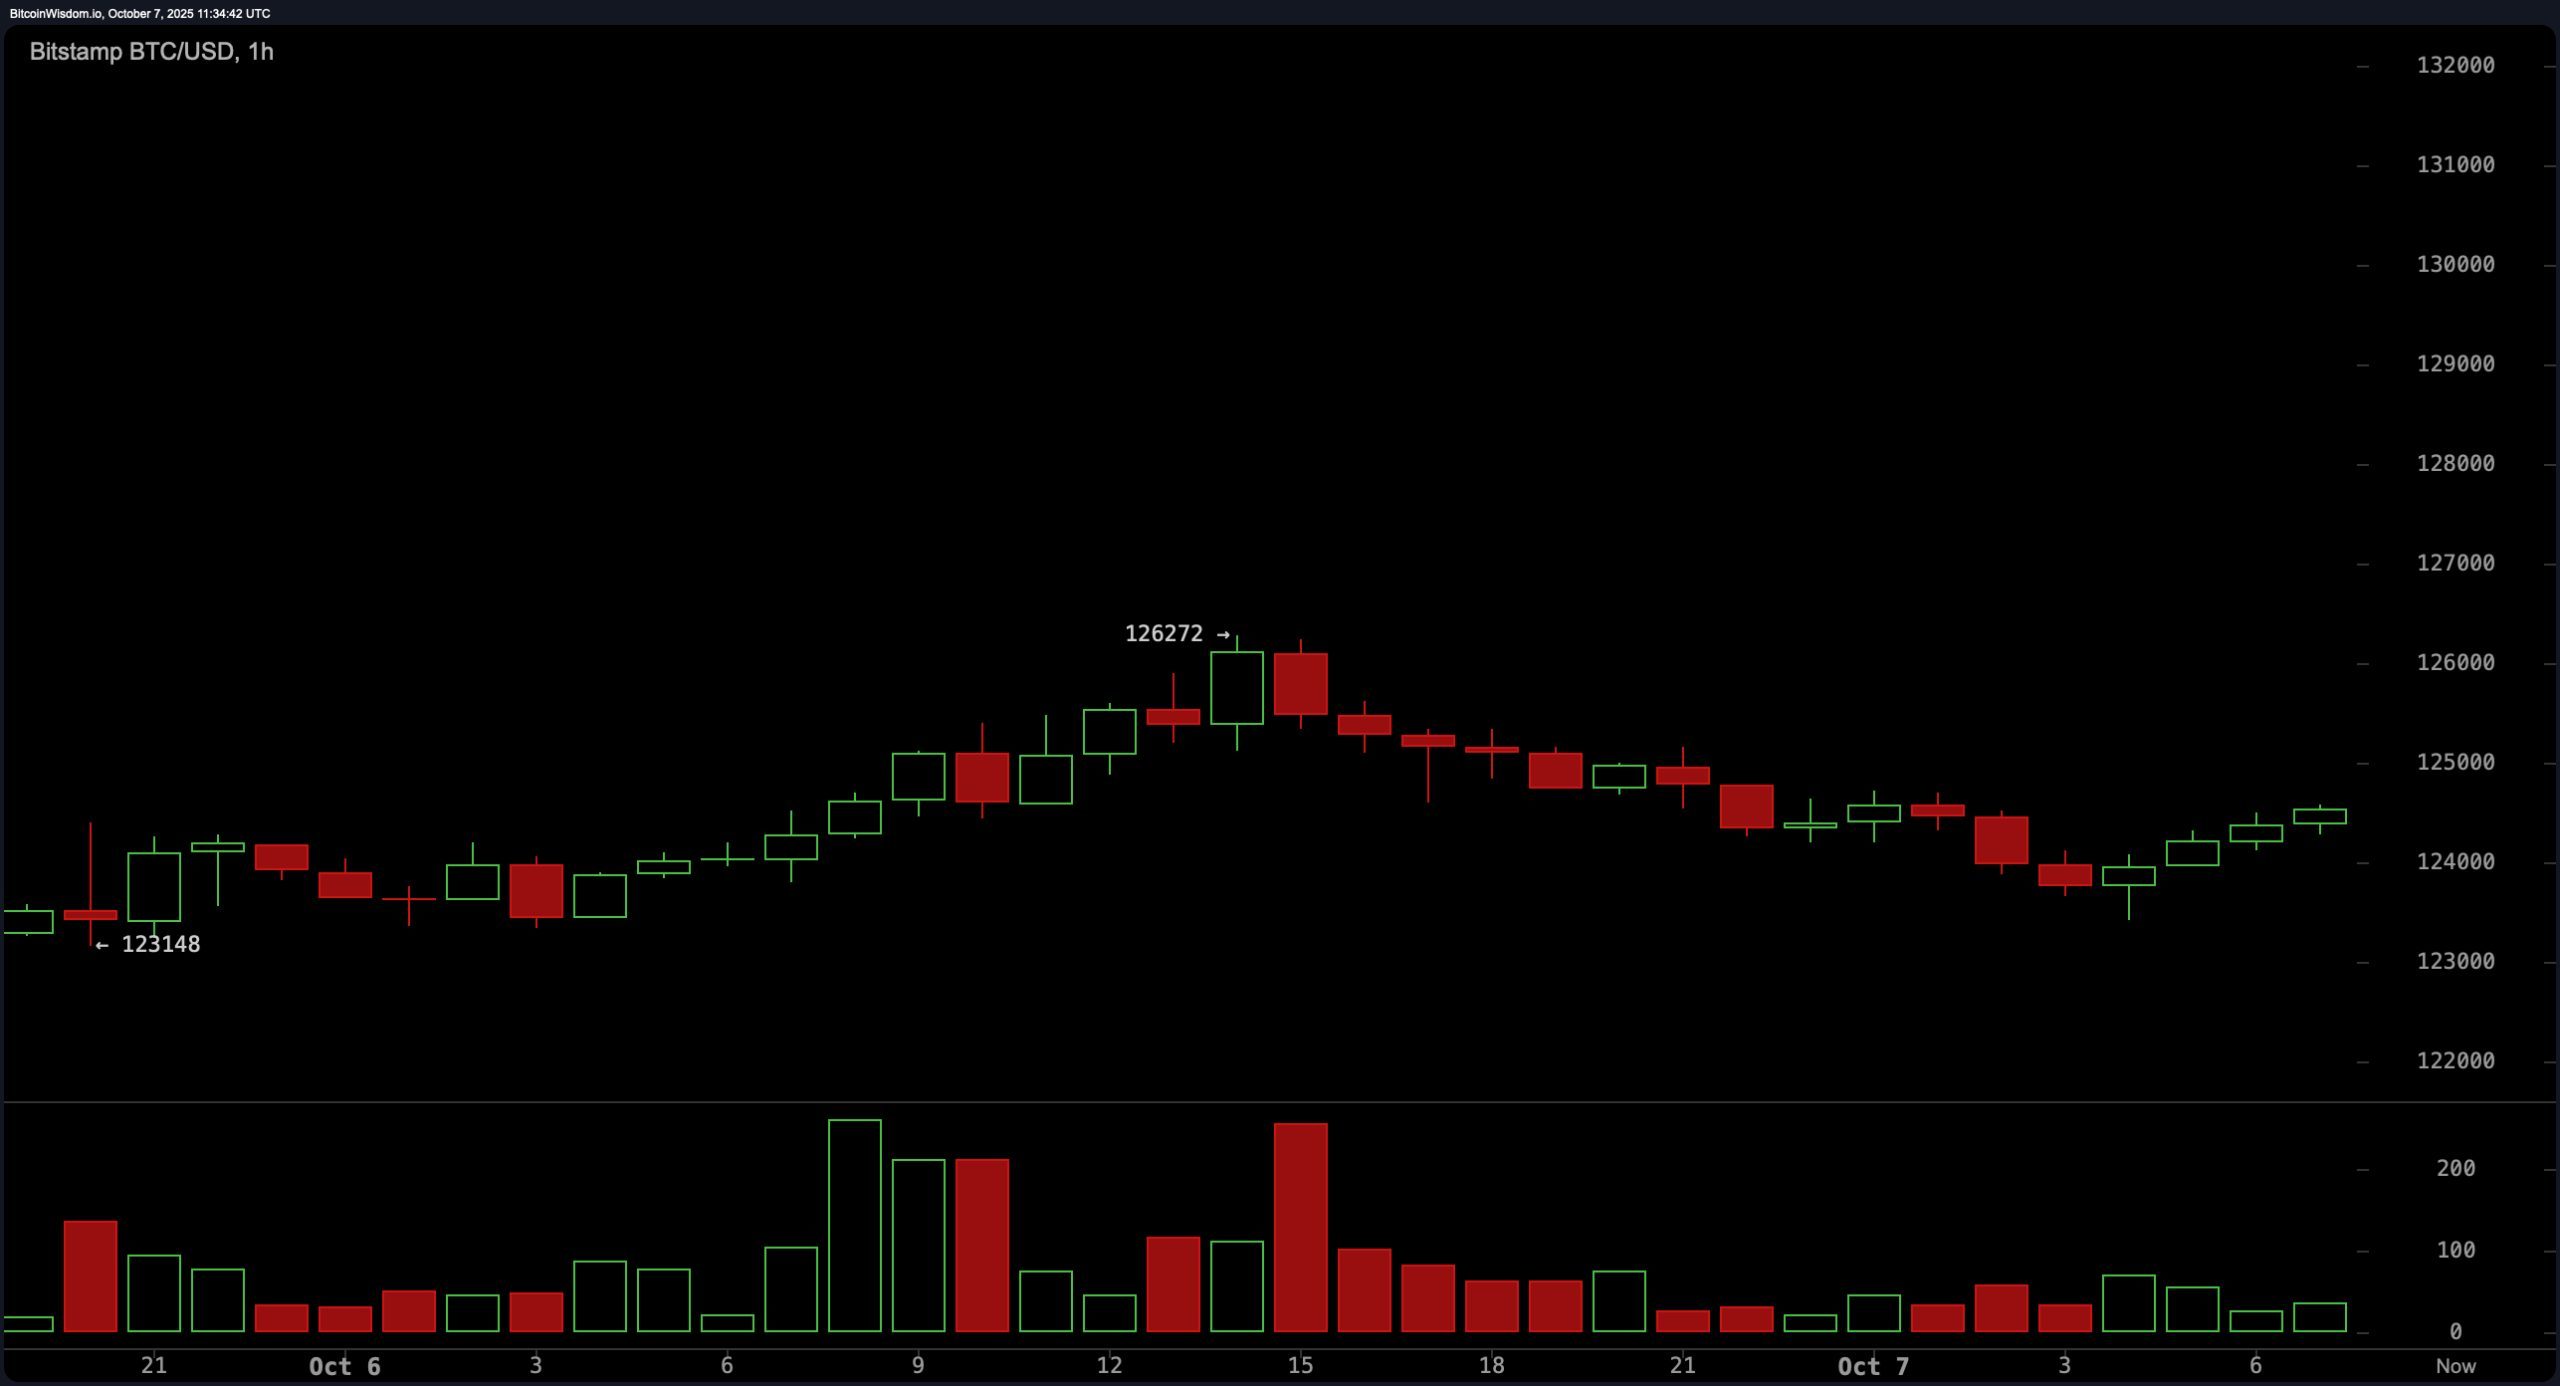
On the 1-hour chart, Bitcoin’s gearing up for its next big move-brace yourselves! It’s been forming a downtrend, lower highs, and lower lows… and it’s like, “What do I do now?” But wait, it’s found some footing above $124,000-will this be the spark that ignites a price rally? If we get a bullish engulfing candle off this support, expect a quick jump towards $125,500. But, if $125,000-$125,300 becomes a resistance zone, the bears will be out in full force, ready for their next snack. 🐻
So, what’s the deal with the oscillators? They’re sending us some mixed signals-kinda like that friend who’s always confusing you with their relationship status. The RSI is flashing red with a bearish vibe, but the Stochastic is staying neutral. Meanwhile, the CCI and momentum are all like, “Sell! Sell! Sell!” But the MACD? It’s still waving the “bullish” flag like it’s 1999. 🙃
Let’s talk about moving averages, shall we? All the major EMAs and SMAs from the 10-day to the 200-day are still flashing “bullish”-that’s a sign of a structurally strong market. If the price holds above the key support zones, we’ll keep this bullish train rolling. But the bulls better get their act together and show some conviction soon-otherwise, things might get real wobbly. 😬
Bull Verdict:
Okay, so if you’re betting on the bulls, you’ve got a decent chance. The major moving averages are in full “buy” mode, and price action is chilling above key support-no crashing below it (yet). A bounce off the $124,000 support could lead us back to $126,000 or higher, especially if the volume kicks in like it should. For now, this pullback is just a breather, not the end of the world.
Bear Verdict:
But the bears are not ready to call it quits! That rising wedge on the 4-hour chart is cracking like an old phone screen, and the indicators are flashing warning signs like a glitchy Netflix login. The RSI, momentum, and CCI are all screaming “SELL!” If Bitcoin breaks below $124,000 with some serious volume, we could see a plunge toward $122,000 or even worse. 🐻⛔
Read More
- Invincible Season 4 Gender Swaps Tech Jacket As Fans Question Major Comic Change
- Building Agents That Learn and Improve Themselves
- Gold Rate Forecast
- Games That Faced Bans in Countries Over Political Themes
- Silver Rate Forecast
- Trading Crypto with AI: A New Approach to Portfolio Management
- 15 Films That Were Shot Entirely on Phones
- Why Won’t It Just *Do* What You Ask? Unpacking the Quirks of AI Language
- Unveiling the Schwab U.S. Dividend Equity ETF: A Portent of Financial Growth
- Thinking Before Acting: A Self-Reflective AI for Safer Autonomous Driving
2025-10-07 15:28