
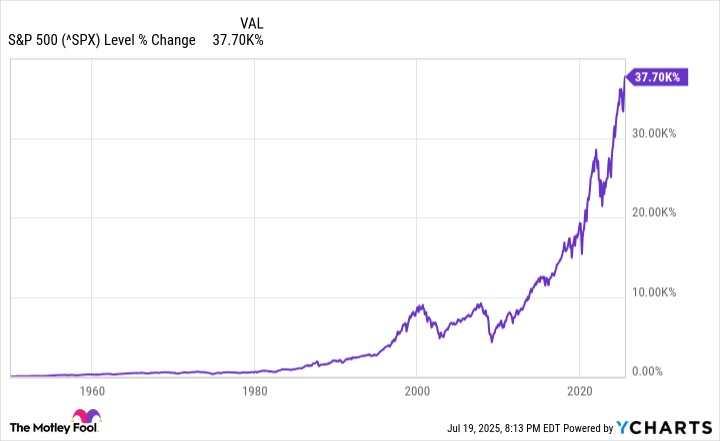
Over the past hundred years or so, no other investment type has consistently approached the yearly returns that stocks have delivered. Yet, it’s important to remember that the path from start (Point A) to finish (Point B) on Wall Street isn’t always a straight line.
Starting from January 2025, notable stock indices like the S&P 500, Nasdaq Composite, and the Dow Jones Industrial Average have experienced a rollercoaster ride of highs and lows. For instance, from the closing on April 2 to April 9, the S&P 500 suffered one of its top five largest two-day percentage drops (-10.5%) since 1950, while also recording its biggest single-day point increase since its creation.
While Wall Street is known for its inherent volatility, which some consider a necessary cost for accessing one of the world’s most powerful wealth-generating platforms, periods of intense volatility can stir emotions among investors. The main cause for the decline in the S&P 500, Nasdaq Composite, and Dow Jones Industrial Average during late March to early April was President Trump’s “Liberation Day” tariff and trade policy announcement. This raises the question: Could we be witnessing a second wave of market downturns due to Trump’s policies, often referred to as the “Trump dump”?
Liberation Day 2.0 is almost here — should investors be worried?
On April 2nd, the day Trump labeled as “America’s Liberation Day” on social media, the president revealed his tariff and trade policy. He proposed a standard 10% global tariff and higher “retaliatory tariffs” against numerous countries that have traditionally had an unfair trade surplus with America. This announcement led to the S&P 500’s significant drop of more than 10% over two consecutive days.
A week past, Donald Trump temporarily halted the reciprocal tariffs for a period of 90 days (ending July 9), causing a surge in the S&P 500, Nasdaq Composite, and Dow. Two days before the initial 90-day suspension expired, President Trump issued an executive order to extend this tariff halt until August 1. As a result, the first day of August is effectively “Liberation Day 2.0” for the Trump administration as well as Wall Street.
Could it be that stock prices will mirror their behavior from early April nine days from now, as if history is repeating itself in the market?
According to historical precedent, it’s typical for President Trump to announce or implement tariffs that are initially weakened by market responses; however, a significant drop in stock prices, often referred to as a “Trump dump,” appears improbable at this time.
In December, a group of four economists from the New York Federal Reserve, working under the name Liberty Street Economics, released a report titled “Do Import Tariffs Benefit U.S. Businesses?” This report examined the effects of the tariffs imposed by Trump on China during 2018 and 2019 on companies whose stocks are publicly traded.
It wasn’t particularly surprising to find out that businesses affected by Trump’s earlier China tariffs tended to perform worse compared to those not impacted by the tariffs, especially on the days when tariff announcements were made.
A more significant inference from Liberty Street’s examination is that businesses affected by Trump’s trade war tariffs experienced poorer future economic results compared to those unaffected. From 2019 to 2021, there was a general decline across various indicators such as labor productivity, sales, employment, and profits for companies subjected to the tariffs. This implies that although a sudden drop in Trump’s stock market value might not be happening soon, a prolonged negative impact from tariffs could become a factor to consider.
Wall Street has a bigger concern than Trump’s tariffs
While President Trump’s tariff and trade policies are dominating headlines, it’s worth considering that these tariffs may not pose the greatest risk to the ongoing bull market. Instead, the market’s unusually high valuation could potentially be a more significant concern.
Let’s tackle the obvious point: the term “valuation” can be quite subjective. One person may view something as expensive, while another investor might see it as a bargain. This subjectivity is part of what makes the stock market such a dynamic and diverse “marketplace”.
In this specific case, one of Wall Street’s reliable methods for determining value suggests that the stock market is unusually expensive with limited room for debate.
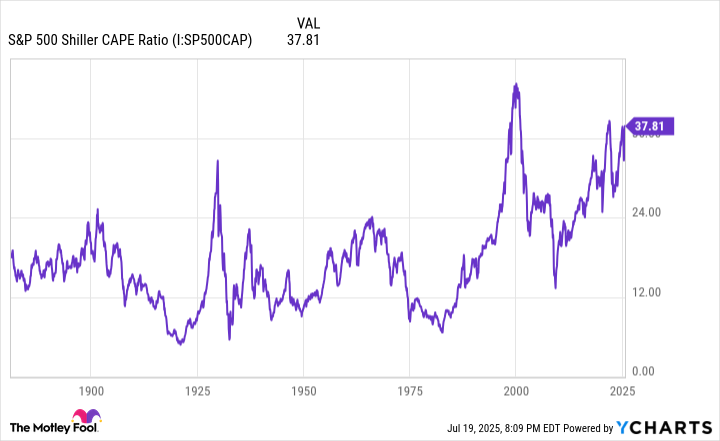
In December, the Shiller price-to-earnings ratio (P/E), also known as the cyclically adjusted P/E ratio or CAPE Ratio, reached a multiple of 38.89 – its highest value during this ongoing bull market and the third most expensive during a prolonged bull market when data is traced back to January 1871. The Shiller P/E uses the average inflation-adjusted earnings over a decade, making it resistant to distortions caused by unusual events like the COVID-19 lockdowns.
To help you understand just how much higher than historical averages the current Shiller P/E ratio of 38.37 (as of July 18 closing bell) stands, it’s important to know that this figure represents a significant increase of approximately 122% compared to the average multiple of 17.26, which has been observed over the past 154 years.
To elaborate, this reliable valuation method has seldom exceeded a multiple of 30, and maintained that level for at least two months, on only six occasions since 1871. The five instances prior to the current one were all followed by market corrections in the S&P 500, Nasdaq Composite, and/or Dow Jones Industrial Average, which ranged from a decline of 20% to as high as 89%.
In simpler terms, history has shown us that while exactly when the stock market peaks can’t be predicted, high valuation prices don’t last forever. Even though Liberation Day 2.0 might act as a trigger for downturns on Wall Street, the higher-than-usual valuations pose a greater risk to stocks over time.
Time can trump tariff- and valuation-related uncertainty
Should history follow a pattern or recur, there might be minor setbacks for the main stock market indicators. However, it’s comforting to note that history and time generally side with investors who have a positive, long-term outlook.
Regardless of the moment, it’s usual to encounter one or more obstacles that could potentially push stock prices down. Some of these challenges may be clearly visible, like President Trump’s tariffs. On other occasions, they might emerge unexpectedly, similar to what happened during the COVID-19 pandemic when unforeseen factors arose.
It’s common and unavoidable to experience corrections, bear markets, and even sudden drops like an elevator plummeting in the S&P 500, Nasdaq Composite, and Dow Jones. However, what has consistently occurred is the expansion of the U.S. economy, increased corporate profits, and new record highs for these major stock indexes.
Annually, analysts at Crestmont Research refresh a dataset they’ve published, which investigates the cumulative returns over 20 years, inclusive of dividends, for the diverse S&P 500. Although the S&P 500 wasn’t established until 1923, Crestmont was able to trace the performance of its constituents in significant indexes dating back to 1900. This allowed them to generate 106 sets of 20-year total return data (e.g., 1900-1919, 1901-1920, up until 2005-2024).
Over two-decade spans, even those covering wars, economic downturns, pandemics, and market fluctuations like bubbles, all 106 such periods would have resulted in a positive yearly return for investors. In simpler terms, if an investor had bought and held an S&P 500 index fund for 20 years in each of these instances, they would have made money every single time, without exception.
Furthermore, investors wouldn’t have experienced minimal profit growth over these 20-year spans. Approximately half of the 106 periods analyzed yielded annual returns ranging from 9.3% to 17.1%. Returns at this level can double your investment every four to eight years.
If Donald Trump’s tariff and trade policies cause a temporary setback in the ongoing bull market, it could offer a chance to purchase stocks at reduced prices for future growth opportunities.
Read More
- Top 20 Dinosaur Movies, Ranked
- 20 Movies Where the Black Villain Was Secretly the Most Popular Character
- Celebs Who Narrowly Escaped The 9/11 Attacks
- 25 “Woke” Films That Used Black Trauma to Humanize White Leads
- Spotting the Loops in Autonomous Systems
- Gold Rate Forecast
- The 10 Most Underrated Jim Carrey Movies, Ranked (From Least to Most Underrated)
- Silver Rate Forecast
- The Best Directors of 2025
- Transformers Under the Microscope: What Graph Neural Networks Reveal
2025-07-23 10:22