The price of MOVE has decreased by around 11% in the last day, which extends its decline over the past week to 26%. Technical analysis tools like the RSI and Ichimoku Cloud suggest a very bearish trend for MOVE, as it’s currently trading near oversold levels and significantly below the cloud.
In other words, the price of MOVE has been falling sharply and may continue to do so based on technical indicators. It is currently at a level that often indicates the market has overreacted in a negative direction.
Lately, the emergence of a “death cross” pattern has boosted the downward trend, indicating higher selling forces at play. To reverse this trend for MOVE, it needs to surpass significant resistance points. But if it can’t maintain its current support, we might see additional drops.
Movement RSI Is Still Close to the Oversold Zone
Right now, the Relative Strength Index (RSI) for the stock is at 33.3, slightly rebounding after a dip to 29.7 a short while ago. This significant decrease stands in stark contrast to its RSI of 53 only two days prior, indicating that the asset has quickly moved from neutral territory into an oversold state, suggesting a rapid decline.
The Relative Strength Index (RSI) is a tool used to evaluate an asset’s buying and selling momentum, with values ranging from 0 to 100. When the RSI falls below 30, it suggests that the asset could be undervalued because it might be oversold, possibly indicating a good time for investment. On the other hand, if the RSI exceeds 70, it indicates that the asset may be overbought, suggesting potential price corrections or a less advantageous buying opportunity.
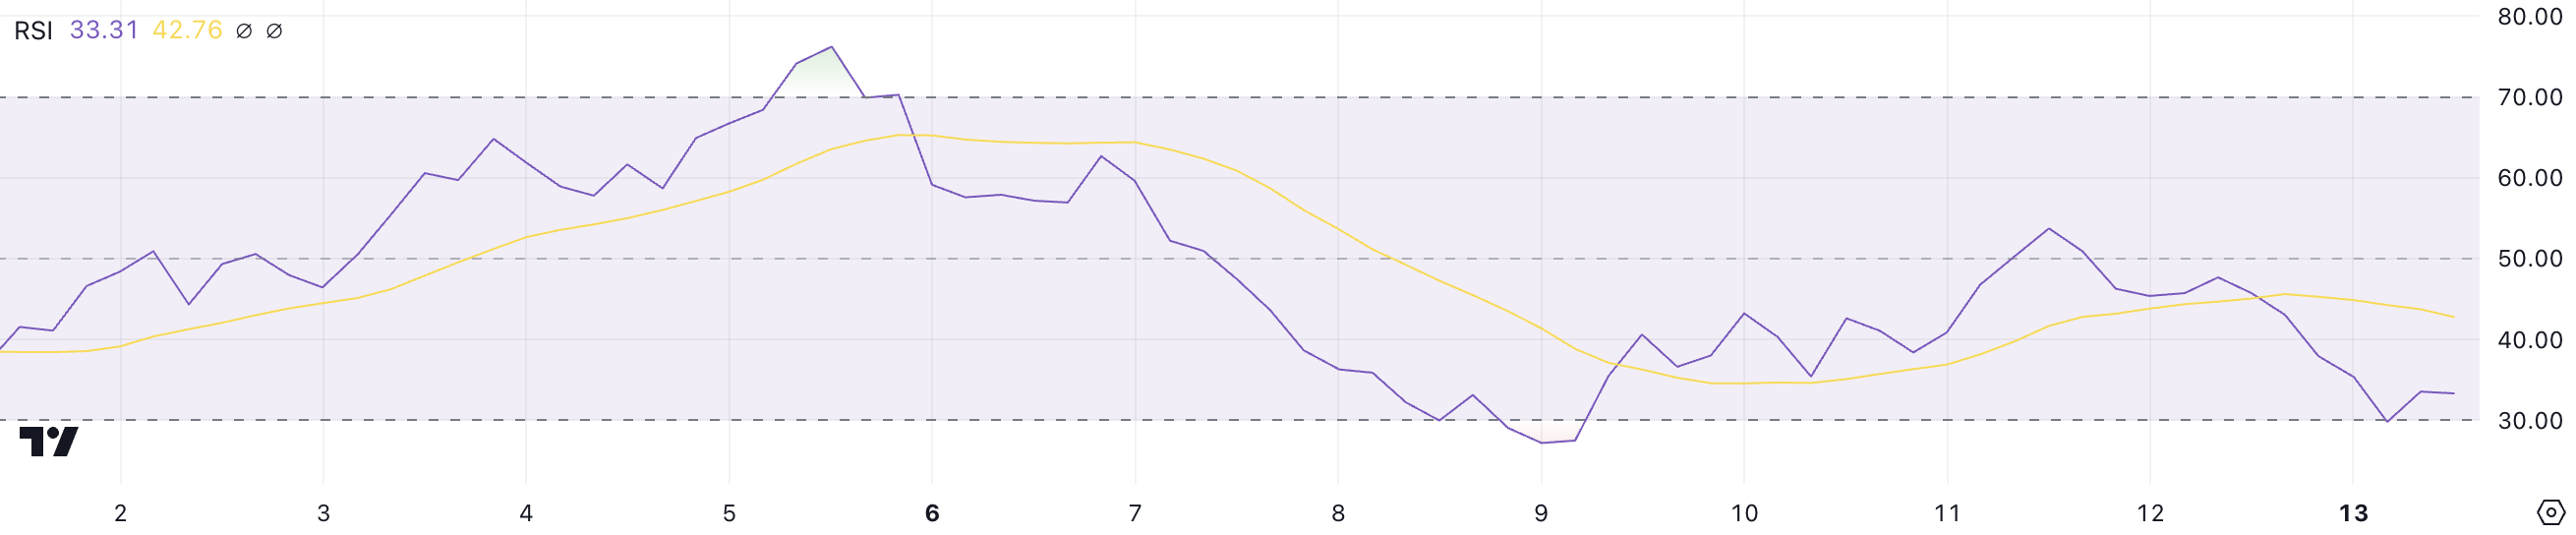
With Move’s Relative Strength Index (RSI) standing at 33.3, it continues to hover close to oversold territory, which might entice buyers looking for affordable entry points. This level indicates that the recent market pressure could be showing signs of lessening slightly, implying a possible opportunity for price stabilization or rebound.
If the Relative Strength Index (RSI) doesn’t recover and move towards neutral values, it might suggest prolonged bearish momentum. This could potentially keep the price of MOVE down in the near future, despite Movement Labs securing $100 million in funding.
MOVE Ichimoku Cloud Paints a Bearish Picture
For the MOVE stock, the Ichimoku Cloud indicates a significantly bearish trend, as the price is noticeably lower than the cloud’s boundaries.
The cloud is expanding and turning red, indicating a strengthening downward trend with no signs of abatement soon. This strong bearish momentum has pushed MOVE out of the top 50 cryptocurrencies, currently ranked at number 59.
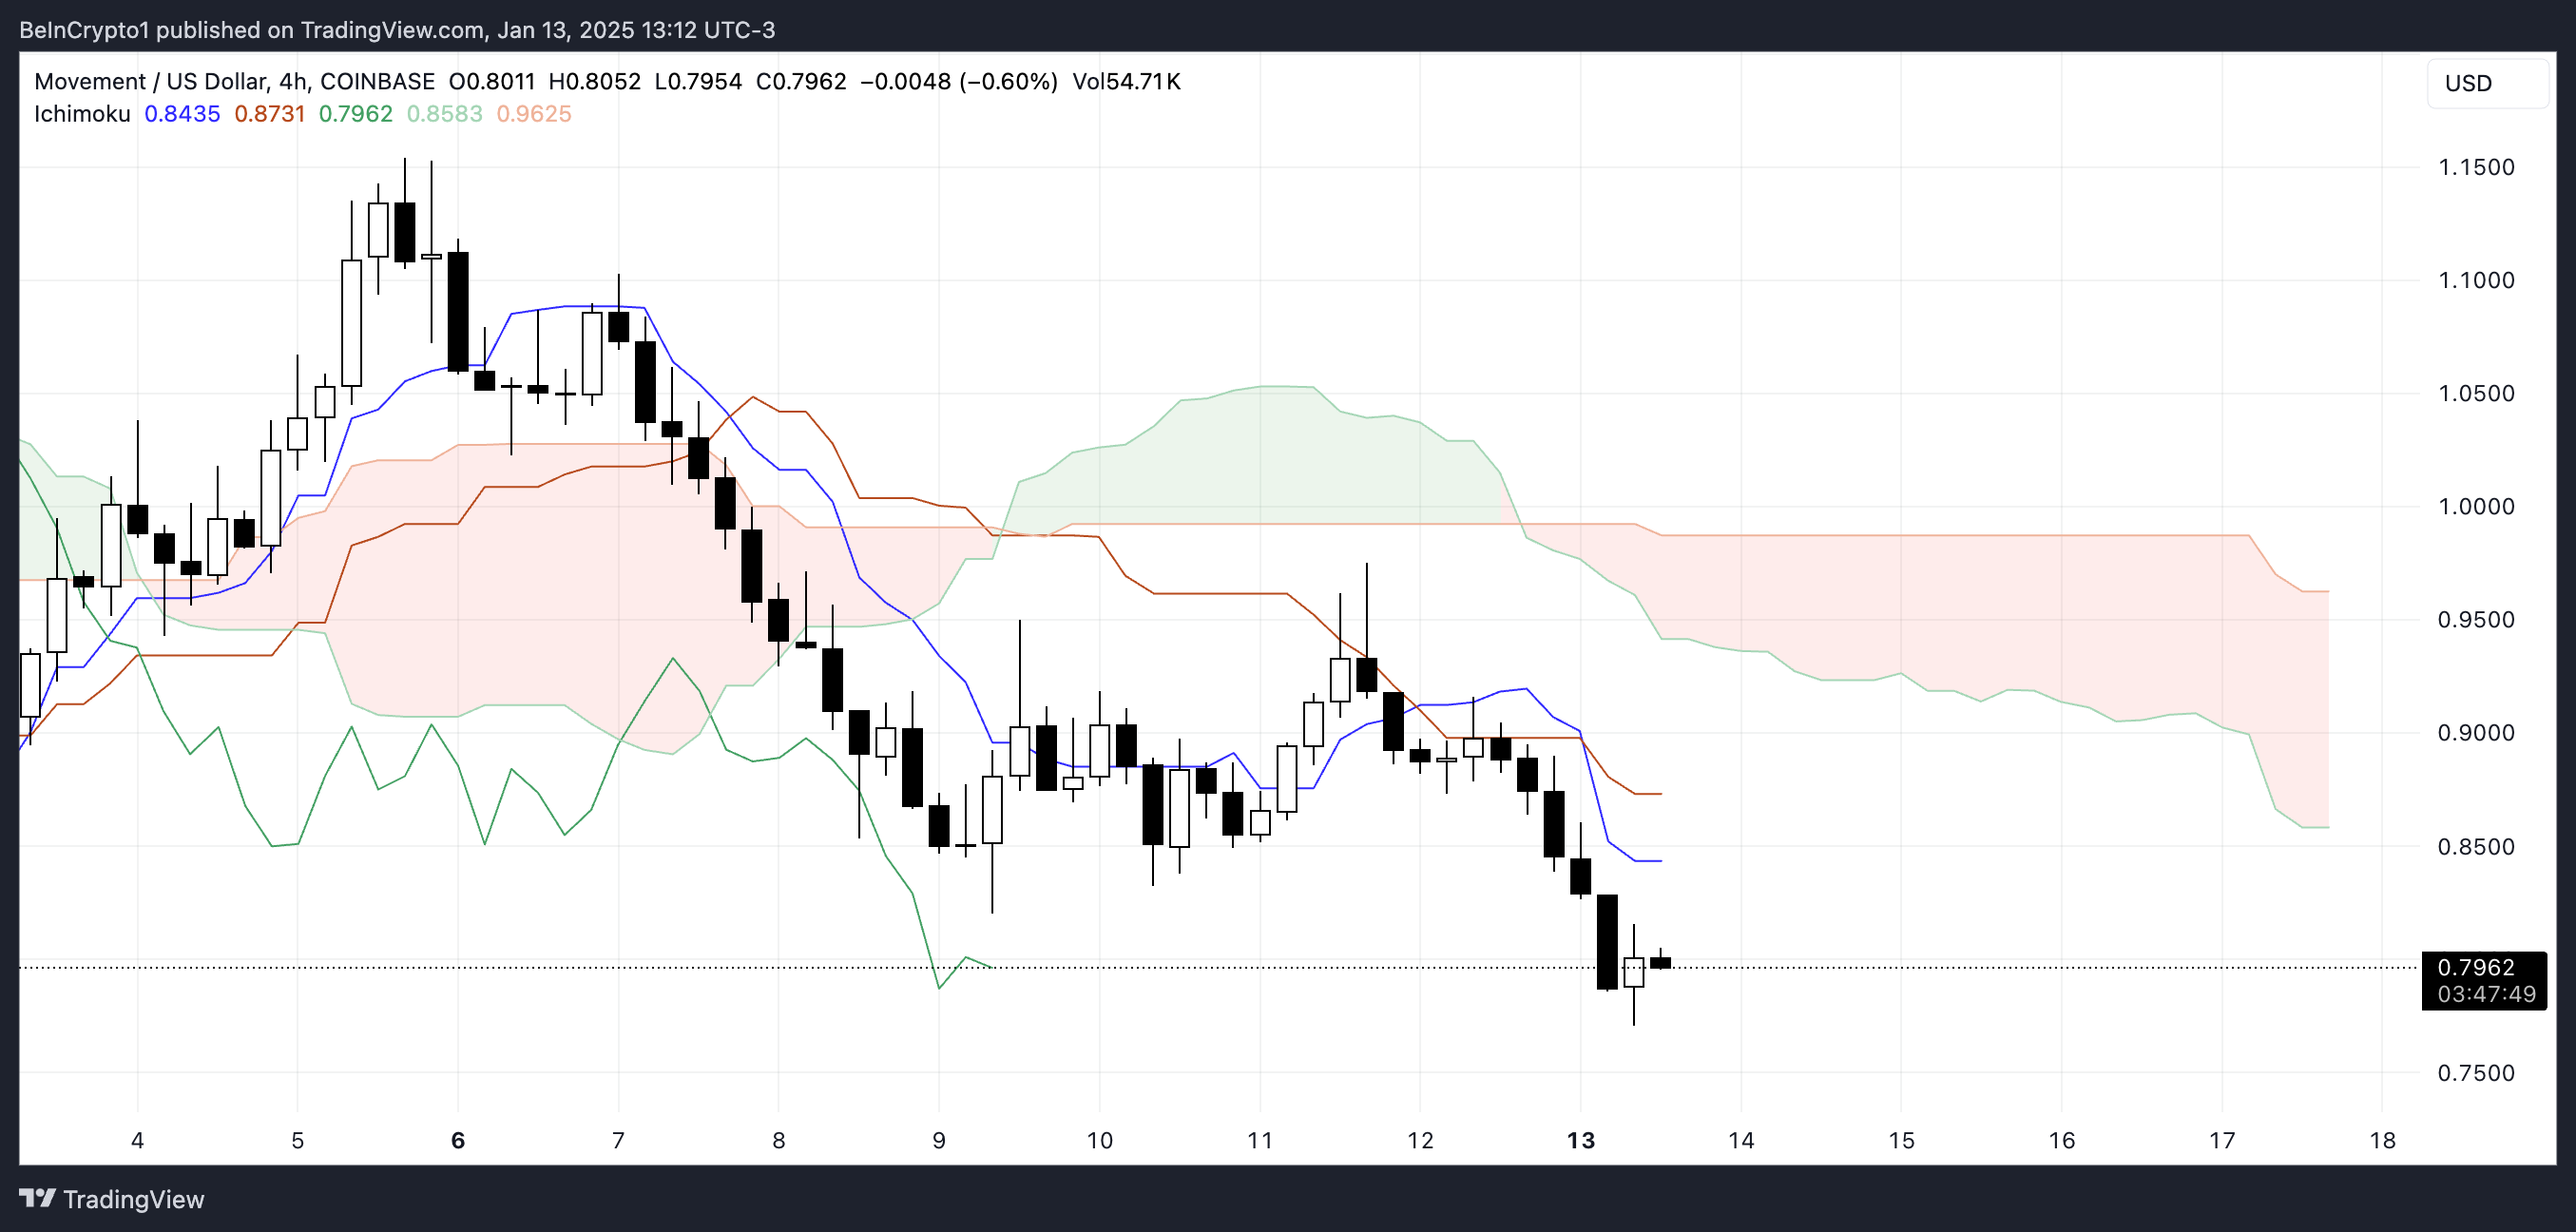
In simpler terms, the blue trendline stays lower than the red base line, indicating a temporary downward market trend. Furthermore, the trailing green line sits beneath both the current price and the cloud, strengthening the prediction for a continued downturn.
Based on the Ichimoku alignment, it appears that we’re witnessing a prolonged downward trend without any clear signs of an imminent uptrend. The market seems to be under the control of sellers, as suggested by the overall shape and lines of the cloud.
MOVE Price Prediction: Will MOVE Recover $1 Levels Soon?
The short-term moving average for the MOVE index has lately dropped beneath its long-term counterpart, a pattern known as a “death cross.” This is generally seen as a negative sign since it indicates an increase in downward momentum. This technical configuration strengthens the prevailing bearish trend and hints that selling pressure continues to outweigh buying pressure.
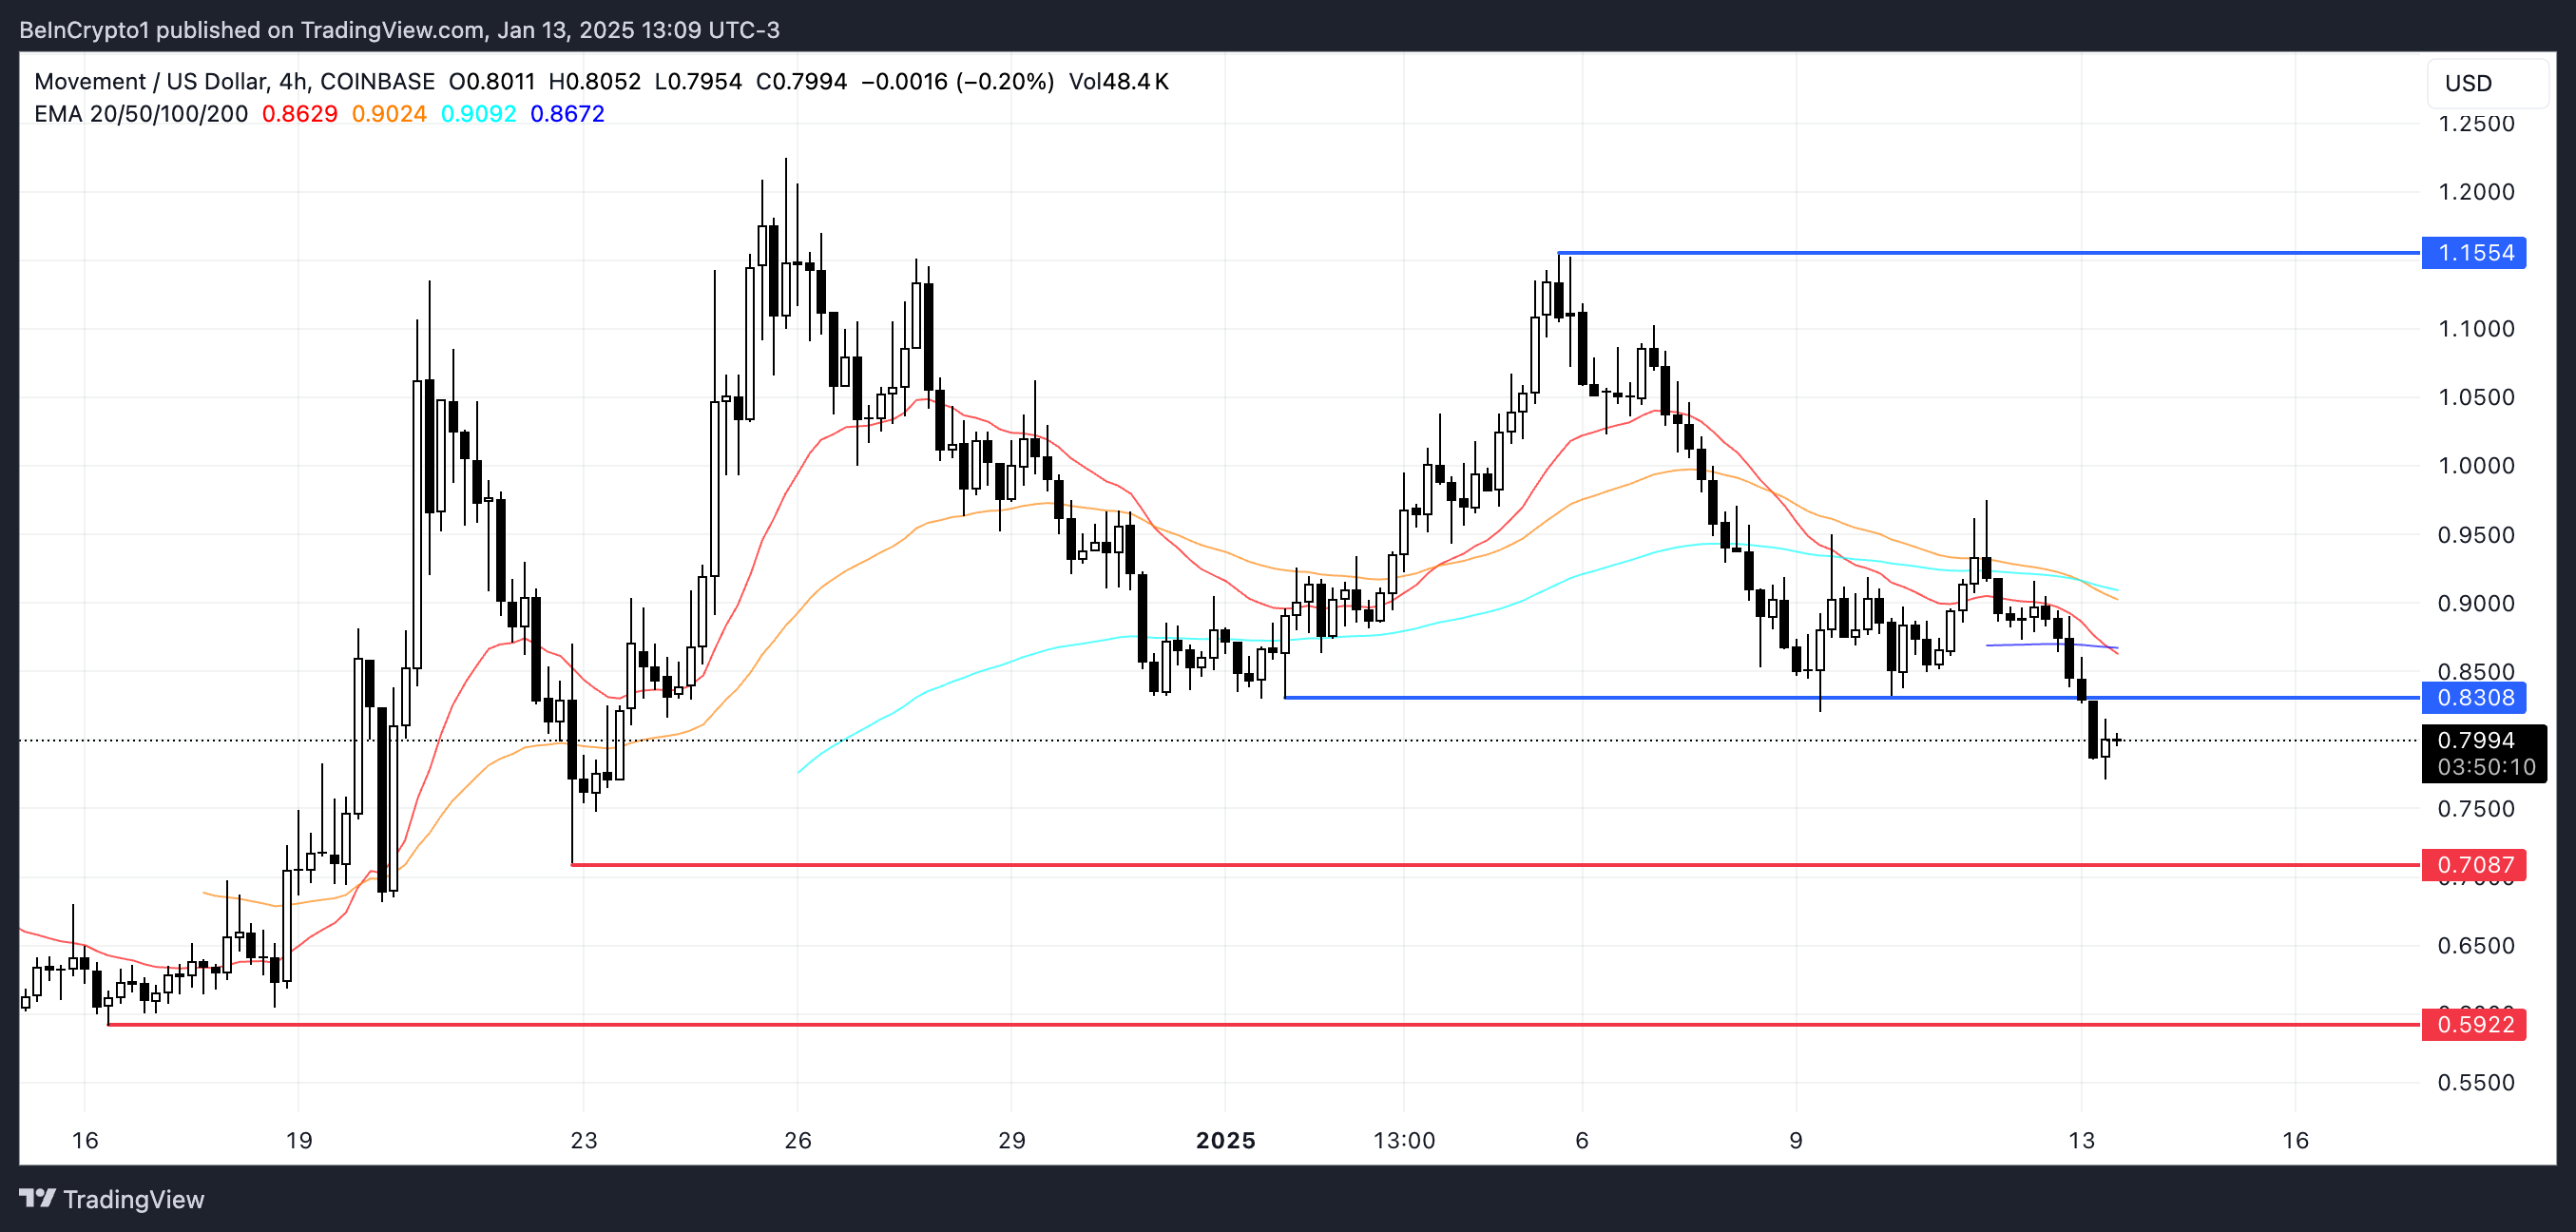
If the ongoing downtrend continues and the price support at $0.70 weakens, there’s a possibility that the value might drop to around $0.59. On the flip side, if an uptrend starts, MOVE may be able to breach the resistance at $0.83 and climb as high as $1.15, representing a potential increase of 43%. Such a move could help MOVE regain its position among the top 50 altcoins.
Read More
- Apothecary Diaries Ch.81: Maomao vs Shenmei!
- Gold Rate Forecast
- Mobile MOBA Games Ranked 2025 – Options After the MLBB Ban
- Who was Peter Kwong? Learn as Big Trouble in Little China and The Golden Child Actor Dies at 73
- Summer Game Fest 2025 schedule and streams: all event start times
- Every Fish And Where To Find Them In Tainted Grail: The Fall Of Avalon
- Batman and Deadpool Unite: Epic DC/Marvel Crossover One-Shots Coming Soon!
- Elden Ring Nightreign update 1.01.1 patch notes: Revive for solo players, more relics for everyone
- ‘This One’s About You’: Sabrina Carpenter Seemingly Disses Ex-Boyfriend Barry Keoghan in New Song Manchild
- Hunter Schafer Rumored to Play Princess Zelda in Live-Action Zelda Movie
2025-01-14 05:00